
This document is relevant for: Inf1, Inf2, Trn1, Trn2, Trn3
Viewing Profiles with Perfetto#
Note
New Neuron Explorer features released in 2.27 and onwards may not be supported in Perfetto. For the full user experience and features set, please use the Neuron Explorer UI or VSCode Integration.
Perfetto is an open-source trace analysis toolkit with a powerful UI for visualizing and analyzing trace data. Users of Neuron Profiler have the option of viewing their profiles in the Perfetto UI.
The --output-format perfetto option writes processed data to Perfetto’s native protobuf-based tracing format which can be visualized in the Perfetto UI at https://ui.perfetto.dev/.
Example:
neuron-explorer view -d ./output --output-format perfetto
This will generate a system_profile.pftrace file for the system profile and a device_profile_model_<model_id>.pftrace file for each unique compiled model that was executed on a Neuron Device.
To view the system profile, go to https://ui.perfetto.dev/ and open the system_profile.pftrace file.
Note
When loading trace files in the Perfetto UI, your data is processed locally and not uploaded to Perfetto’s servers.
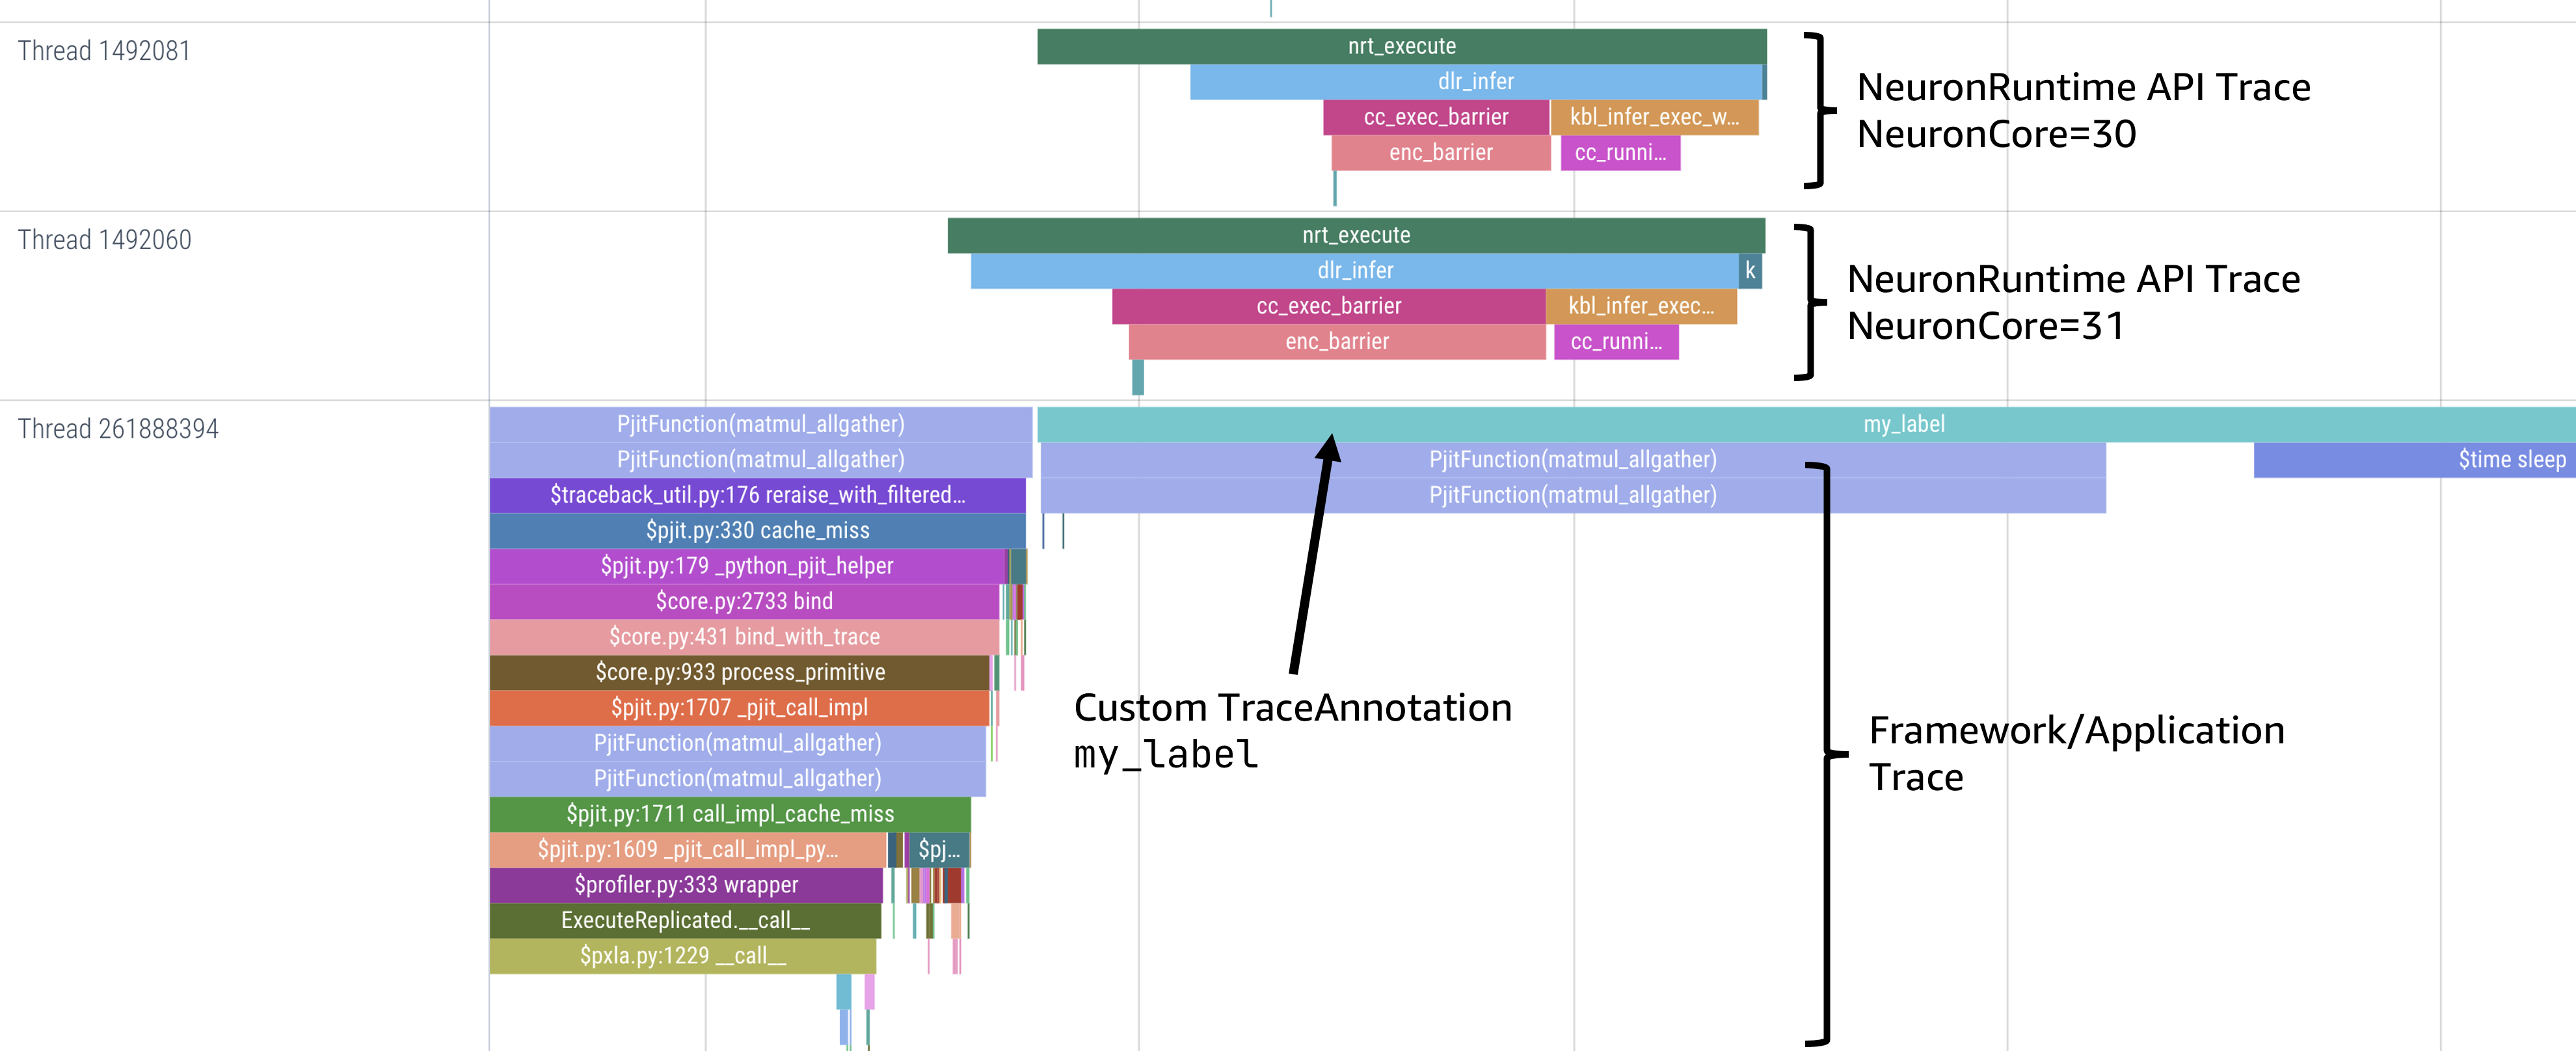
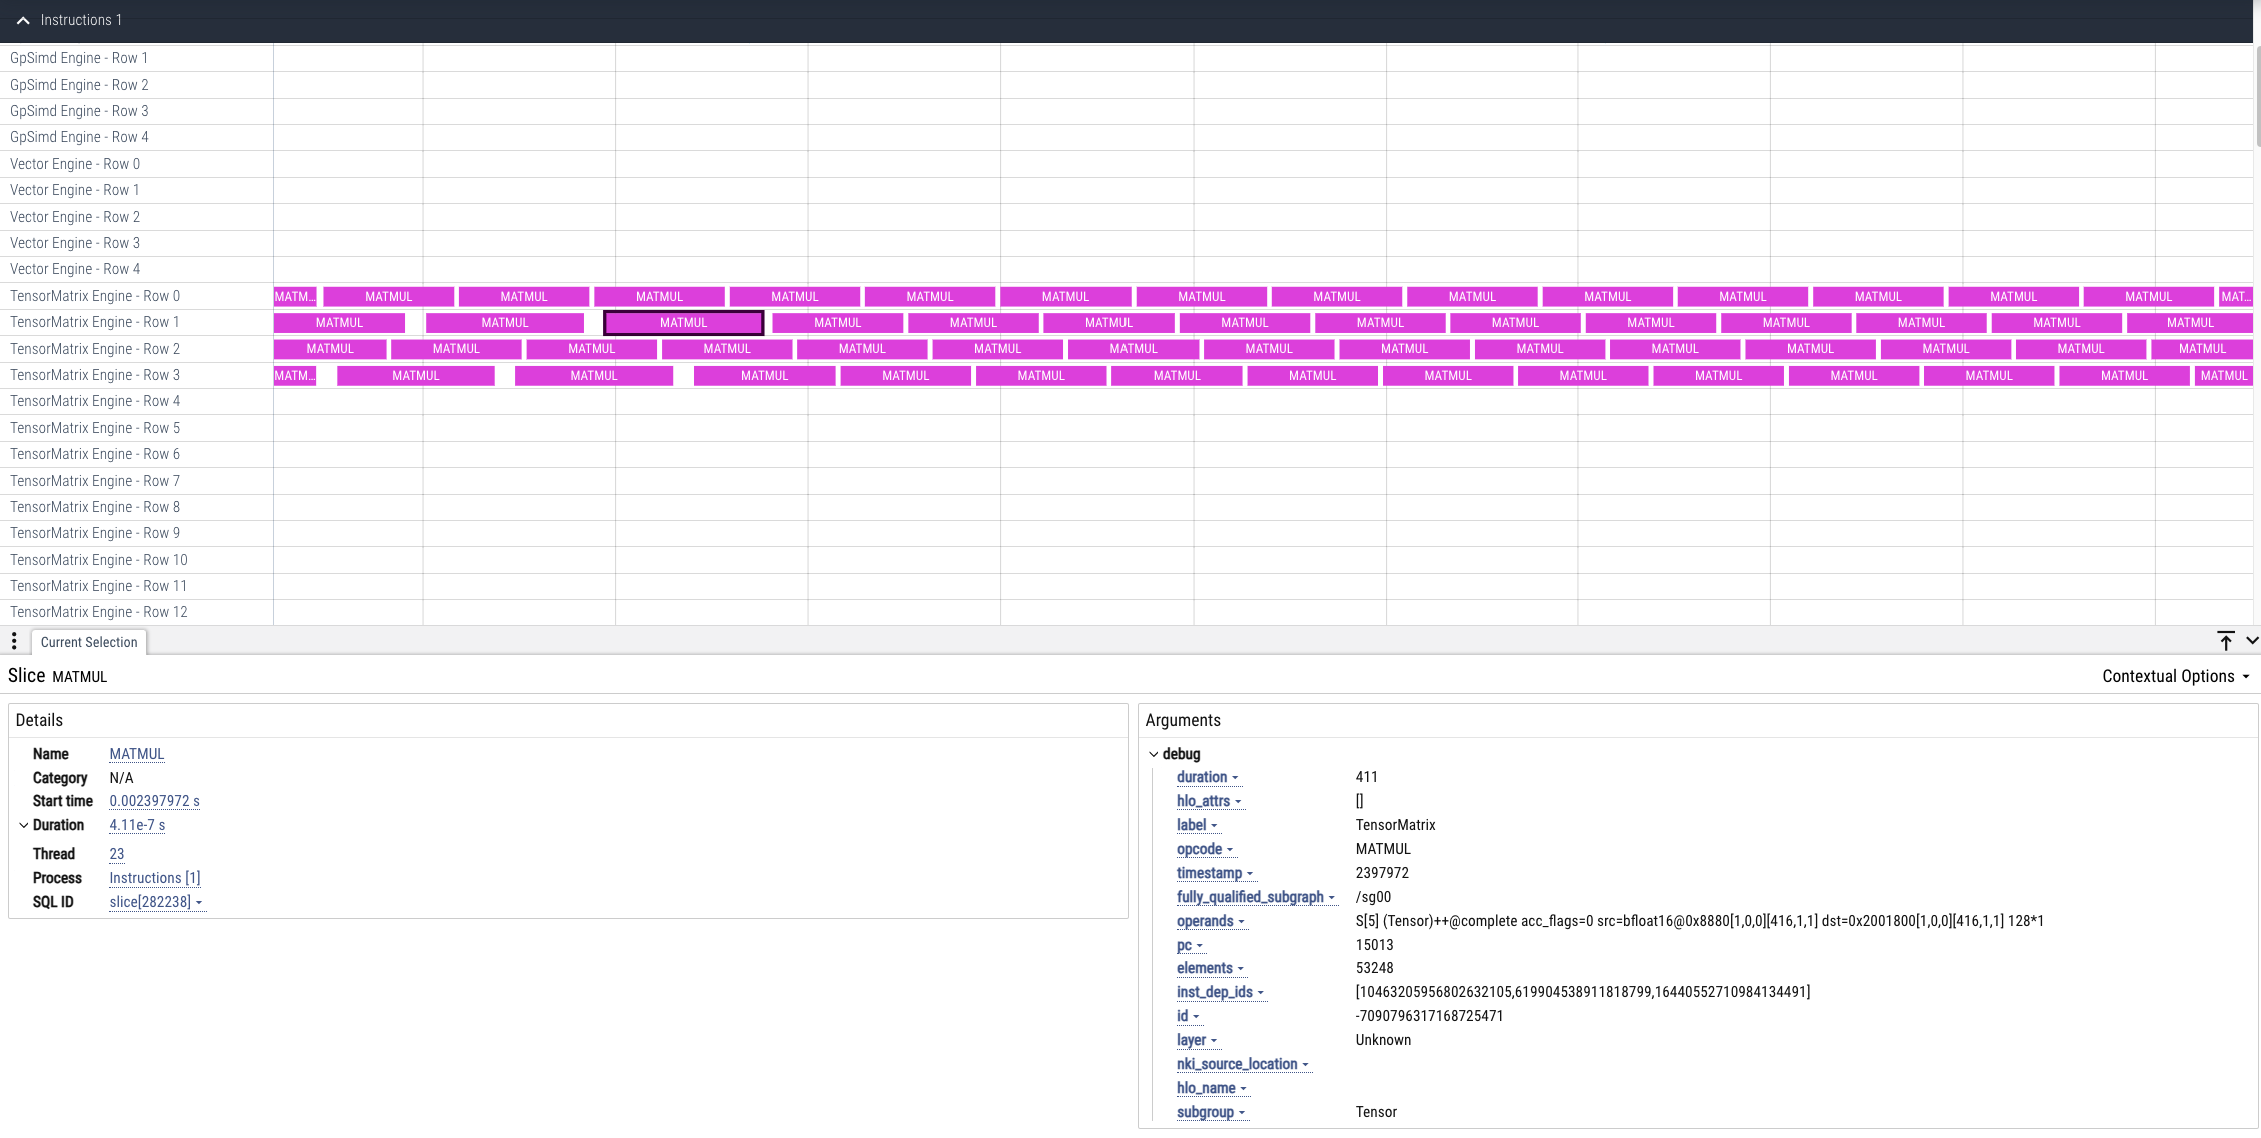
To view a device profile go to https://ui.perfetto.dev/ and open the device_profile_model_<model_id>.pftrace file. This will show a detailed view of hardware activity on the NeuronCore during execution of this graph.
Note
Your browser may run out of memory when viewing *.pftrace (Perfetto trace) files that are more than a few hundred MB. See the section Viewing Large Profiles in Perfetto for directions on how to view large traces using the trace processor.
Perfetto Output View Options#
When outputting to Perfetto it is possible to group your traces by different attributes. This is useful for larger profiles involving many NeuronCores and instances. The following options are available:
CLI option |
Description |
|---|---|
|
First-order grouping of trace events (maps to a Perfetto process / process group of rows). Provide a comma-delimited list of field names. Allowed fields: |
|
Second-order grouping of trace events (maps to a Perfetto thread / single row). Provide a comma-delimited list of field names. Allowed fields: |
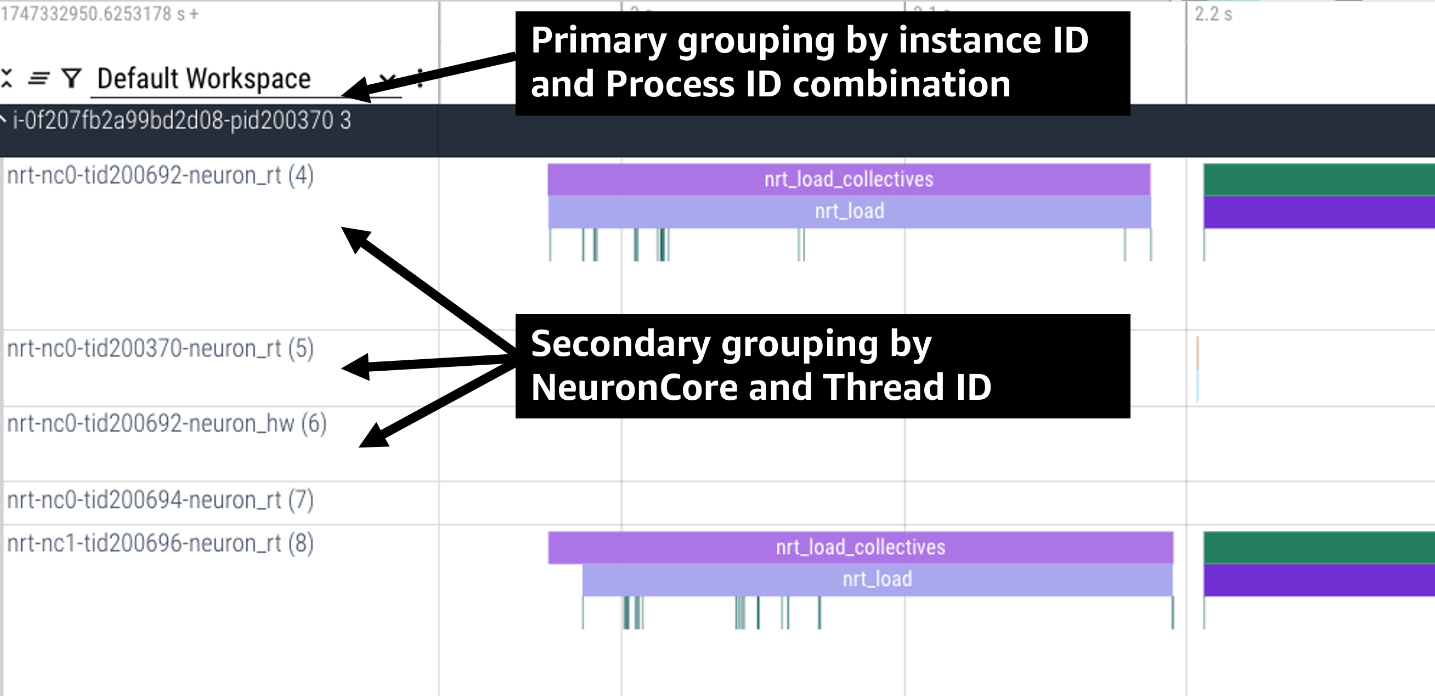
For example, the following profile uses neuron-explorer view --output-format=perfetto --system-trace-primary-group=instance_id,process_id --system-trace-secondary-group=lnc_idx,thread_id to group the system profile first by unique combinations
of instance_id and process_id, and then in each of those groups there are rows of events with unique combinations of lnc_idx and thread_id.
Grouping By Global Worker ID#
By default, Perfetto traces are grouped by worker_gid which is a unique global identifier for each NeuronCore across all instances in a distributed workload.
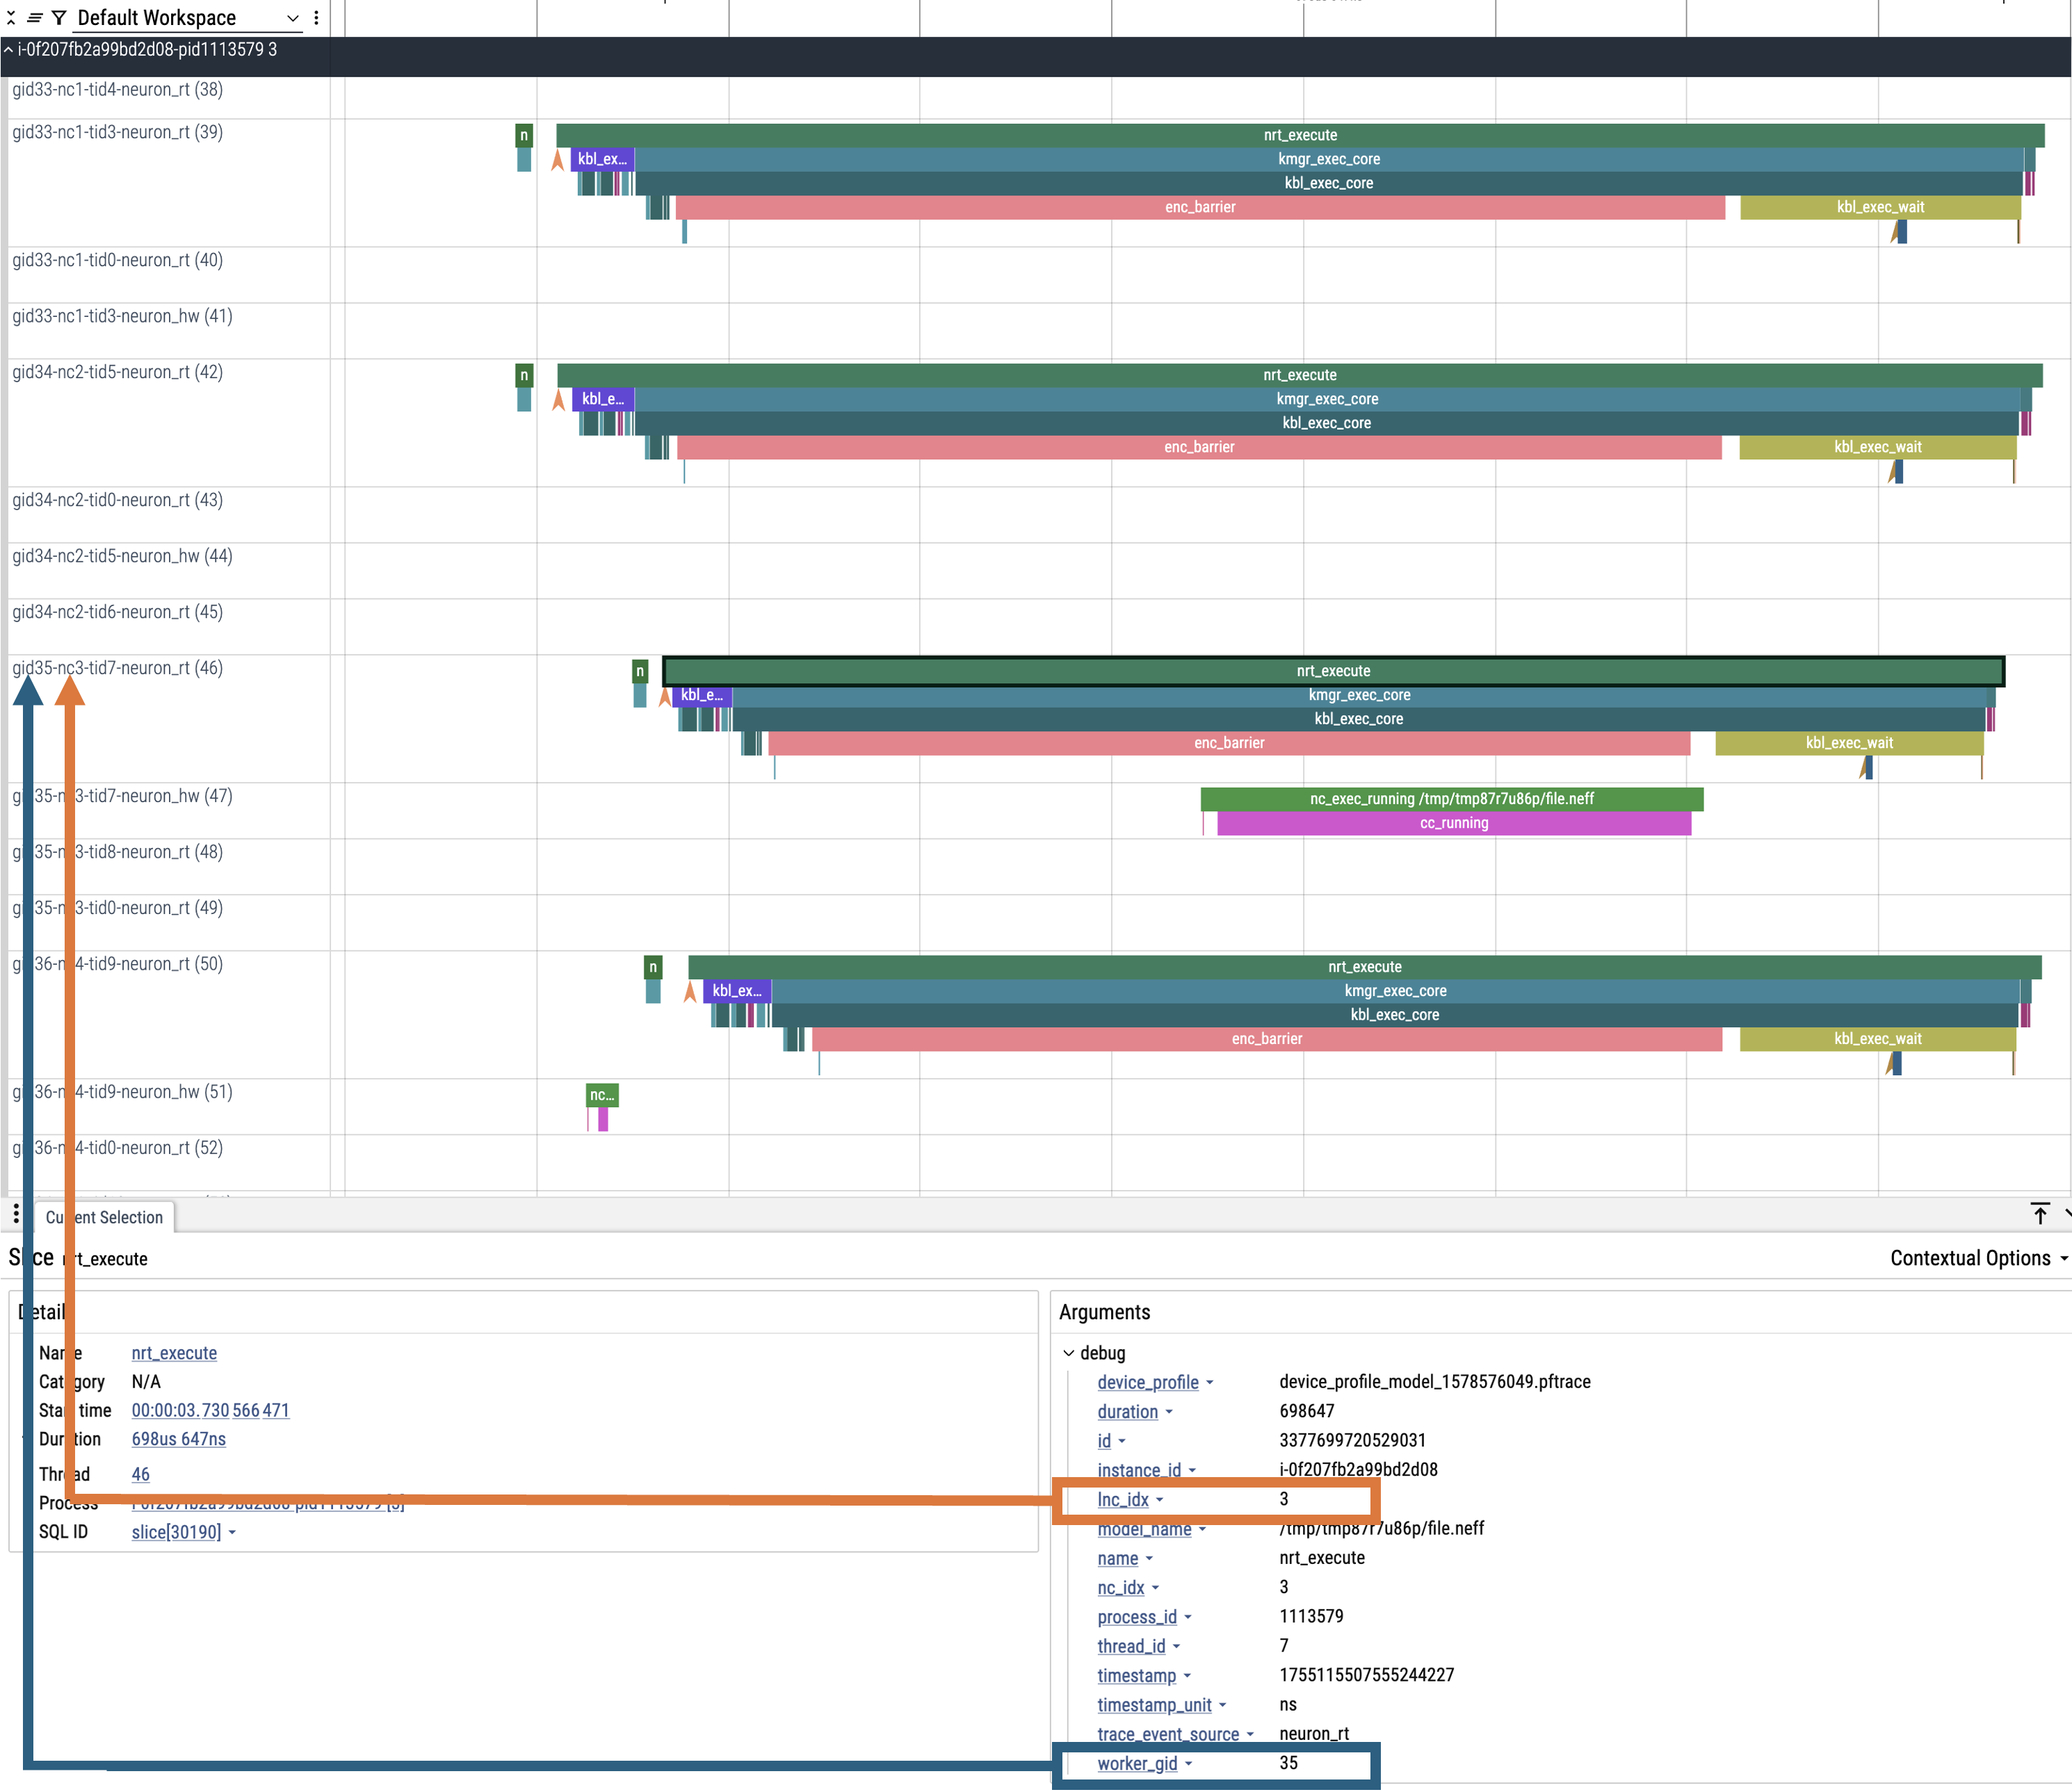
When clicking on an event in the trace you will see fields for both lnc_idx (local NeuronCore index on that process) and worker_gid (global NeuronCore index across all instances).
It is possible for lnc_idx to be the same for different processes on the same instance or across different instances in a distributed workload. However, worker_gid is unique for each NeuronCore across all instances.
The image below shows how to correlate the naming of tracks (rows) in the Perfetto UI to both lnc_idx and worker_gid.
This document is relevant for: Inf1, Inf2, Trn1, Trn2, Trn3