
This document is relevant for: Inf2, Trn1, Trn2
Developer Guide for Profiling with PyTorch NeuronX#
Introduction#
The Neuron PyTorch profiler is a context manager wrapping around the entire model
and training loop. Specifically this is the context manager:
torch_neuronx.experimental.profiler.profile. This is a wrapper of
the XLA Debug Profiler which we imported earlier as
import torch_xla.debug.profiler as xp, and is backwards-compatible.
Here are the parameters of the profiler context manager:
port: Port to run the profiling GRPC server on. Default is 9012.profile_type: There is “trace” and “operator”. “trace” is the Torch Runtime Trace Level, while “operator” is the Model Operator Trace Level.ms_duration: This defines how long the profiler will capture the HLO artifacts from the model to view in the profiler. The unit is in milliseconds.neuron_tensorboard_plugin_dir: The directory the neuron tensorboard plugin will file write to (NB: Assumes that the tensorboard logdir=”log/”)delete_working: If set to False turns off the deletion of temporary files (default True)
We move the model to the xla device inside the context manager. This is important,
as this allows the profiler to collect the operations and processes from the
neuronx-cc compiler artifacts. If the model is moved to the xla device outside of
the context manager, the profiling won’t work.
Note
The warnings about the XLA_IR_DEBUG and XLA_HLO_DEBUG
env vars not being set can be ignored for the most part. This warning
only comes into play when compiling the model for Neuron outside of the
profiler context manager.
After running this script, notice a ./logs directory has been
created. It contains the TensorBoard logs including the
profiler views.
Example used in this guide#
We will use the following code sample to describe in detail how to use the Neuron PyTorch profiling API.
Prerequisites#
Initial Trn1 setup for PyTorch (torch-neuronx) has been done
Environment#
#activate python virtual environment and install tensorboard_plugin_neuron
source ~/aws_neuron_venv_pytorch_p38/bin/activate
pip install tensorboard_plugin_neuronx

#create work directory for the Neuron Profiling tutorials
mkdir -p ~/neuron_profiling_tensorboard_examples
cd ~/neuron_profiling_tensorboard_examples
Setup#
Create a new working directory:
mkdir simple_demo
cd simple_demo
Save the following code as demo.py:
import os

import torch
import torch.nn as nn
import torch.nn.functional as F

# XLA imports
import torch_xla
import torch_xla.core.xla_model as xm
import torch_xla.debug.profiler as xp

import torch_neuronx
from torch_neuronx.experimental import profiler

os.environ["NEURON_CC_FLAGS"] = "--cache_dir=./compiler_cache"

# Global constants
EPOCHS = 10

# Declare 3-layer MLP Model
class MLP(nn.Module):
  def __init__(self, input_size = 10, output_size = 2, layers = [5, 5]):
      super(MLP, self).__init__()
      self.fc1 = nn.Linear(input_size, layers[0])
      self.fc2 = nn.Linear(layers[0], layers[1])
      self.fc3 = nn.Linear(layers[1], output_size)

  def forward(self, x):
      x = F.relu(self.fc1(x))
      x = F.relu(self.fc2(x))
      x = self.fc3(x)
      return F.log_softmax(x, dim=1)


def main():
    # Fix the random number generator seeds for reproducibility
    torch.manual_seed(0)

    # XLA: Specify XLA device (defaults to a NeuronCore on Trn1 instance)
    device = xm.xla_device()

    # Start the proflier context-manager
    with torch_neuronx.experimental.profiler.profile(
        port=9012,
        profile_type='trace',
        ms_duration=15000 ) as profiler:

        # IMPORTANT: the model has to be transferred to XLA within
        # the context manager, otherwise profiling won't work
        model = MLP().to(device)
        optimizer = torch.optim.SGD(model.parameters(), lr=0.01)
        loss_fn = torch.nn.NLLLoss()

        # start training loop
        print('----------Training ---------------')
        model.train()
        for epoch in range(EPOCHS):
            optimizer.zero_grad()
            train_x = torch.randn(1,10).to(device)
            train_label = torch.tensor([1]).to(device)

            #forward
            loss = loss_fn(model(train_x), train_label)

            #back
            loss.backward()
            optimizer.step()

            # XLA: collect ops and run them in XLA runtime
            xm.mark_step()

    print('----------End Training ---------------')

if __name__ == '__main__':
    main()
Then run it!
python demo.py
Viewing the Trace on TensorBoard#
To view the TensorBoard logs, run tensorboard --logdir=./logs
Note
Depending on TensorBoard version --load_fast=false might be an additional
parameter to add to view the trace.
Take note of the port (usually 6006) and enter localhost:<port> into
the local browser (assuming port forwarding is set up properly):

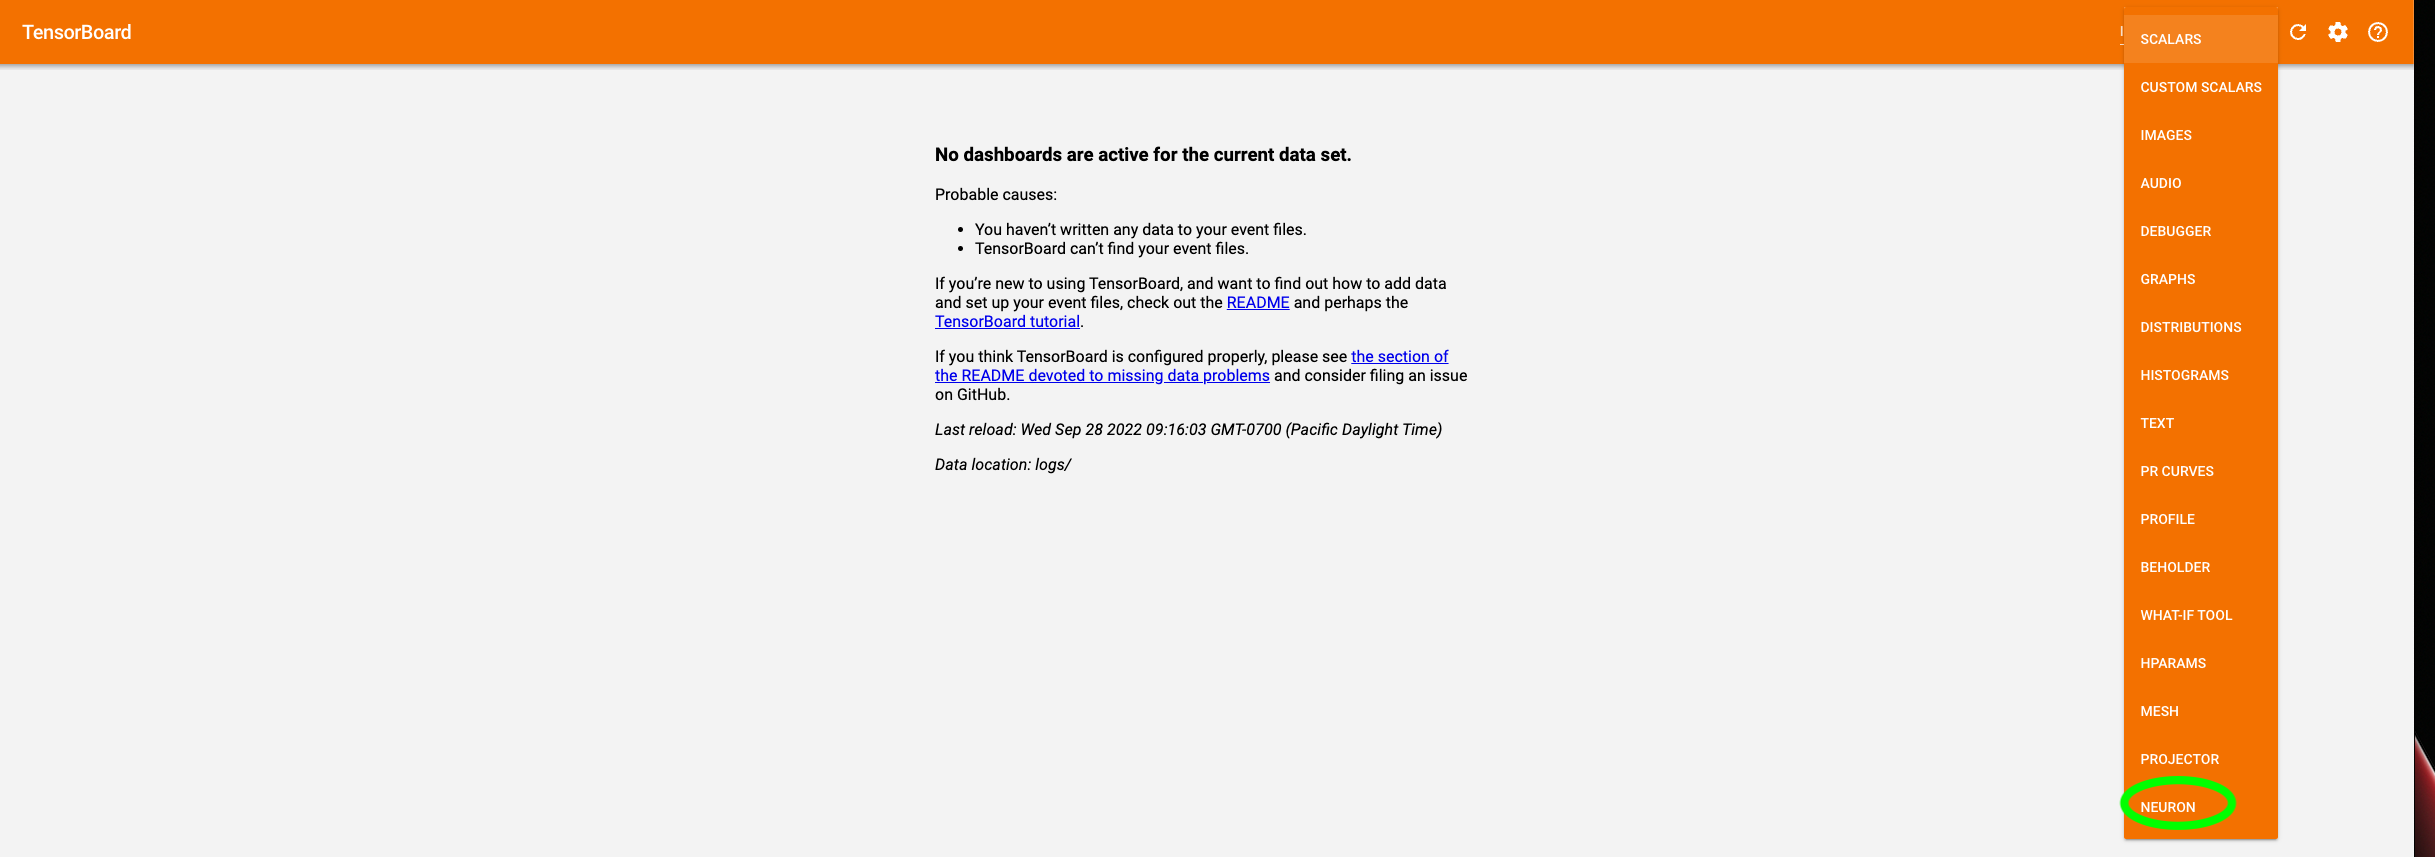
Once localhost:<port> is entered, verify that the
“NEURON” view is shown:

If “NEURON” isn’t shown on the top left hand side, select “NEURON” from the drop down on the top right hand side
On the Left Hand Side, there are two dropdown menus: Run & Tool.
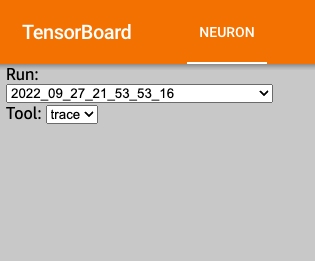
The Run dropdown would contain the Torch Runtime
Trace and Operator Level Trace views; however since we only ran the
“trace” (i.e Torch Runtime Trace Level), we’ll only see that log.
The Torch Runtime Trace views are simply dates in
year_month_day_hour_minute_second_millisecond format. The Tool
Dropdown only contains the “trace“ option.
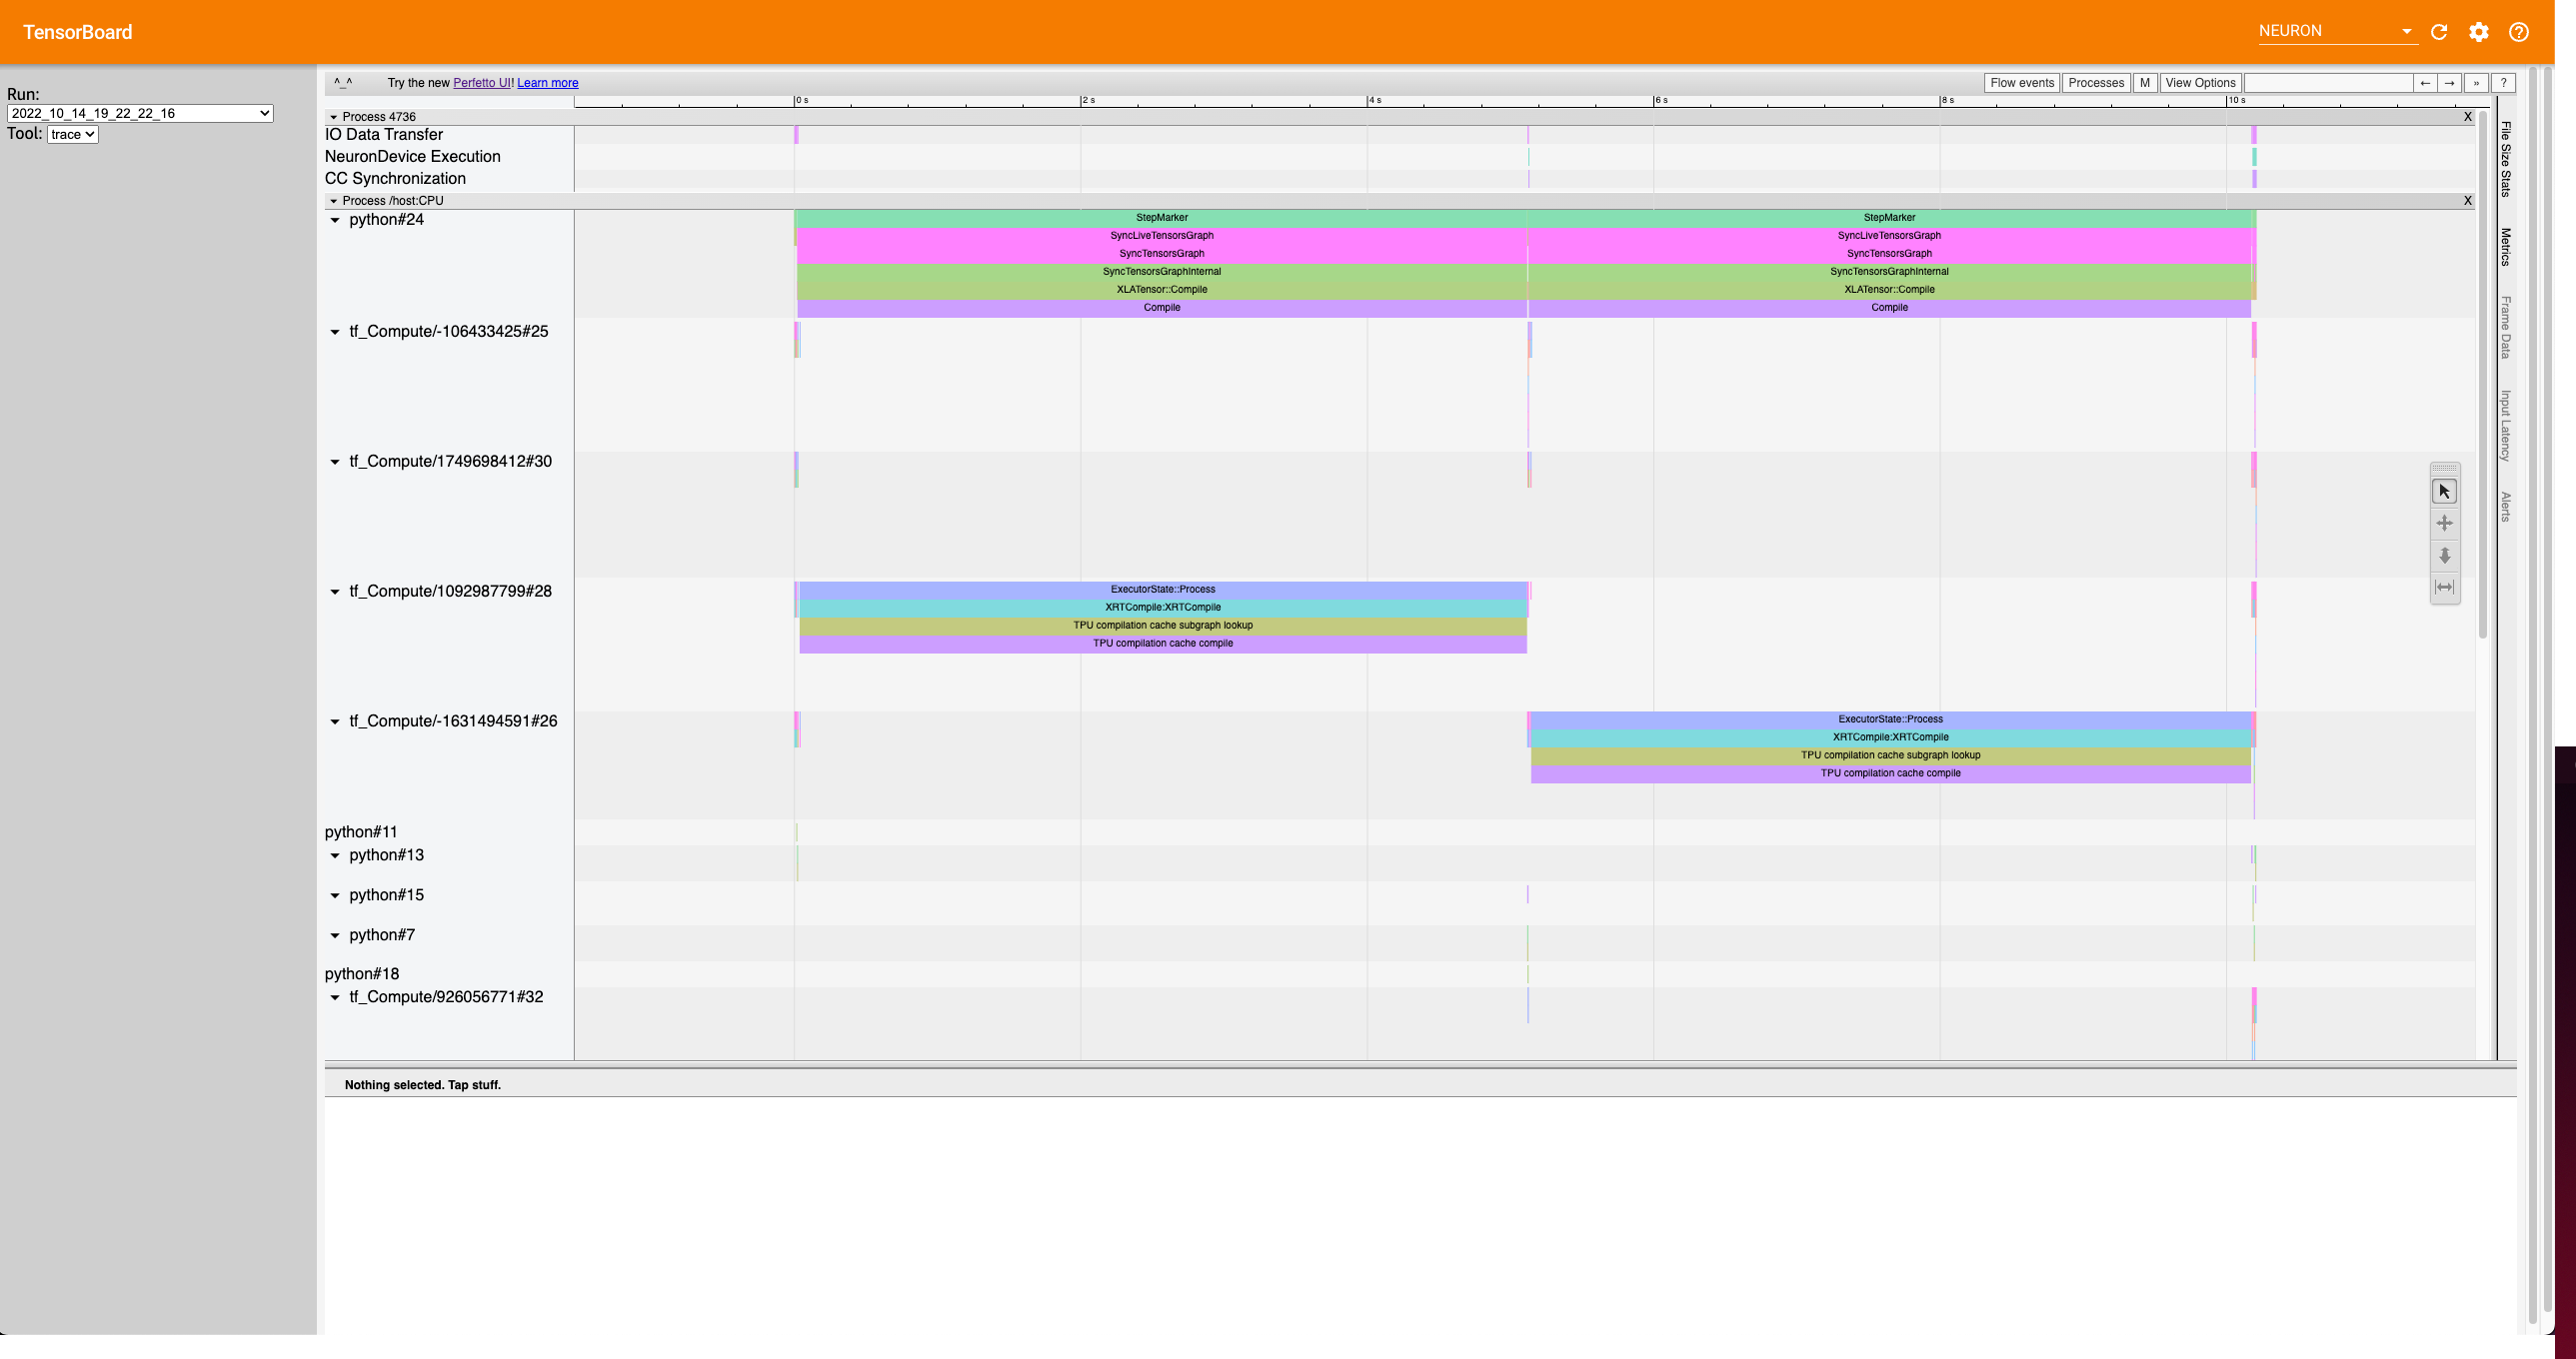
The trace view should look like this:
Let’s zoom into the following section of the trace:
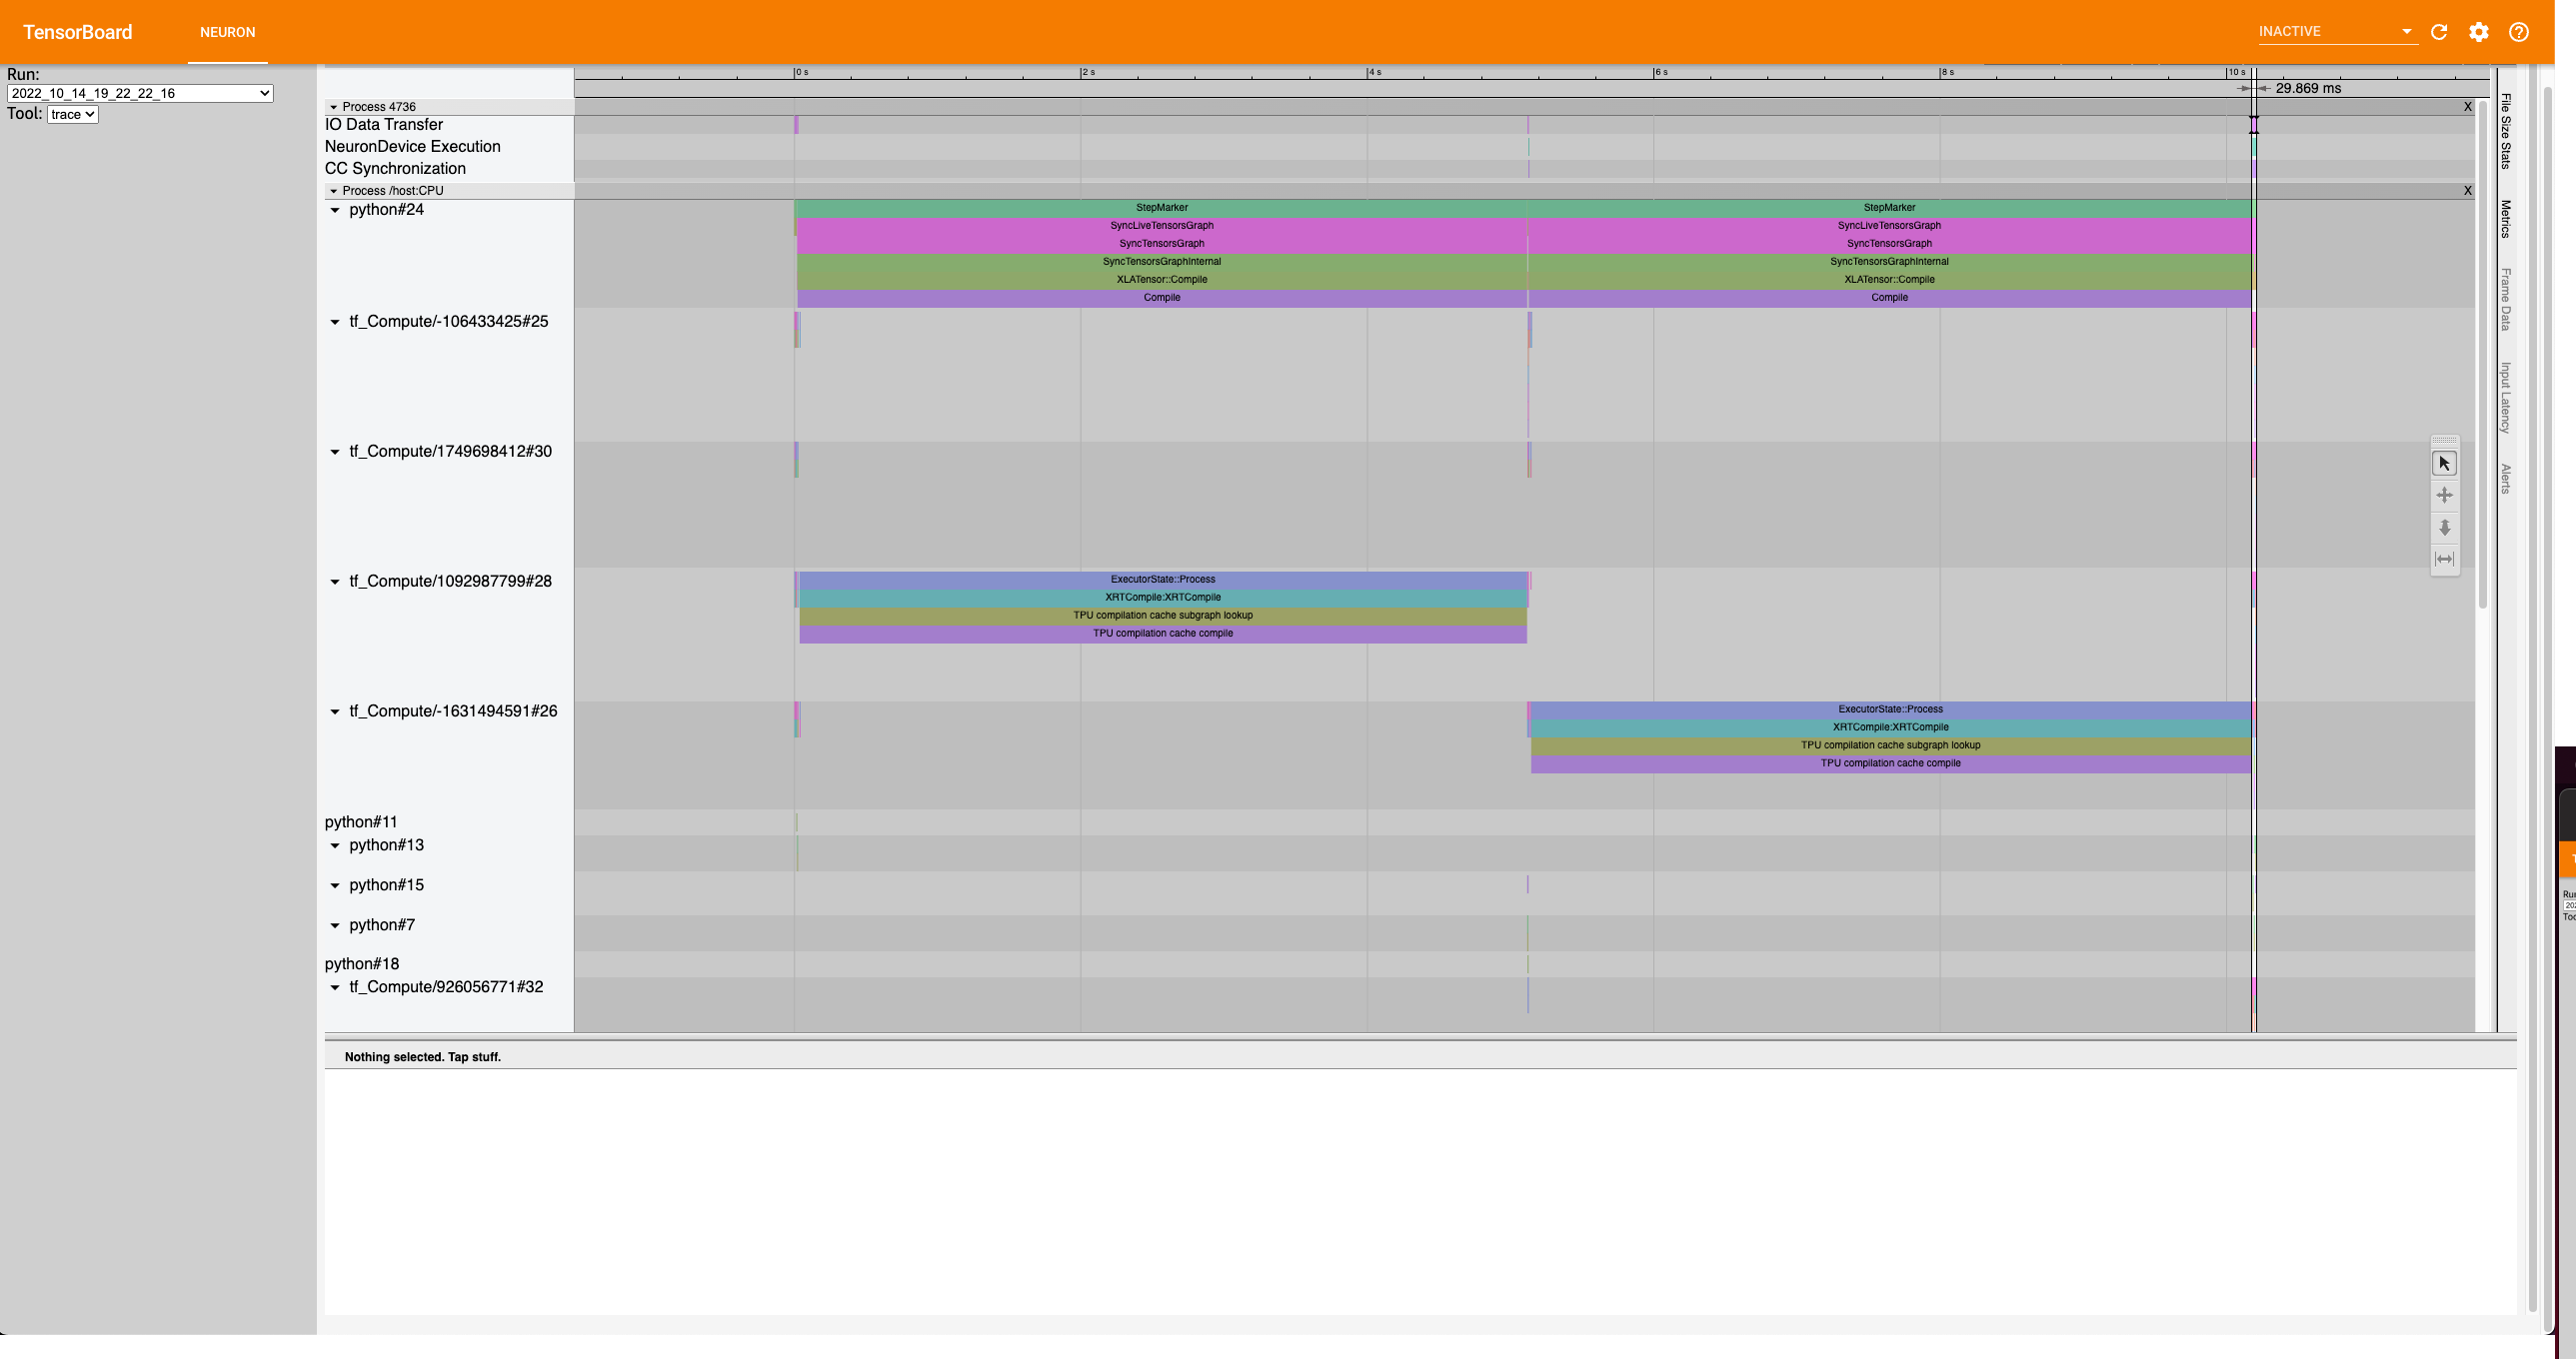
After zooming in the trace should look like this:
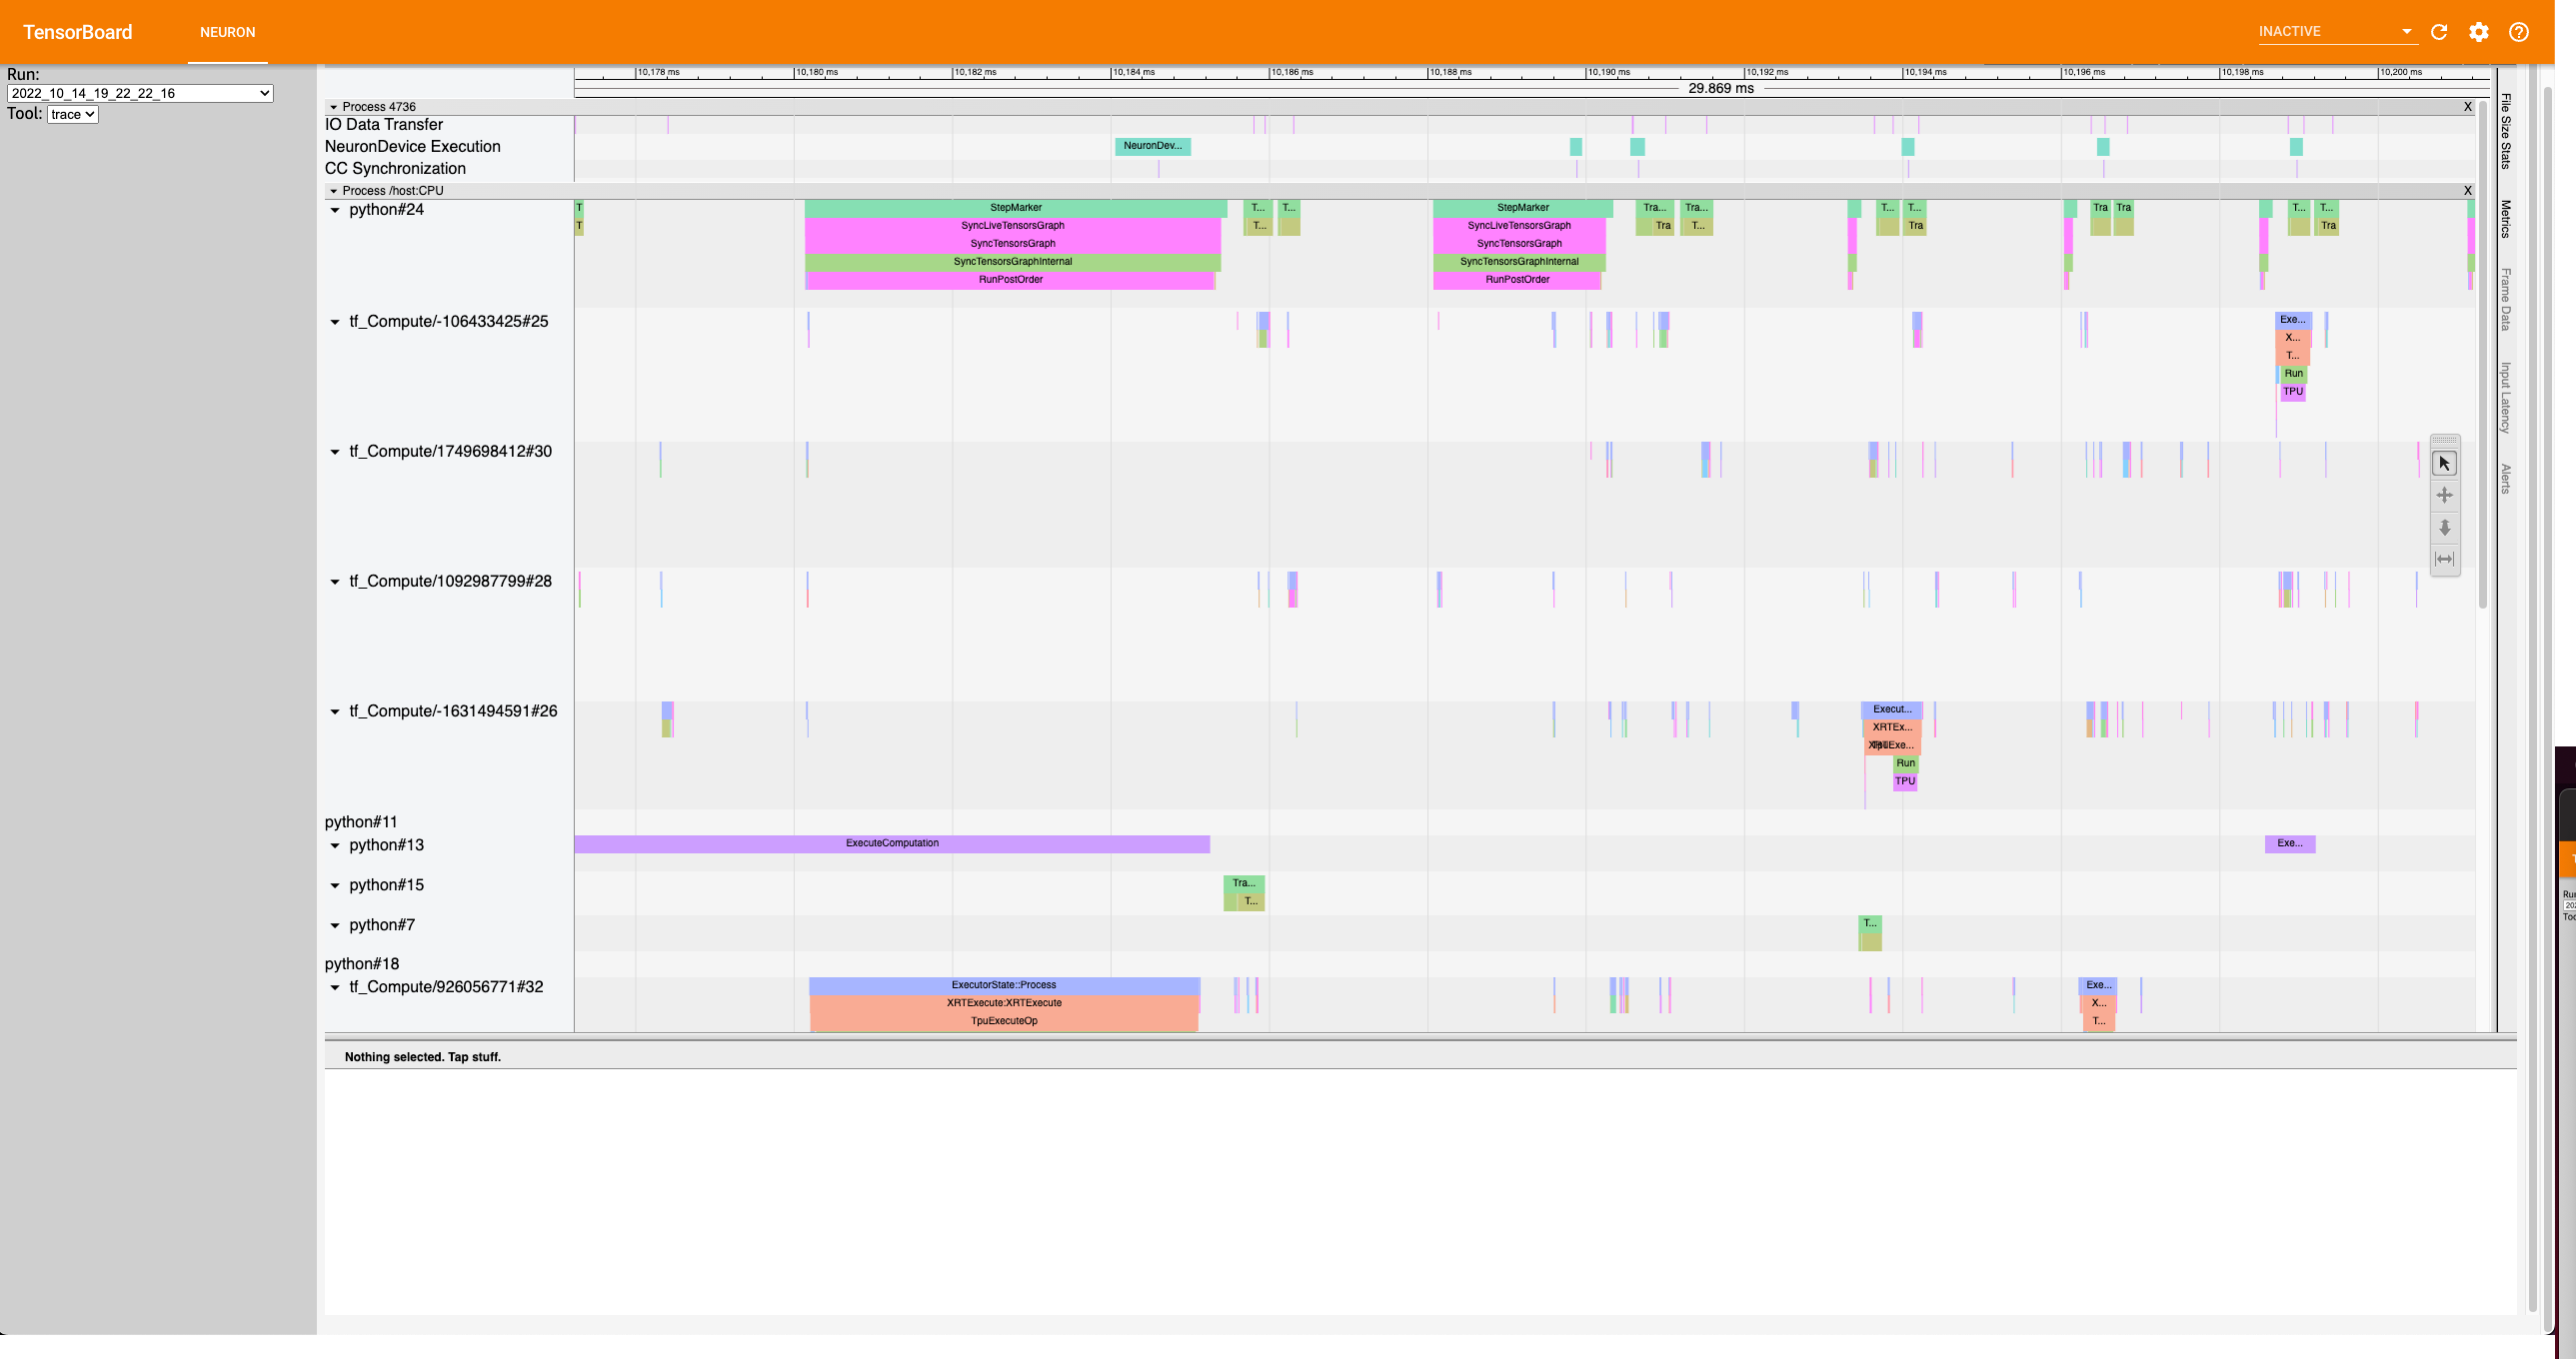
Notice on the top, there is a StepMarker process followed by NeuronDevice Execution
process. This correlates to the xm.mark_step() call which executes
the collected graph of our model on Neuron. For the Operator Level Trace
(“operator”), we’ll be profiling the model operators that occur on
Neuron. In other words, the profiler will zoom into the
NeuronDevice Execution process, if the user specifies
profile_type='trace'.
Using Named Blocks for the Trace#
What we’ve produced so far is the default behavior of the profiler, however
it would be more useful to profile specific blocks of our code to narrow down onto
performance bottlenecks. To do this, use xp.Trace context manager.
Replace the respective code in the training loop with the following:
...
optimizer.zero_grad()
train_x = torch.randn(1,10).to(device)
train_label = torch.tensor([1]).to(device)

with xp.Trace("model_build"):
    loss = loss_fn(model(train_x), train_label)
with xp.Trace("loss_backward"):
    loss.backward()
with xp.Trace("optimizer_step"):
    optimizer.step()

# XLA: collect ops and run them in XLA runtime
xm.mark_step()
...
Run the script, and follow the same TensorBoard steps. Afterwards, the trace should look like this:
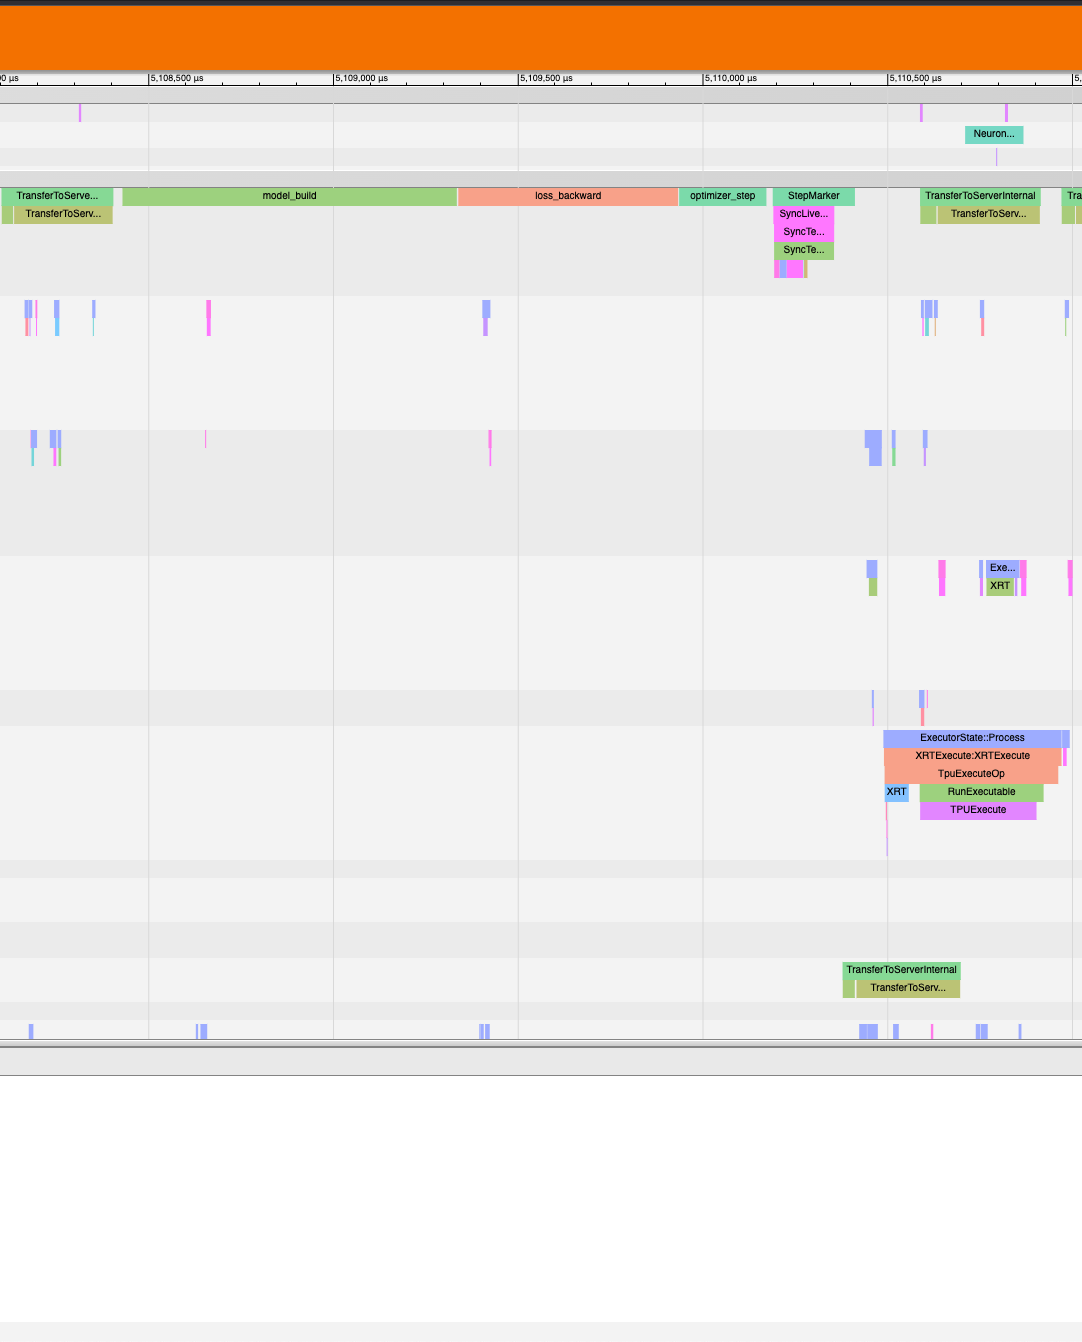
As seen, the model_build, loss_backward and optimizer_step
sections have been profiled.
Note
If you are running your training script in a docker container, to
view the tensorboard, you should launch the docker container using flag:
—network host eg. docker run —network host my_image:my_tag
This document is relevant for: Inf2, Trn1, Trn2