
This document is relevant for: Inf1, Inf2, Trn1, Trn2, Trn3
Capture profiles with Neuron Explorer#
Overview#
This guide covers every way to capture profiling data from your Neuron workloads. Once you have a profile, see the Getting Started Guide for how to launch Neuron Explorer, upload, and view results.
What you’ll learn:
How to capture system and device profiles using PyTorch, JAX, environment variables, or CLI
What output files to expect and how to verify a successful capture
How to filter captures to reduce memory usage and file size
Prerequisites#
A working model on a Trainium or Inferentia instance
The Neuron SDK installed (
torch-neuronxorjax-neuronx,aws-neuronx-tools)
What happens during profiling#
When you profile a workload, the Neuron Runtime instruments your execution and writes trace data to disk:
When each operation started and how long it took
Where it ran (CPU, Neuron Runtime, or NeuronCore hardware)
How much memory and bandwidth was used
Setup (all methods)#
Set these environment variables before compiling to get descriptive layer names and source mapping in your profiles:
export XLA_IR_DEBUG=1
export XLA_HLO_DEBUG=1
For NKI kernel developers, also set:
export NEURON_FRAMEWORK_DEBUG=1
These enable kernel source code tracking and richer op names in the timeline. They are recommended for all capture methods below.
Choose your capture method#
Choose the method that matches your framework and use case:
Method |
Best for |
|---|---|
Native PyTorch Profiling (private beta) |
PyTorch models |
JAX Profiling |
JAX models |
Environment Variables |
Any framework, containerized workloads, EKS |
CLI ( |
Quick system profiles without code changes |
PyTorch profiling#
Note
Native PyTorch profiling is in private beta. You must be enrolled in Native PyTorch private beta 3. Contact the Neuron Product team or see Native PyTorch for AWS Trainium to sign up.
PyTorch profiling uses the standard torch.profiler.profile API extended with a NeuronConfig object that controls Neuron-specific data collection. For related Explorer viewers, see System Trace Viewer.
How it works#
Pass two activities to torch.profiler.profile:
ProfilerActivity.CPU— framework-level CPU operations (PyTorch dispatch, Python stacks)ProfilerActivity.PrivateUse1— Neuron runtime and device activity (controlled by NeuronConfig)
Both are required for a complete CPU-to-device view.
NeuronConfig profile modes#
Each mode controls what gets collected and what output files are produced:
Mode |
What it captures |
Output files |
|---|---|---|
|
Hardware-level NeuronCore instructions |
|
|
Neuron Runtime system-level trace |
|
|
Host CPU utilization |
|
|
Host memory usage |
|
Warning
ProfileMode.DEVICE reserves approximately 5 GB of HBM on Trn2 for storing hardware notifications. Omit it if you don’t need instruction-level device traces.
NeuronConfig parameters#
Parameter |
Description |
|---|---|
|
List of |
|
Maximum number of trace events per NeuronCore. |
|
Comma-separated NeuronCore indices or ranges to capture (for example, |
|
Directory for Neuron Runtime trace output files. |
|
Path to the NEFF cache directory. When set, cached NEFFs are copied into the profile artifact directory on stop instead of creating additional copies at load time. |
|
When |
Supported torch.profiler.profile arguments#
The following standard torch.profiler.profile arguments are supported when used with
NeuronConfig:
scheduleon_trace_readyrecord_shapeswith_flopsprofile_memorywith_stack
Basic example#
import torch
from torch.profiler import profile, ProfilerActivity
from torch_neuronx.profiling import NeuronConfig, ProfileMode, NeuronProfiler

# Configure Neuron profiling
neuron_config = NeuronConfig(
    modes=[ProfileMode.DEVICE, ProfileMode.RUNTIME],
    profile_output_dir="./profile_output",
)

# NeuronProfiler.export_trace() places the framework trace
# in the same directory as Neuron system traces
exporter = NeuronProfiler(neuron_config)

# IMPORTANT: Warm up first (3+ iterations)
with torch.no_grad():
    for _ in range(3):
        model(x)

# Profile your workload
with profile(
    activities=[ProfilerActivity.CPU, ProfilerActivity.PrivateUse1],
    experimental_config=neuron_config,
    on_trace_ready=exporter.export_trace,
) as prof:
    with torch.no_grad():
        model(x)
        torch.neuron.synchronize()  # Ensures device finishes before export
Why torch.neuron.synchronize()? Neuron is asynchronous, so the forward call queues work and returns immediately. Without sync, the profiler may export before the device finishes executing, producing an incomplete trace.
Multi-rank example with host collective communication#
The following demonstrates profiling a distributed workload that overlaps compute and collective communication:
import os
import torch
import torch.distributed as dist
import torch_neuronx
from torch_neuronx.profiling import NeuronConfig, ProfileMode, NeuronProfiler
from torch.profiler import ProfilerActivity, profile, record_function

def main():
    dist.init_process_group(backend="neuron")
    rank = dist.get_rank()
    device = torch.device("neuron")
    cc_stream = torch_neuronx.Stream(device)

    exp_config = NeuronConfig(
        modes=[ProfileMode.DEVICE, ProfileMode.RUNTIME,
               ProfileMode.CPU_UTIL, ProfileMode.HOST_MEMORY],
        profile_output_dir="./profile_host_cc",
        max_events_per_nc=100000,
        capture_enabled_for_nc="0,1",
    )
    exporter = NeuronProfiler(exp_config)

    with (
        profile(
            activities=[ProfilerActivity.CPU, ProfilerActivity.PrivateUse1],
            experimental_config=exp_config,
            with_stack=True,
            on_trace_ready=exporter.export_trace,
        ) as prof,
        record_function("model_inference"),
    ):
        a = torch.randn(4096, 4096, device=device, dtype=torch.float32)
        b = torch.randn(4096, 4096, device=device, dtype=torch.float32)
        t = torch.randn(4 * 1024 * 1024, device=device, dtype=torch.float32)

        # Warmup
        for _ in range(3):
            torch.matmul(a, b)
            with torch_neuronx.stream(cc_stream):
                dist.all_reduce(t)
        torch_neuronx.synchronize()
        dist.barrier()

        # Profiled iterations
        for _ in range(10):
            torch.matmul(a, b)
            with torch_neuronx.stream(cc_stream):
                dist.all_reduce(t)
        torch_neuronx.synchronize()
        dist.barrier()

    dist.destroy_process_group()

if __name__ == "__main__":
    main()
Launch command (Trn2, 4 ranks):
TORCH_NEURONX_ENABLE_HOST_CC=1 \
TORCH_NEURONX_ENABLE_ASYNC_NRT=1 \
NEURON_RT_NUM_CORES=4 \
NEURON_RT_VIRTUAL_CORE_SIZE=2 \
torchrun \
    --nproc_per_node 4 \
    --rdzv_backend c10d \
    --rdzv_endpoint localhost:29500 \
    --local-ranks-filter 0 \
    --tee 3 \
    your_script.py
Ensuring NEFFs are in your output directory#
If you don’t see NEFF files in your profile output, they may be in a separate compiler cache.
Set neff_cache_dir in NeuronConfig (or the TORCH_NEURONX_NEFF_CACHE_DIR environment
variable) before running your profiling script to automatically include all relevant NEFFs
in the profiler output directory. This also helps correlate nc_exec_running events to the
relevant NEFF.
os.environ["TORCH_NEURONX_NEFF_CACHE_DIR"] = "./profile_output"
Alternatively, find and copy them manually:
find /tmp/neff_cache -name "*.neff" -printf '%T@ %p\n' | sort -rn | head -5
cp /tmp/neff_cache/<path>/*.neff ./profile_output/<instance_dir>/<session_dir>/
Expected output#
./profile_output/
├── <instance-id>_pid_<pid_0>/
│   └── <timestamp>/
│       ├── cpu_util.pb                 # CPU utilization
│       ├── host_mem.pb                 # Host memory
│       ├── neff_<hash_0>_vnc_0.neff
│       ├── neff_<hash_1>_vnc_0.neff
│       ├── ntrace.pb                   # System profile trace
│       ├── profile_nc_0_session_0.ntff # Device trace (NeuronCore 0)
│       ├── trace.json                  # Framework trace
│       └── trace_info.pb               # System profile metadata
└── <instance-id>_pid_<pid_1>/
    └── ...                             # Same structure per rank
What each file contains:
File |
Description |
|---|---|
|
Neuron Executable File Format — the compiled model graph. Required for device profile analysis. |
|
Neuron Trace File Format — raw device execution traces per NeuronCore. |
|
System-level runtime events (API calls, model loads, executions). |
|
Metadata about the system trace capture session. |
|
Sampled CPU utilization data per core. |
|
Sampled host memory usage over time. |
|
Framework-level trace (PyTorch profiler output) showing CPU operations and call stacks. |
Verifying your capture was successful#
After profiling, check that your output directory is not empty and contains the expected files:
ls -la ./profile_output/
Common signs of a failed capture:
Empty output directory — profiling wasn’t enabled or the workload didn’t execute on Neuron.
NTFF files are 0 bytes — device profiling was enabled but no execution was captured (likely a warm-up issue).
No .neff files — see Ensuring NEFFs are in your output directory above.
Only .pb files, no .ntff — device profiling wasn’t enabled; you captured a system profile only (may be intentional).
For troubleshooting help, see Troubleshooting & FAQs.
torch.compile vs eager mode profiling#
Neuron Explorer supports profiling workloads compiled with both torch.compile
and PyTorch eager mode. Eager mode typically produces more NEFFs than
torch.compile. See the next section on how to correlate hardware execution
with the correct NEFF when multiple NEFFs are present.
Correlating hardware execution with the NEFF#
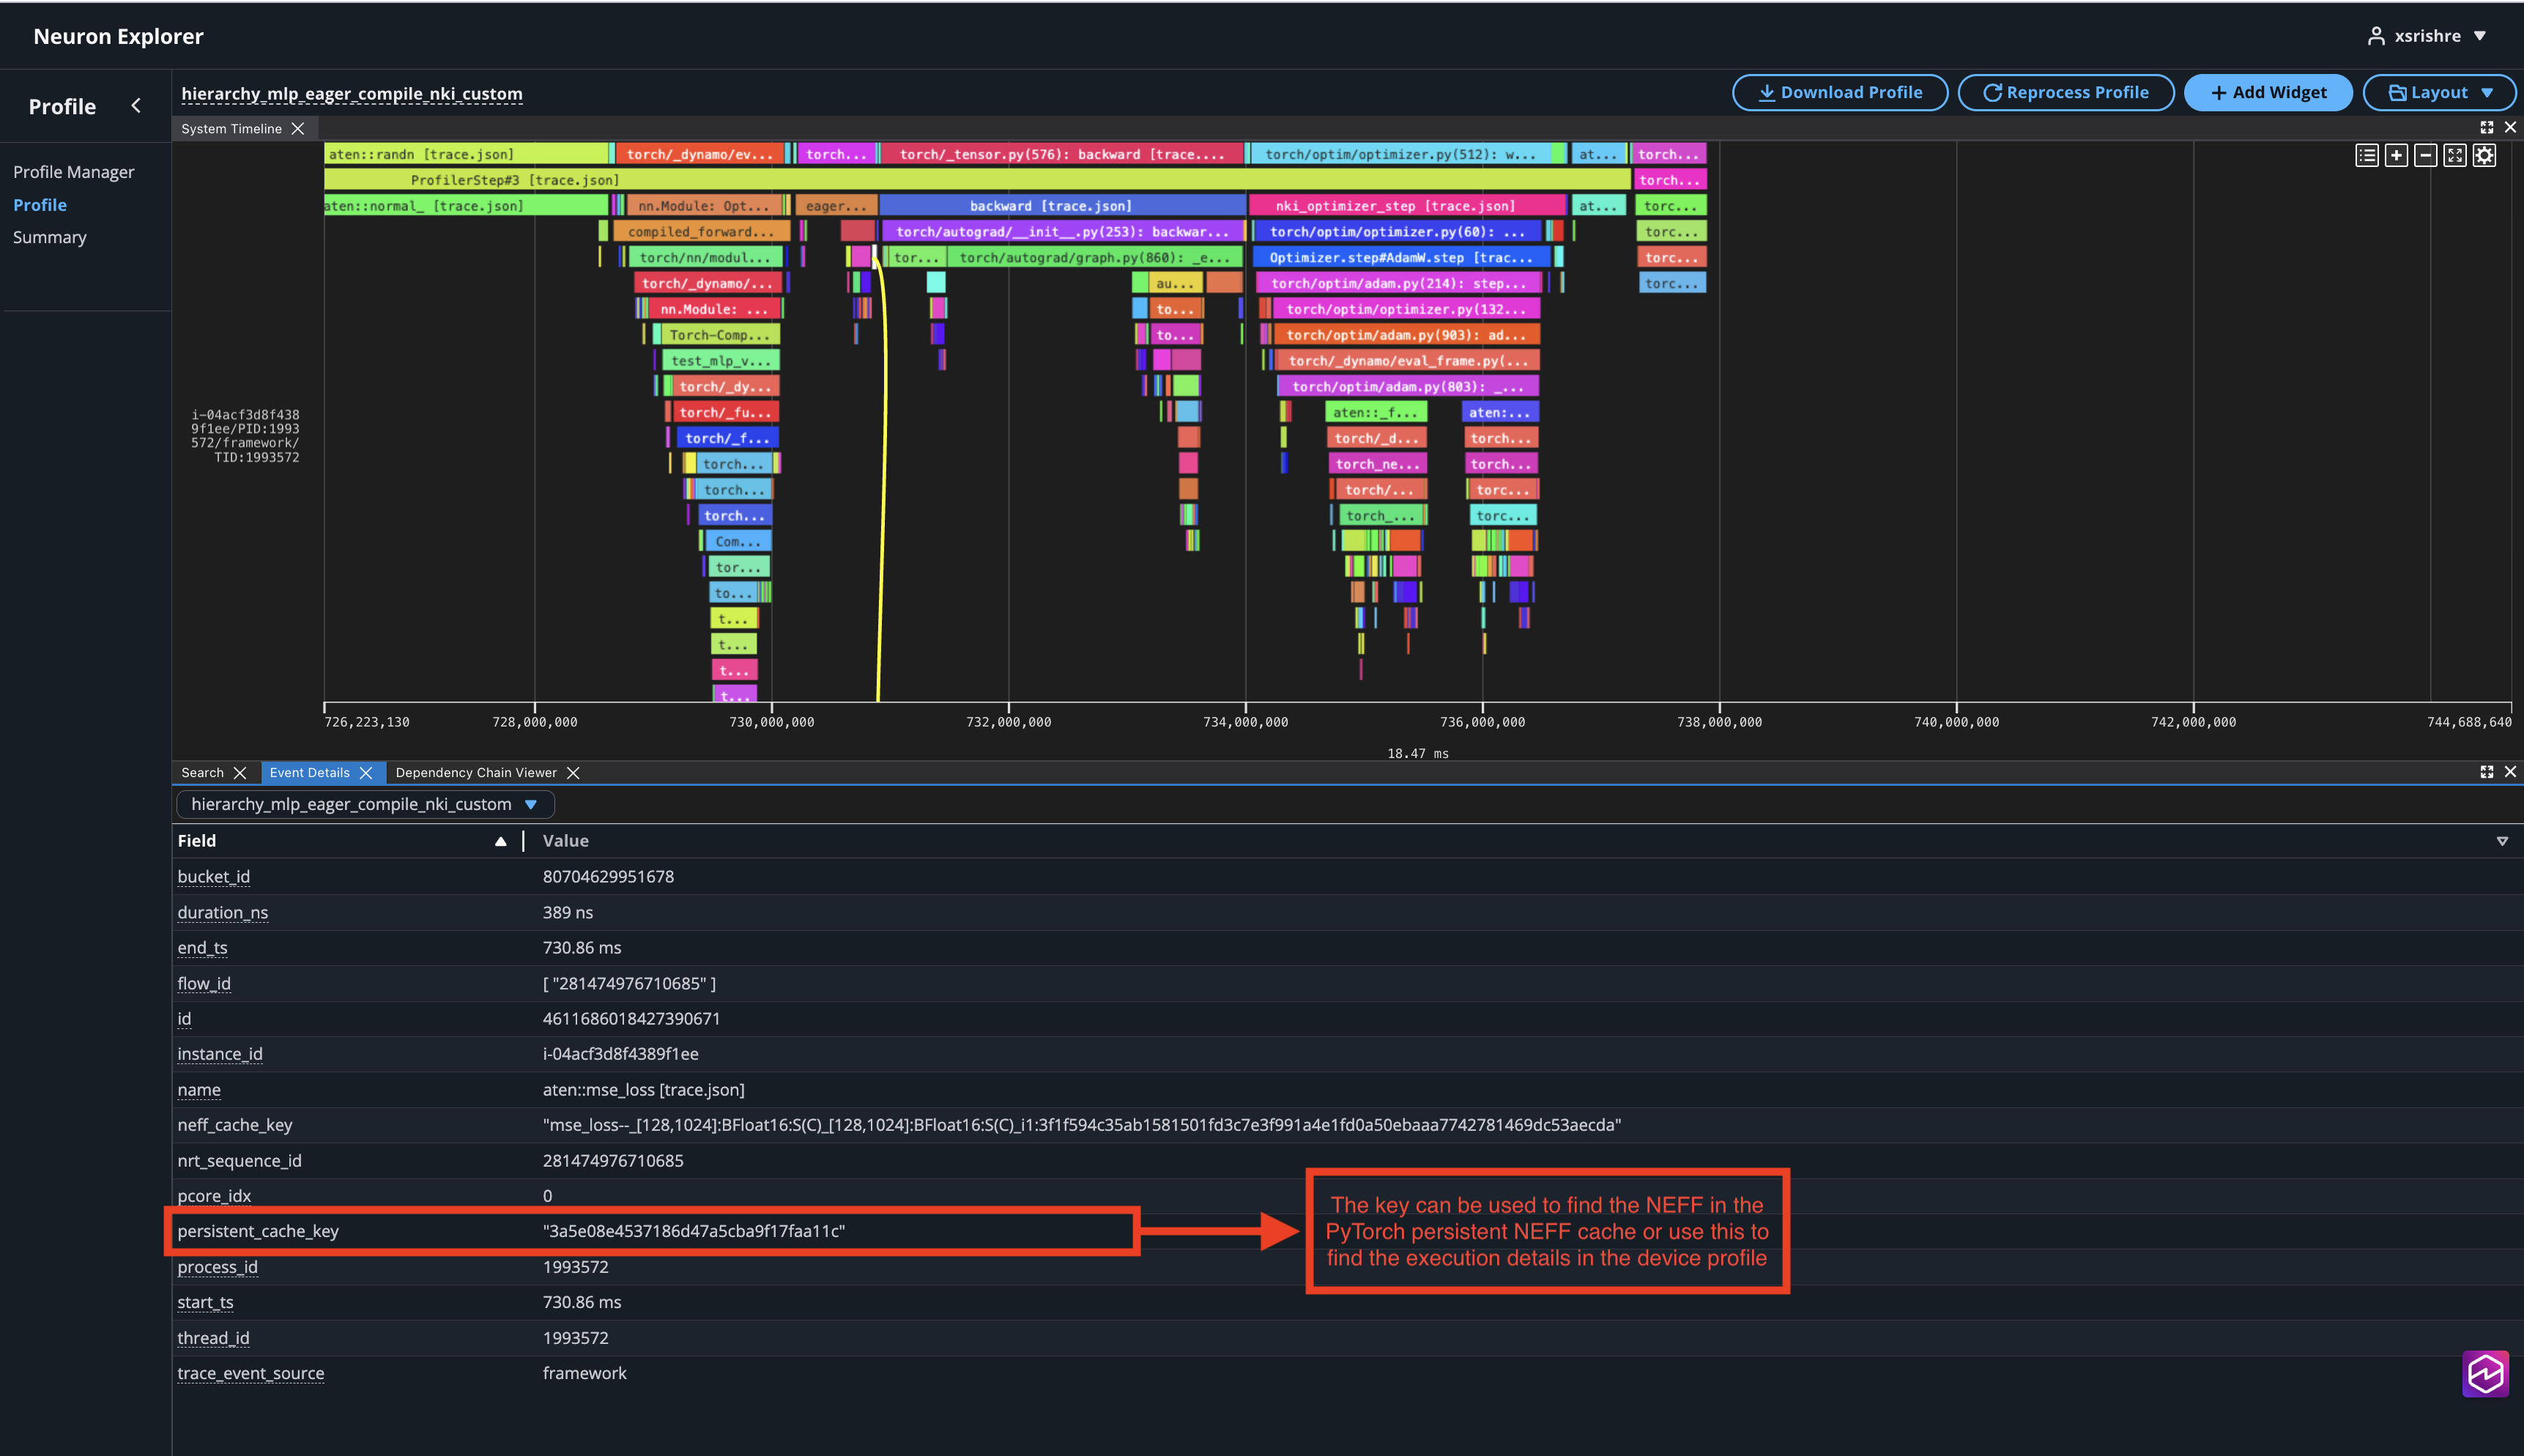
In the case of PyTorch eager profiling, you may come across many neffs. To correlate the hardware execution to the NEFF:
Use the
neff_cache_dirfrom NeuronConfig parameters.In the profile find the events that led to a hardware execution by clicking on a
nc_exec_runningevent in the hardware track of the system profile (has a/neuron_hw/in the track name). Find the full hierarchy of this event by clicking through the associated events in the dependency chain viewer.
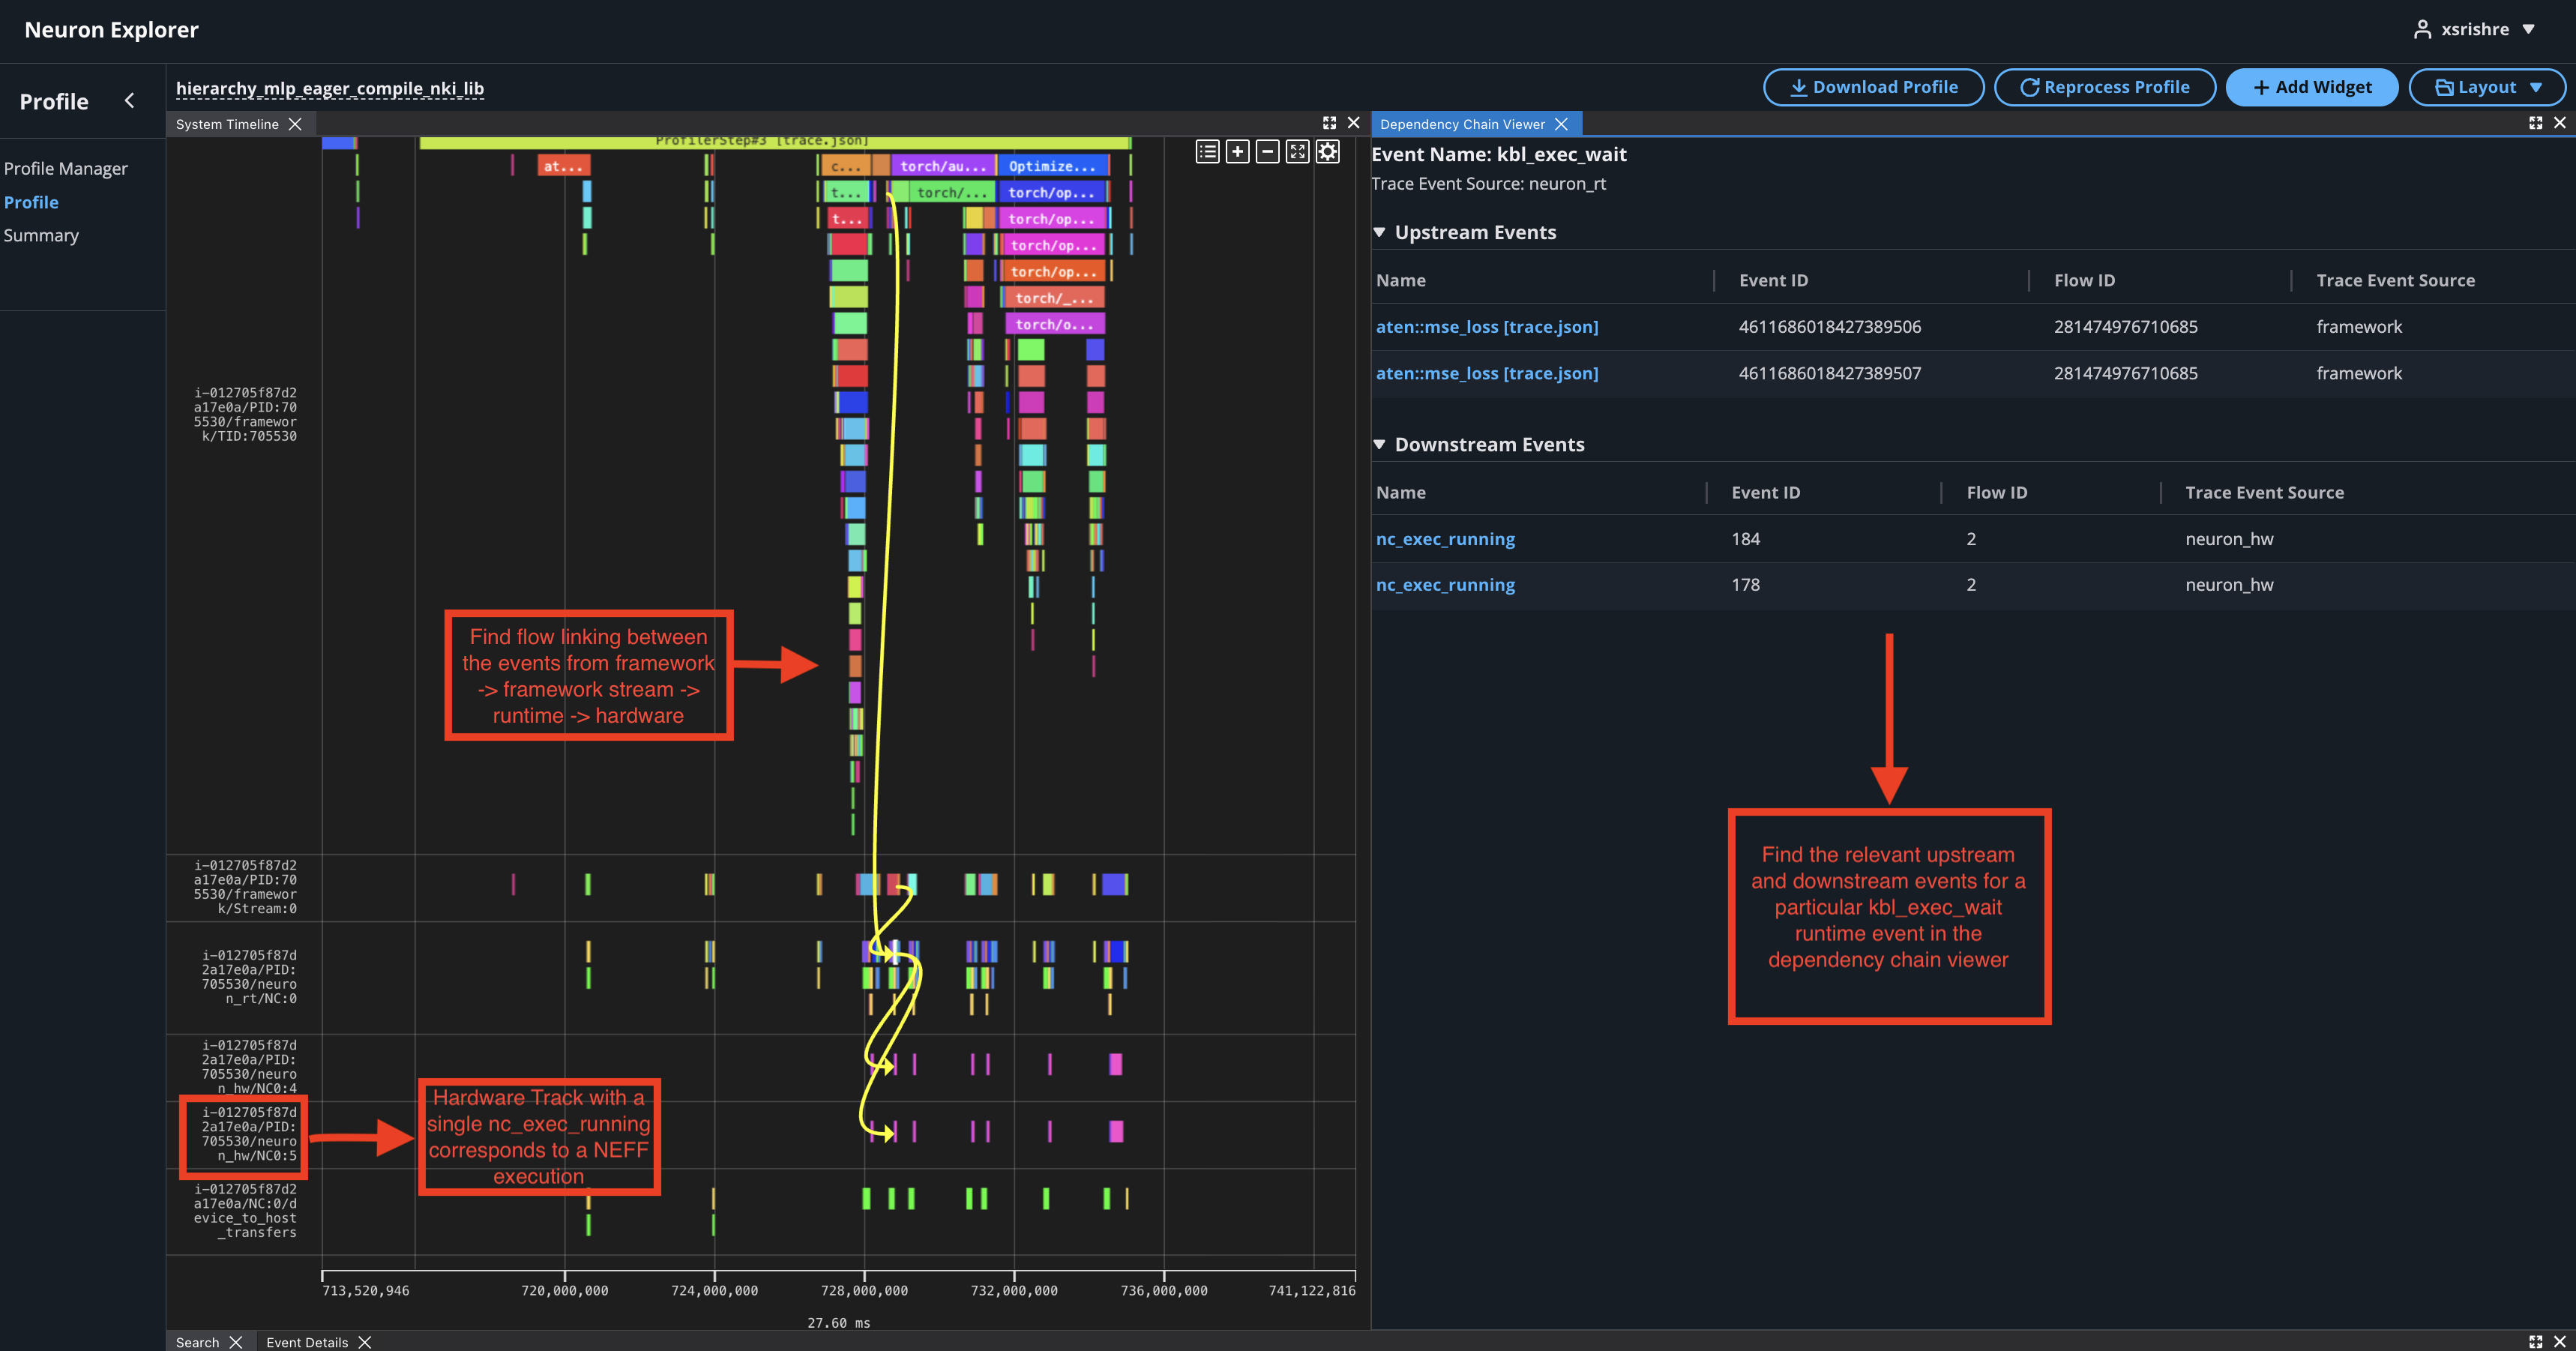
Find the persistent NEFF cache name in the event details of the framework stream event linked to the hardware execution.
JAX profiling#
JAX profiling uses the context-managed jax.profiler.trace API. Set two environment
variables to enable device profile capture:
import os
import jax

os.environ["NEURON_RT_INSPECT_DEVICE_PROFILE"] = "1"
os.environ["NEURON_RT_INSPECT_OUTPUT_DIR"] = "./output"

with jax.profiler.trace(os.environ["NEURON_RT_INSPECT_OUTPUT_DIR"]):
    # Your JAX workload here
    out = my_jax_function(inputs)
Full JAX example (distributed matmul with AllGather)#
from functools import partial
import os
import jax
import jax.numpy as jnp
from jax.sharding import Mesh, NamedSharding, PartitionSpec as P
from jax.experimental.shard_map import shard_map
from time import sleep

os.environ["NEURON_RT_INSPECT_DEVICE_PROFILE"] = "1"
os.environ["NEURON_RT_INSPECT_OUTPUT_DIR"] = "./output"

jax.config.update("jax_default_prng_impl", "rbg")
mesh = Mesh(jax.devices(), ('i',))

def device_put(x, pspec):
    return jax.device_put(x, NamedSharding(mesh, pspec))

lhs_spec = P('i', None)
lhs = device_put(jax.random.normal(jax.random.key(0), (128, 128)), lhs_spec)
rhs_spec = P('i', None)
rhs = device_put(jax.random.normal(jax.random.key(1), (128, 16)), rhs_spec)

@jax.jit
@partial(shard_map, mesh=mesh, in_specs=(lhs_spec, rhs_spec), out_specs=rhs_spec)
def matmul_allgather(lhs_block, rhs_block):
    rhs = jax.lax.all_gather(rhs_block, 'i', tiled=True)
    return lhs_block @ rhs

with jax.profiler.trace(os.environ["NEURON_RT_INSPECT_OUTPUT_DIR"]):
    out = matmul_allgather(lhs, rhs)
    for i in range(10):
        with jax.profiler.TraceAnnotation("my_label" + str(i)):
            out = matmul_allgather(lhs, rhs)
        sleep(0.001)

expected = lhs @ rhs
with jax.default_device(jax.devices('cpu')[0]):
    equal = jnp.allclose(jax.device_get(out), jax.device_get(expected), atol=1e-3, rtol=1e-3)
print("Tensors are the same") if equal else print("Tensors are different")
Key differences from PyTorch profiling#
JAX uses
jax.profiler.tracecontext manager instead oftorch.profiler.profileDevice profiling is controlled via environment variables (
NEURON_RT_INSPECT_DEVICE_PROFILE), not a NeuronConfig objectjax.profiler.TraceAnnotationlets you label regions in the timeline (similar torecord_functionin PyTorch)
Important
Do NOT set NEURON_RT_INSPECT_ENABLE=1 when using jax.profiler. These two mechanisms conflict: use one or the other.
Environment variable profiling (framework-agnostic)#
Use environment variables when you cannot modify application code in containerized workloads, EKS deployments, or any executable that calls the Neuron Runtime.
Note
When capturing with environment variables, profiling is enabled for the entire lifetime of the application. For finer-grained control over specific code regions, use the PyTorch or JAX APIs instead.
Core variables#
Variable |
Description |
Default |
|---|---|---|
|
Set to |
Enables system profiling, disables device profiling |
|
Directory for profile output |
|
Profile type selection#
When NEURON_RT_INSPECT_ENABLE=1:
Variable |
Profile type |
Description |
Default |
Valid values |
|---|---|---|---|---|
|
System-level |
Runtime events and operations |
|
|
|
Device-level |
NeuronCore hardware metrics |
|
|
Note
These variables have no effect unless NEURON_RT_INSPECT_ENABLE=1.
Advanced configuration#
Variable |
Description |
Default |
|---|---|---|
|
Maximum trace events per NeuronCore before oldest events are overwritten |
1,000,000 |
Increasing the event limit consumes more host memory.
Basic usage#
export NEURON_RT_INSPECT_ENABLE=1
export NEURON_RT_INSPECT_DEVICE_PROFILE=1
export NEURON_RT_INSPECT_OUTPUT_DIR=./output
python train.py
EKS deployment#
Update your deployment YAML to include profiling environment variables. For distributed
workloads, NEURON_RT_INSPECT_OUTPUT_DIR must point to a shared volume accessible by
all workers.
apiVersion: v1
kind: Pod
metadata:
  name: trn1-mlp
spec:
  restartPolicy: Never
  schedulerName: default-scheduler
  nodeSelector:
    beta.kubernetes.io/instance-type: trn1.32xlarge
  containers:
    - name: trn1-mlp
      env:
        - name: NEURON_RT_INSPECT_ENABLE
          value: "1"
        - name: NEURON_RT_INSPECT_OUTPUT_DIR
          value: "/shared/output"
      command: ['torchrun']
      args:
        - '--nnodes=1'
        - '--nproc_per_node=32'
        - 'train_torchrun.py'
      image: ${ACCOUNT_ID}.dkr.ecr.${REGION}.amazonaws.com/${REPO}:mlp
      imagePullPolicy: IfNotPresent
      resources:
        limits:
          aws.amazon.com/neuron: 16
CLI profiling with neuron-explorer inspect#
The neuron-explorer inspect command wraps your workload and captures a system profile
without any code changes. It provides the same functionality as environment variables but
with argument validation and a --help command.
neuron-explorer inspect -o ./inspect-output nccom-test allg -b 512kb -e 512kb -r 32 -n 10 -d fp32 -w 1 -f 512
Note
If using a trn1.2xlarge instance, change -r 32 to -r 2 to use fewer NeuronCores.
CLI reference#
Usage:
  neuron-explorer [OPTIONS] inspect [inspect-OPTIONS] [userscript...]

Application Options:
  -v, --version               Show version and exit

Help Options:
  -h, --help                  Show this help message

[inspect command options]
      -o, --output-dir=       Output directory for inspection results (default: .)
      -n, --num-trace-events= Maximum number of trace events before old ones are dropped

[inspect command arguments]
  userscript:                 Command that launches a Neuron workload
neuron-explorer inspect output example#
The command traces a Neuron workload and saves output to the specified directory. You’ll see NEFF files, device profiles (NTFF) for all NeuronCores that executed that NEFF, and system profile data:
ubuntu@ip-172-31-63-210:~$ tree inspect-output-nccom-test
inspect-output-nccom-test
├── i-012590440bb9fd263_pid_98399
│   ├── 14382885777943380728_instid_0_vnc_0.ntff
│   ├── 14382885777943380728_instid_0_vnc_1.ntff
│   ├── 14382885777943380728_instid_0_vnc_10.ntff
│   ├── 14382885777943380728_instid_0_vnc_11.ntff
...
│   ├── 14382885777943380728_instid_0_vnc_8.ntff
│   ├── 14382885777943380728_instid_0_vnc_9.ntff
│   ├── cpu_util.pb
│   ├── host_mem.pb
│   ├── neff_14382885777943380728.neff
│   ├── ntrace.pb
│   └── trace_info.pb
└──

2 directories, 74 files
To view a summary of the captured profile data:
neuron-explorer view -d inspect-output-nccom-test --output-format summary-text
Filtering#
You can filter at two points: capture time (before data is written) or processing time (when viewing). Capture-time filtering reduces memory and file size but discards data permanently.
When to use capture-time vs processing-time filtering#
Situation |
Use |
|---|---|
You know exactly which NeuronCores to profile (for example, only core 0) |
Capture-time filtering saves host memory |
You’re profiling a large distributed workload and running out of host memory |
Capture-time filtering reduces buffer allocation |
You want to explore the same trace from different angles |
Processing-time filtering preserves all data |
You’re not sure what you need yet |
Don’t filter at capture time — filter later when viewing |
Rule of thumb: If in doubt, capture everything. You can always filter when viewing. You can never recover data you didn’t capture.
Capture-time filtering#
Reduces memory usage by only collecting specific events. Useful for large distributed workloads or when you know exactly which cores to profile.
NeuronCore filtering:
Using environment variables:
# Only NeuronCore 0
export NEURON_RT_INSPECT_EVENT_FILTER_NC=0

# NeuronCores 0, 2, and 4
export NEURON_RT_INSPECT_EVENT_FILTER_NC=0,2,4

# Range: NeuronCores 0 through 3
export NEURON_RT_INSPECT_EVENT_FILTER_NC=0-3

# Reset to all cores
unset NEURON_RT_INSPECT_EVENT_FILTER_NC
Using C API:
#include <nrt/nrt_sys_trace.h>

nrt_sys_trace_config_t *config;
nrt_sys_trace_config_allocate(&config);
nrt_sys_trace_config_set_defaults(config);

// Disable all cores, then enable specific ones
int num_cores = 128;
for (int i = 0; i < num_cores; i++) {
    nrt_sys_trace_config_set_capture_enabled_for_nc(config, i, false);
}
nrt_sys_trace_config_set_capture_enabled_for_nc(config, 0, true);
nrt_sys_trace_config_set_capture_enabled_for_nc(config, 2, true);

nrt_sys_trace_start(config);
// ... your workload ...
nrt_sys_trace_stop();
nrt_sys_trace_config_free(config);
Event type filtering
Using environment variables:
# Specific event types
export NEURON_RT_INSPECT_EVENT_FILTER_TYPE=model_load,nrt_execute,runtime_execute

# All hardware events
export NEURON_RT_INSPECT_EVENT_FILTER_TYPE=hardware

# All software events
export NEURON_RT_INSPECT_EVENT_FILTER_TYPE=software

# Hardware events EXCEPT cc_exec
export NEURON_RT_INSPECT_EVENT_FILTER_TYPE=hardware,^cc_exec

# Software events EXCEPT model_load
export NEURON_RT_INSPECT_EVENT_FILTER_TYPE=software,^model_load

# Mix categories and specific events
export NEURON_RT_INSPECT_EVENT_FILTER_TYPE=hardware,tensor_read,tensor_write

# Reset to all event types
unset NEURON_RT_INSPECT_EVENT_FILTER_TYPE
Event groups: hardware: nc_exec_running, cc_running, cc_exec_barrier, numerical_err, nrt_model_switch, timestamp_sync_point, hw_notify. software: all other events.
Using C API:
#include <nrt/nrt_sys_trace.h>

nrt_sys_trace_config_t *config;
nrt_sys_trace_config_allocate(&config);
nrt_sys_trace_config_set_defaults(config);

// Discover available event types
const char **event_types = nullptr;
size_t count = 0;
nrt_sys_trace_get_event_types(&event_types, &count);

// Disable all event types first
for (size_t i = 0; i < count; ++i) {
    nrt_sys_trace_config_set_capture_enabled_for_event_type(config, event_types[i], false);
}

// Enable only specific event types
nrt_sys_trace_config_set_capture_enabled_for_event_type(config, "model_load", true);
nrt_sys_trace_config_set_capture_enabled_for_event_type(config, "nrt_execute", true);

// Verify which event types are enabled
const char **enabled_types = nullptr;
size_t enabled_count = 0;
nrt_sys_trace_config_get_enabled_event_types(config, &enabled_types, &enabled_count);
printf("Enabled event types: %zu\n", enabled_count);
for (size_t i = 0; i < enabled_count; ++i) {
    printf("  %s\n", enabled_types[i]);
}

// Clean up
for (size_t i = 0; i < enabled_count; ++i) free((void*)enabled_types[i]);
free((void*)enabled_types);
for (size_t i = 0; i < count; ++i) free((void*)event_types[i]);
free((void*)event_types);

nrt_sys_trace_start(config);
// ... your workload ...
nrt_sys_trace_stop();
nrt_sys_trace_config_free(config);
Processing-time filtering#
Processing-time filtering preserves the complete trace and lets you analyze the same data with different filters without recapturing. Apply these when viewing or exporting profiles.
Filter by NeuronCore
neuron-explorer view -d ./output --system-trace-filter-neuron-core "0"
neuron-explorer view -d ./output --system-trace-filter-neuron-core "0,1,2,3"
Filter by event type
neuron-explorer view -d ./output --system-trace-filter-event-type "nrt_execute"
neuron-explorer view -d ./output --system-trace-filter-event-type "nrt_execute,nrt_load"
Filter by instance ID
neuron-explorer view -d ./output --system-trace-filter-instance-id "i-abc123"
neuron-explorer view -d ./output --system-trace-filter-instance-id "i-abc123,i-def456"
Skip system or device profiles
Reduce processing time by skipping one profile type:
# Skip device profiles (faster, system-only view)
neuron-explorer view -d ./output --ignore-device-profile

# Skip system profiles (device-only view)
neuron-explorer view -d ./output --ignore-system-profile
These work with --output-format parquet (default) or json.
Next steps#
Get Started with Neuron Explorer — Launch Explorer, upload profiles, and view results
Neuron Explorer Full Documentation — Complete viewer and feature reference
Profile Parquet Schema Reference — Complete profile data reference, matching
neuron-explorer --show-profile-schema
This document is relevant for: Inf1, Inf2, Trn1, Trn2, Trn3