
This document is relevant for: Inf1, Inf2, Trn1, Trn2, Trn3
Summary Viewer#
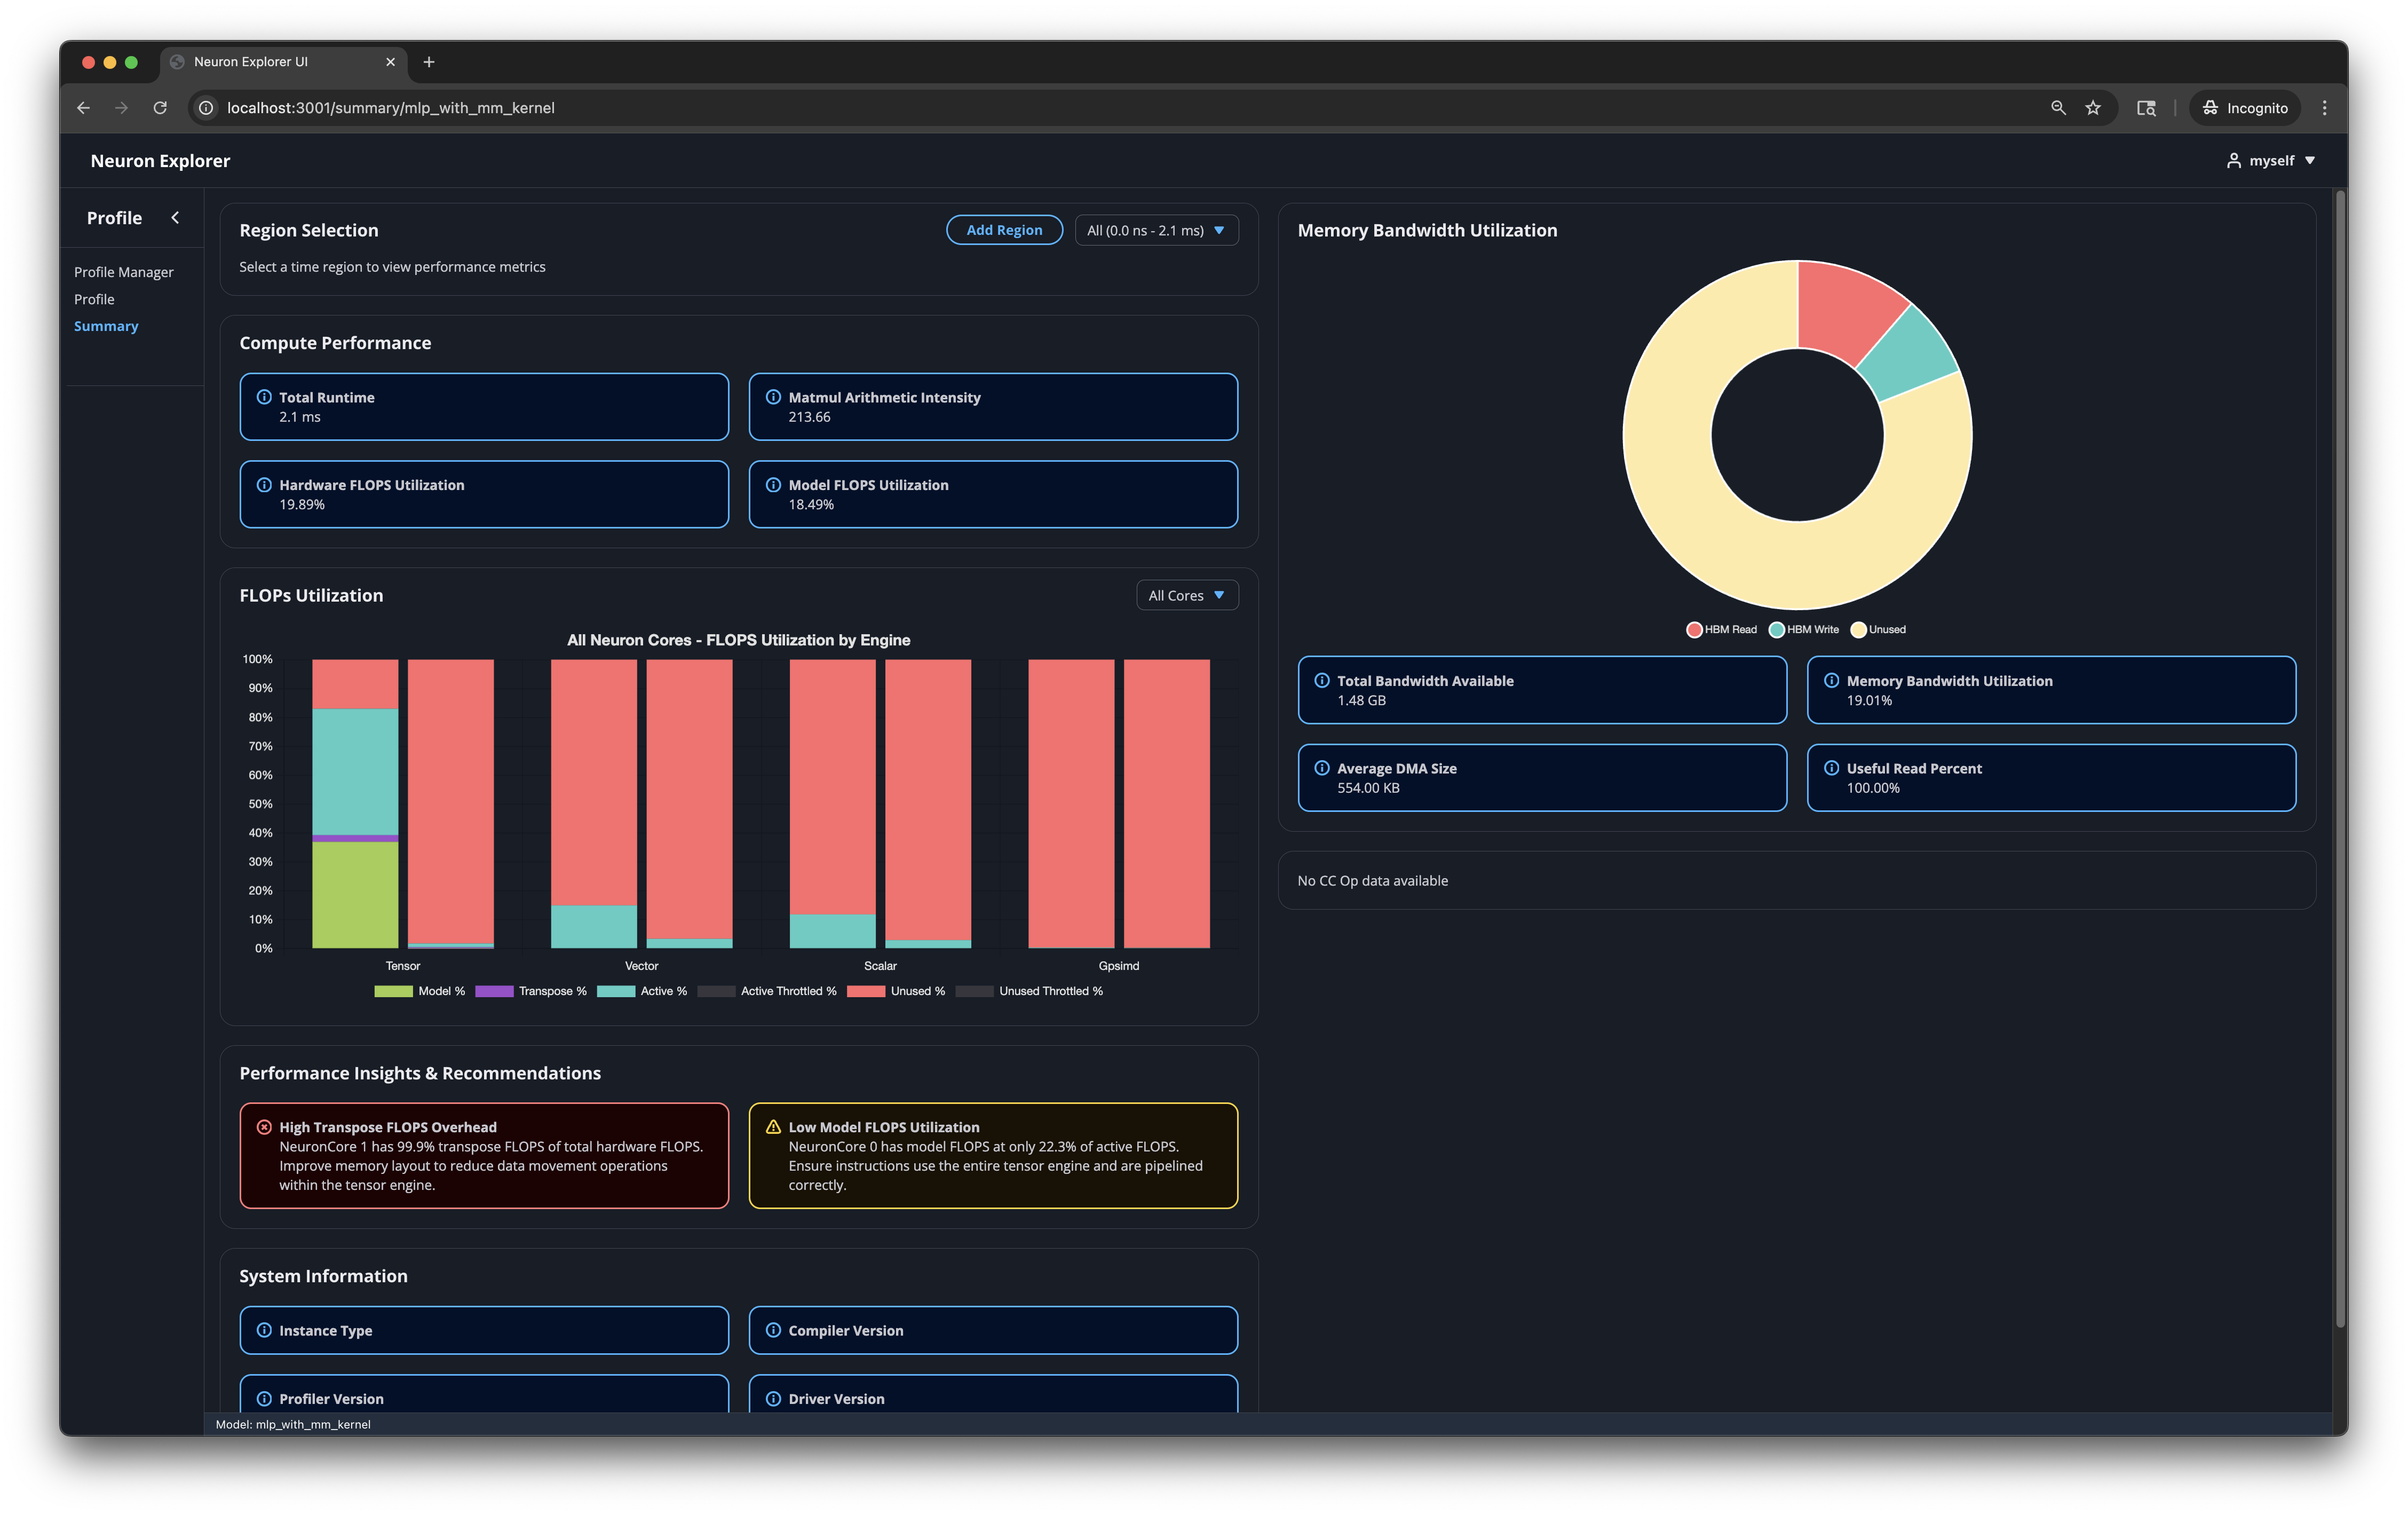
The Neuron Explorer Summary Viewer provides a streamlined view of your profile’s most critical performance insights, enabling quick identification of issues and optimization opportunities without navigating through detailed data.
Benefits#
Both new and experienced users benefit from this streamlined view of profiling data.
Identify performance issues quickly
Understand your profile’s most critical metrics at a glance
Get actionable recommendations for optimization
How to use#
Open your profile - The Summary Viewer is accessible via the Profile Manager or Neuron Explorer UI.
Examine key metrics - Review the metrics and graphs to understand your profile’s performance characteristics.
Review recommendations - Start with the Performance Insights & Recommendations section. This section highlights the most important performance issues.
Select specific time regions - Use the “Region Selection” menu to view specific timeslices corresponding to network layers. This helps you drill down into specific sections of your profile. You can generate custom time regions using the “Add Region” button.
Take action - Apply the recommended optimizations to your model or workload.
Understanding region-level insights#
When you work with profiles from entire networks or network subgraphs, different regions will have different performance characteristics. The landing page enables performance analysis on a per-layer basis and provides:
Layer-specific recommendations
Time-range indication of where problems occur
More accurate insights for complex profiles
Use the ‘Region Selection’ menu to navigate between different layers and view their individual performance data.
What the landing page displays#
Performance Insights and Recommendations#
This section shows 2-4 recommendations to help you improve performance. The profiler analyzes your data and identifies the most important issues to address. The profiler prioritizes recommendations by criticality and shows you the most critical ones first.
Example recommendations#
Condition |
Root Cause |
Recommended Action |
|---|---|---|
Low Model FLOPS relative to Active FLOPS (< 50%) |
Tensor engine is active but not performing useful matrix operations |
Ensure instructions use the entire tensor engine and are pipelined correctly |
NKI instruction coverage < 50% on tensor, vector, or scalar engine |
Compiler-generated instructions dominate the engine |
Write NKI kernel code for the network operations present in that profile section |
Active FLOPS throttling detected |
FLOPS lost due to throttling during active tensor engine periods |
Investigate the root cause of throttling to recover tensor engine utilization |
Transpose FLOPS > 10% of total hardware FLOPS |
Excessive data movement within the tensor engine |
Improve memory layout to reduce transpose operations |
Collective operation outliers detected |
Significantly underperforming collective operations relative to their group median |
Check for overlapping instructions that might be causing delays |
Spill reload bytes > 25% of total HBM reads |
Excessive spill/reload operations consuming memory bandwidth |
Check for data dependencies causing excessive spill/reload operations |
Key Metrics#
This section displays tables and graphs that summarize your profile’s performance metrics.
Compute Performance Statistics#
total_time - Total duration of on-device time for the run in seconds. This doesn’t include host-device data movement overhead or host runtime/framework overhead.
mm_arithmetic_intensity - The ratio of regular Matrix Multiplication (MATMUL) Floating Point Operations (FLOPs) to total Dynamic Random Access Memory (DRAM) transfer size. This metric helps you determine if your workload is memory-bound or compute-bound.
hfu_estimated_percent - Hardware FLOPs Utilization reflects the Tensor Engine utilization calculated from all Tensor Engine instructions.
mfu_estimated_percent - Model FLOPs Utilization reflects the Tensor Engine utilization for useful compute (matrix multiplications from your model definition).
Memory Bandwidth Utilization#
total_bandwidth_available - The total bytes possible to be transferred within the given time region for the current Neuron hardware specification.
mbu_estimated_percent - Memory Bandwidth Utilization (MBU) shows the achieved (as running on the current Neuron hardware) High Bandwidth Memory (HBM) bandwidth utilization.
average_dma_size - The average DMA transfer size (higher is better).
useful_read_percent - The fraction of HBM reads that are useful (
hbm_read_bytes-hbm_reload_bytes) / hbm_read_bytes). Note that “useful” is related to an inherent property of the memory itself, but a measurement of how efficiently the memory is being utilized by a specific workload or application. Low numbers may indicate inefficient memory access patterns and suboptimal layouts.
FLOPs Utilization#
For each compute engine (tensor, vector, scalar, gpsimd), displays how well utilized the engine is. You can view all cores simultaneously or select a specific Neuron Core from the dropdown.
Tensor Engine#
The Tensor engine has a detailed breakdown of how the FLOPs are being used:
model_flops: The percentage of tensor flops spent performing useful matrix operations, contributing to model progress
transpose_flops: The percentage of tensor flops spent performing transpose operations / data movement
active_flops - Percentage of tensor flops that correspond to the active_time of the tensor engine, but where the engine was not effectively utilized.
throttled_flops (active and inactive) - Percentage of FLOPs wasted due to throttling, either during active or inactive tensor engine periods.
There are a few key things to look for in this graph:
model_flops relative to active_flops. Large differences could indicate that the tensor engine is being poorly utilized with small tensor sizes, or that operations are not being pipelined effectively.
model_flops relative to transpose_flops. It is desired to have little-to-no
transpose_flopsconsuming tensor engine utilization. Ideally themodel_flopsamount is much larger than the amount of transposes.active_throttled_flops: FLOPs lost due to throttling during active periods is undesirable. It is worth identifying the root cause for the throttling if there is indication of this happening.
Other Engines (Scalar, Vector, GpSimd)#
These engines do not yet have detailed FLOP utilization breakdowns, they only show the active period of operation for the engine.
active_flops - Percentage of FLOPs when the engine processes at least one instruction (excluding semaphore waits).
NKI Engine Statistics#
This chart shows the instruction count breakdown between NKI-generated instructions and compiler-generated instructions for each compute engine (tensor, vector, scalar). The stacked bar chart helps you understand how much of your workload is running NKI kernel code versus compiler-generated code.
Hovering over a bar displays a detailed breakdown of instruction counts by opcode for that engine and source type.
When NKI instruction coverage is below 50% for a given engine, the Summary Viewer generates a recommendation to write NKI kernel code for the network operations in that profile section.
DMA Utilization#
This chart shows how the DMA engines are being utilized, displayed as a percentage of the total available bandwidth. Two dropdown menus control the chart’s aggregation:
Outer aggregation - Choose between viewing data per DMA engine (“All Engines”) or per Neuron Core (“Neuron Cores”).
Inner aggregation - Choose between grouping by data type or source type:
Data Type groups transfers into Instruction, IO, Weights, and Dynamic categories.
Source Type groups transfers into Static (compiler-generated), Software Dynamic (GpSimd-generated), and Hardware Dynamic (DGE hardware-generated) categories.
Each category shows two bar segments: a solid bar representing bandwidth utilization and a striped bar representing active time utilization beyond the bandwidth portion. This helps distinguish between time spent transferring data and time the DMA engine is active but not fully utilizing bandwidth.
Memory Bandwidth Breakdown#
Shows how the available HBM memory bandwidth was used as a doughnut chart:
HBM Read — effective read bytes (excluding spill reloads)
HBM Write — effective write bytes (excluding spill saves)
SBUF Spill Reload — bytes reloaded from HBM due to state buffer spills
SBUF Spill Save — bytes saved to HBM due to state buffer spills
Unused — remaining available bandwidth
Collective Operations Duration#
Displays the duration of each collective operation in the profile, grouped by operation type and size. Two visualization modes are available via a dropdown:
Scatter - Shows individual operation durations as scatter points, with each operation type on a separate row. Hovering over a point displays detailed information including algorithm, operation, duration, start/end timestamps, element count, input/output sizes, and trigger engine. Clicking a point pins the tooltip for easy text selection.
Box Plot - Shows the statistical distribution (min, Q1, median, mean, Q3, max, variance, count) of operation durations per operation type. This is useful for quickly identifying the spread and central tendency of each operation group.
Both modes are useful for identifying outliers in collective runtime, which can be used to investigate specific sections of the profile more deeply. It is possible to filter out datasets by clicking on the datasets in the legend of the graph.
System Information#
Displays metadata about the system and software versions used during profiling:
Instance Type
Compiler Version
Explorer Version
Driver Version
Runtime Version
Collectives Version
System Profile Summary#
When a system profile is loaded, the Summary Viewer automatically switches to the System Profile Summary view. System profiles capture data across multiple devices, processes, and instances, providing a holistic view of distributed workload performance.
Overview#
The System Profile Summary provides:
A high-level overview of the entire system’s profiling session
HBM memory usage trends across logical NeuronCores
A detailed table of all device profiles with key performance metrics
The ability to drill down into individual device profiles for detailed analysis
System Overview Card#
Displays aggregate information about the profiling session:
Instances - Number of unique instances captured in the profile
Processes - Number of unique processes captured
System Profile Time - Total wall-clock duration of the system profiling session
Total Device Runtime - Cumulative on-device execution time across all device profiles
Total Device Profiles - Number of individual device profiles in the system profile
HBM Memory Usage Chart#
A line chart showing HBM memory usage over time. When per-NeuronCore data is available, the chart displays a separate line for each logical NeuronCore (HBM index), color-coded for easy identification. When only aggregate data is available, a single filled area chart shows total HBM usage.
The x-axis shows time (in the profiling session’s time domain) and the y-axis shows memory usage in bytes. Hovering over the chart displays the exact timestamp and memory usage for each NeuronCore.
Device Profiles Table#
A table listing all device profiles captured in the system profile. The table supports:
Process filtering - Use the dropdown to filter profiles by process ID, or select “All Processes” to view everything.
Expandable rows - Click the expand arrow on any row to see additional per-profile metrics including tensor/vector/scalar engine active time percentages, DMA active time, and HBM read/write bytes.
Column tooltips - Hover over column headers to see descriptions of each metric from the profile schema.
Table columns:
Profile Name - Clickable link that navigates to the detailed device profile view
LNC - Logical NeuronCore ID
Neuron Cores - Number of physical NeuronCores used by this profile
Total Duration - Total on-device execution time for this profile’s events
Calls - Number of execution events for this profile
Duration - Total profiled time for this device profile
MFU - Model FLOPs Utilization
HFU - Hardware FLOPs Utilization
MBU - Memory Bandwidth Utilization
CC Active - Collective communication active time percentage
Device Profile Detail View#
Clicking a device profile name in the table navigates to a detail view that embeds the standard Summary Viewer for that specific device profile. This provides the full set of per-device metrics, charts, and recommendations described in the sections above.
A “Back to System Overview” button at the top returns you to the system-level summary.
This document is relevant for: Inf1, Inf2, Trn1, Trn2, Trn3