
This document is relevant for: Inf1, Inf2, Trn1, Trn2, Trn3
Neuron Top User Guide#
Overview#
neuron-top provides useful information about NeuronCore and vCPU utilization, memory usage,
loaded models, and Neuron applications.
Note
neuron-top fully supports the newly launched trn2 instances.
Note
If you are parsing neuron-top output in your automation environment, you can now replace it with neuron-monitor
(Neuron Monitor User Guide) which outputs data in a standardized, easier to parse JSON format.
Using neuron-top#
Command line arguments#
Launch neuron-top by simply typing its name in the shell: neuron-top.
User interface#
The title section of the user interface shows the application’s version number, EC2 instance ID, and the instance type on which it is running:

The rest of the user interface is divided in 4 sections. The data shown in these sections applies to the currently selected tab - which can be the ‘all’ tab, which aggregates data from all running Neuron processes, or a tab representing a single Neuron process:
The
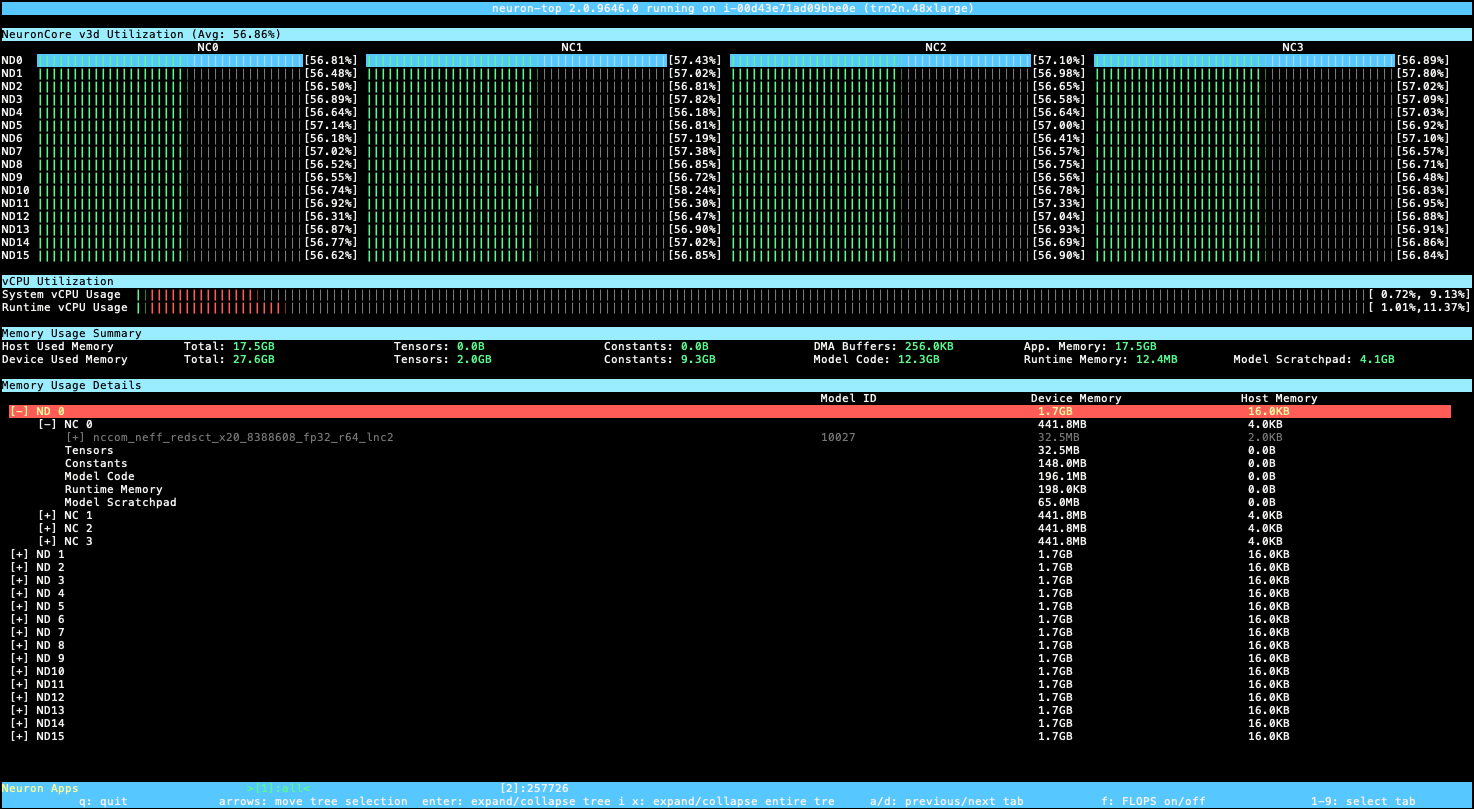
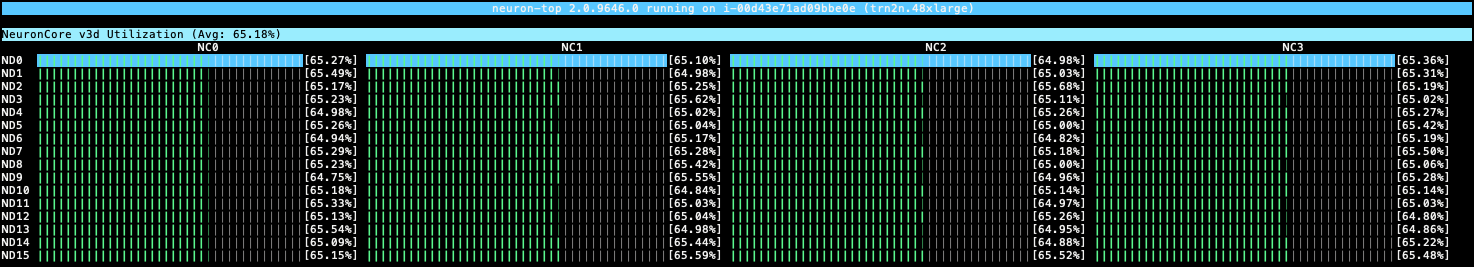
NeuronCore <vers> Utilizationsection shows the NeuronCore utilization for the currently selected tab.<vers>is the version of the NeuronCores on the instance (for example,v2for trn1 instances and inf2 instances,v3for trn2 instances withLNC=1,v3dfor trn2 instances withLNC=2)Pressing the ‘F’ key will toggle between displaying utilization percentages - as seen in the previous image - and teraflops (trillion floating point operations per second), as seen in the image below:
The
VCPU Utilizationsection shows:System vCPU usage- the two percentages are user% and system%Runtime vCPU usage- same breakdown
The
Memory Usage Summarysection provides a breakdown of the total memory usage on the Neuron Device as well as on the host:Host Used Memory- amount of host memory used by the selected application (or an aggregate of all applications if ‘All’ is selected)Total- total amount of host memory usedTensors- amount of host memory used for tensorsConstants- amount of host memory used for constants (for applications running training) or weights (for applications running inferences)DMA Buffers- amount of host memory used for DMA transfersApp. Memory- amount of host memory used by the application that doesn’t fall in any of the previous categories
Device Used Memory- amount of device memory used by the selected application (or an aggregate of all applications if ‘All’ is selected)Total- total amount of device memory usedTensors- amount of device memory used for tensorsConstants- amount of device memory used for constants (for applications running training) or weights (for applications running inferences)Model Code- amount of device memory used for storing model executable codeRuntime Memory- amount of device memory used by the Neuron Runtime (outside of the previous categories)Model Scratchpad- amount of device memory used for the shared model scratchpad, a shared buffer used for internal model variables and other auxiliary buffers
Memory Usage Detailscontains memory usage data organized as a tree which can be expanded/collapsed. The columns are:Model ID- the Neuron Runtime identifier for this model instanceHost Memory- amount of host memory usedDevice Memory- amount of device memory used
The tree view shows the amount of memory used for the same categories shown in the Memory Usage Summary but in this section
they are attached to either a model (if the memory has been allocated at model load time for that model), or to a NeuronCore (if
the memory can’t be associated with a model, but has been allocated for that NeuronCore).
The ‘parent’ shows the total amount of memory used - the sum of its children.
Note
The up/down/left/right keys can be used to navigate the tree view. The ‘x’ key expands/collapses the entire tree.
The bottom bar shows which Neuron process’ data is currently displayed by highlighting its tag using a green font and marking it using a pair of ‘>’, ‘<’ characters. The ‘all’ tab shows an aggregated view of all the Neuron processes currently running on the instance.

Note
The ‘1’-‘9’ keys select the current tab. ‘a’/’d’ selects the previous/next tab on the bar.
This document is relevant for: Inf1, Inf2, Trn1, Trn2, Trn3