
This document is relevant for: Inf1, Inf2, Trn1, Trn2, Trn3
System Profile#
The Neuron System Profile show a system-level granularity of execution across instances and workers in your workload. This provides visibility into Neuron Runtime API calls and ML framework function calls (PyTorch or JAX) to help identify bottlenecks in distributed workloads. The Neuron Explorer UI provides system-level widgets for an extensible and customizable workflow.
System Trace Viewer#
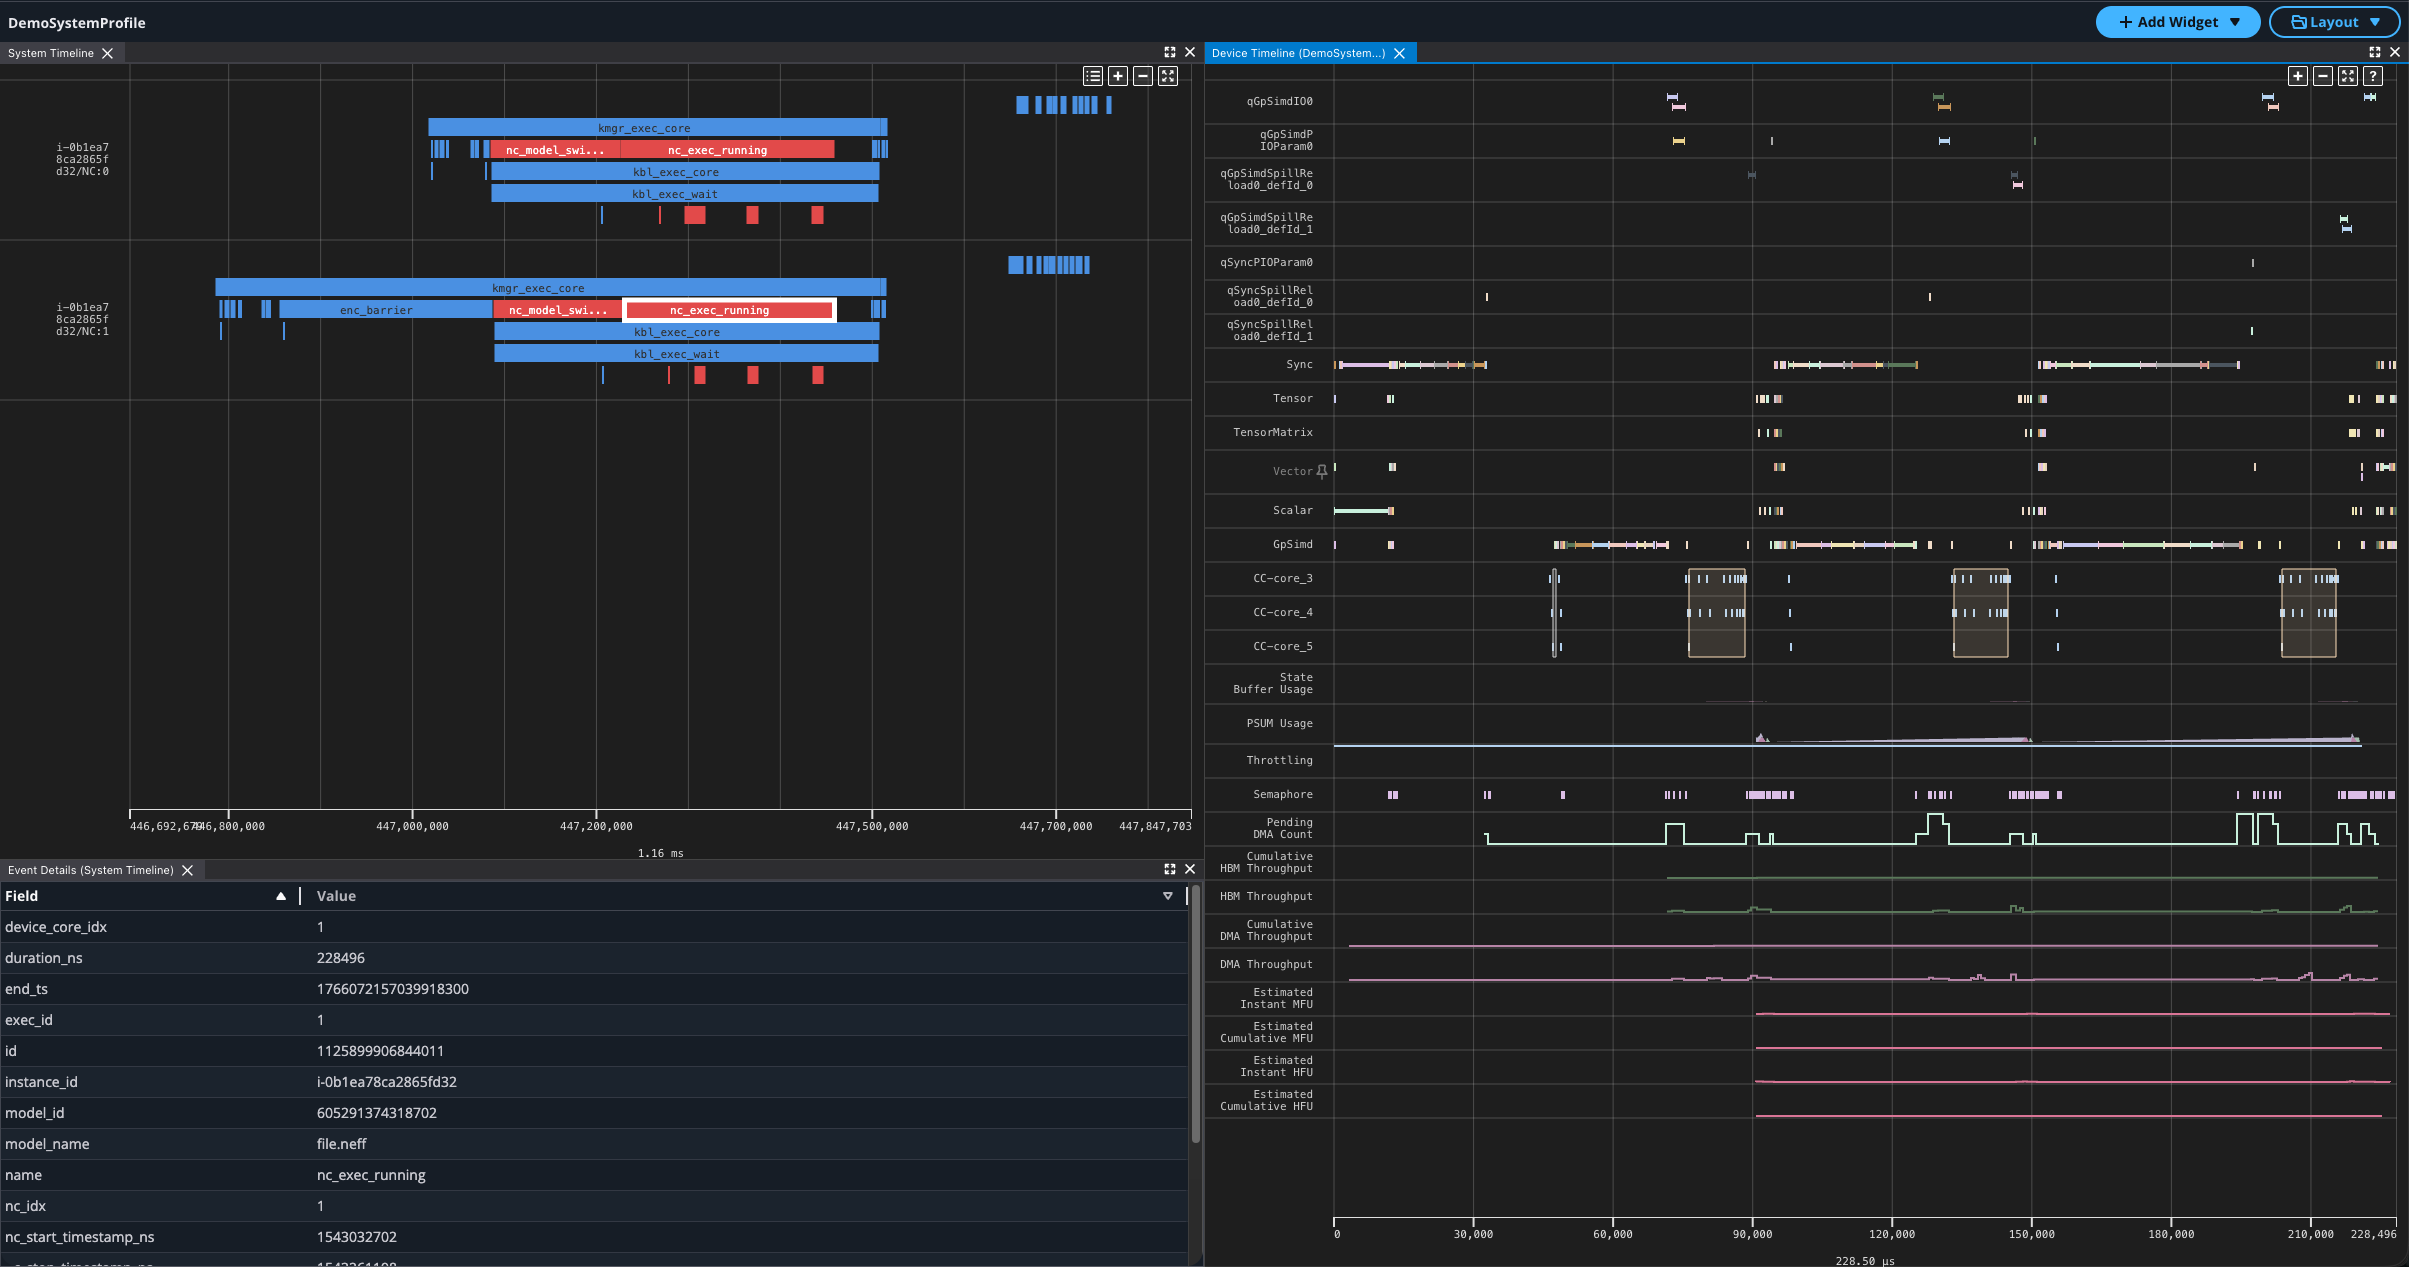
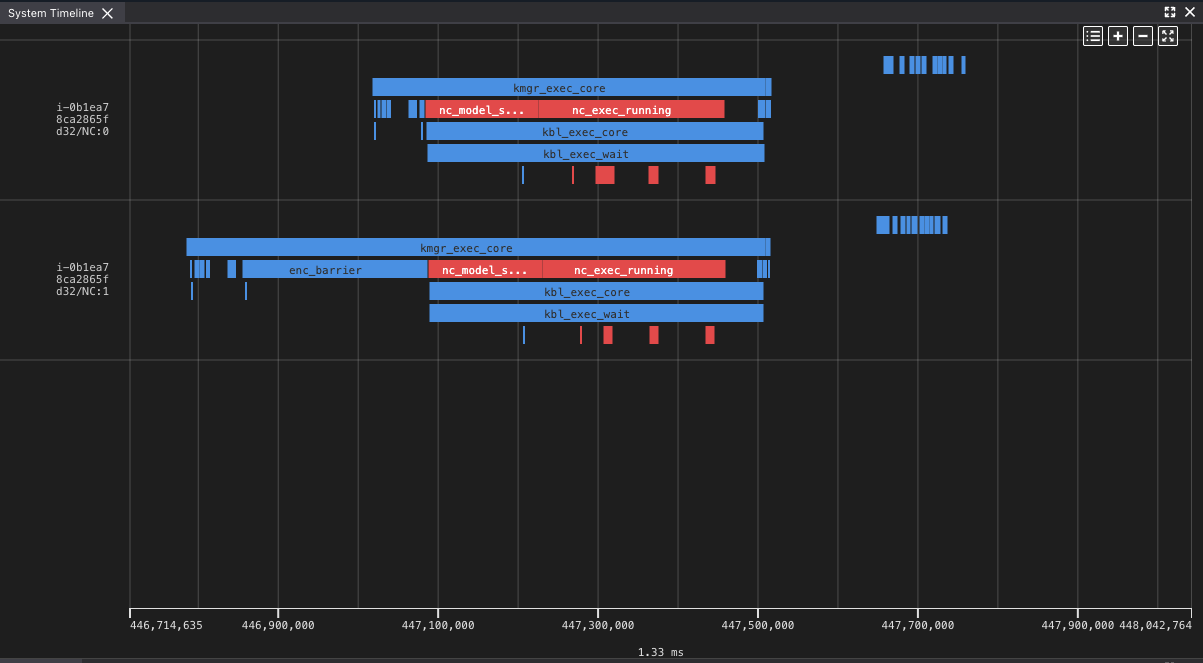
The System Trace Viewer provides an interactive timeline interface with time range selection, configurable event grouping, system event details on hover, and linking of hardware events to Device Trace Viewer widgets.
You can see events in the Neuron Runtime and correlate them with hardware execution events on the Neuron Devices.
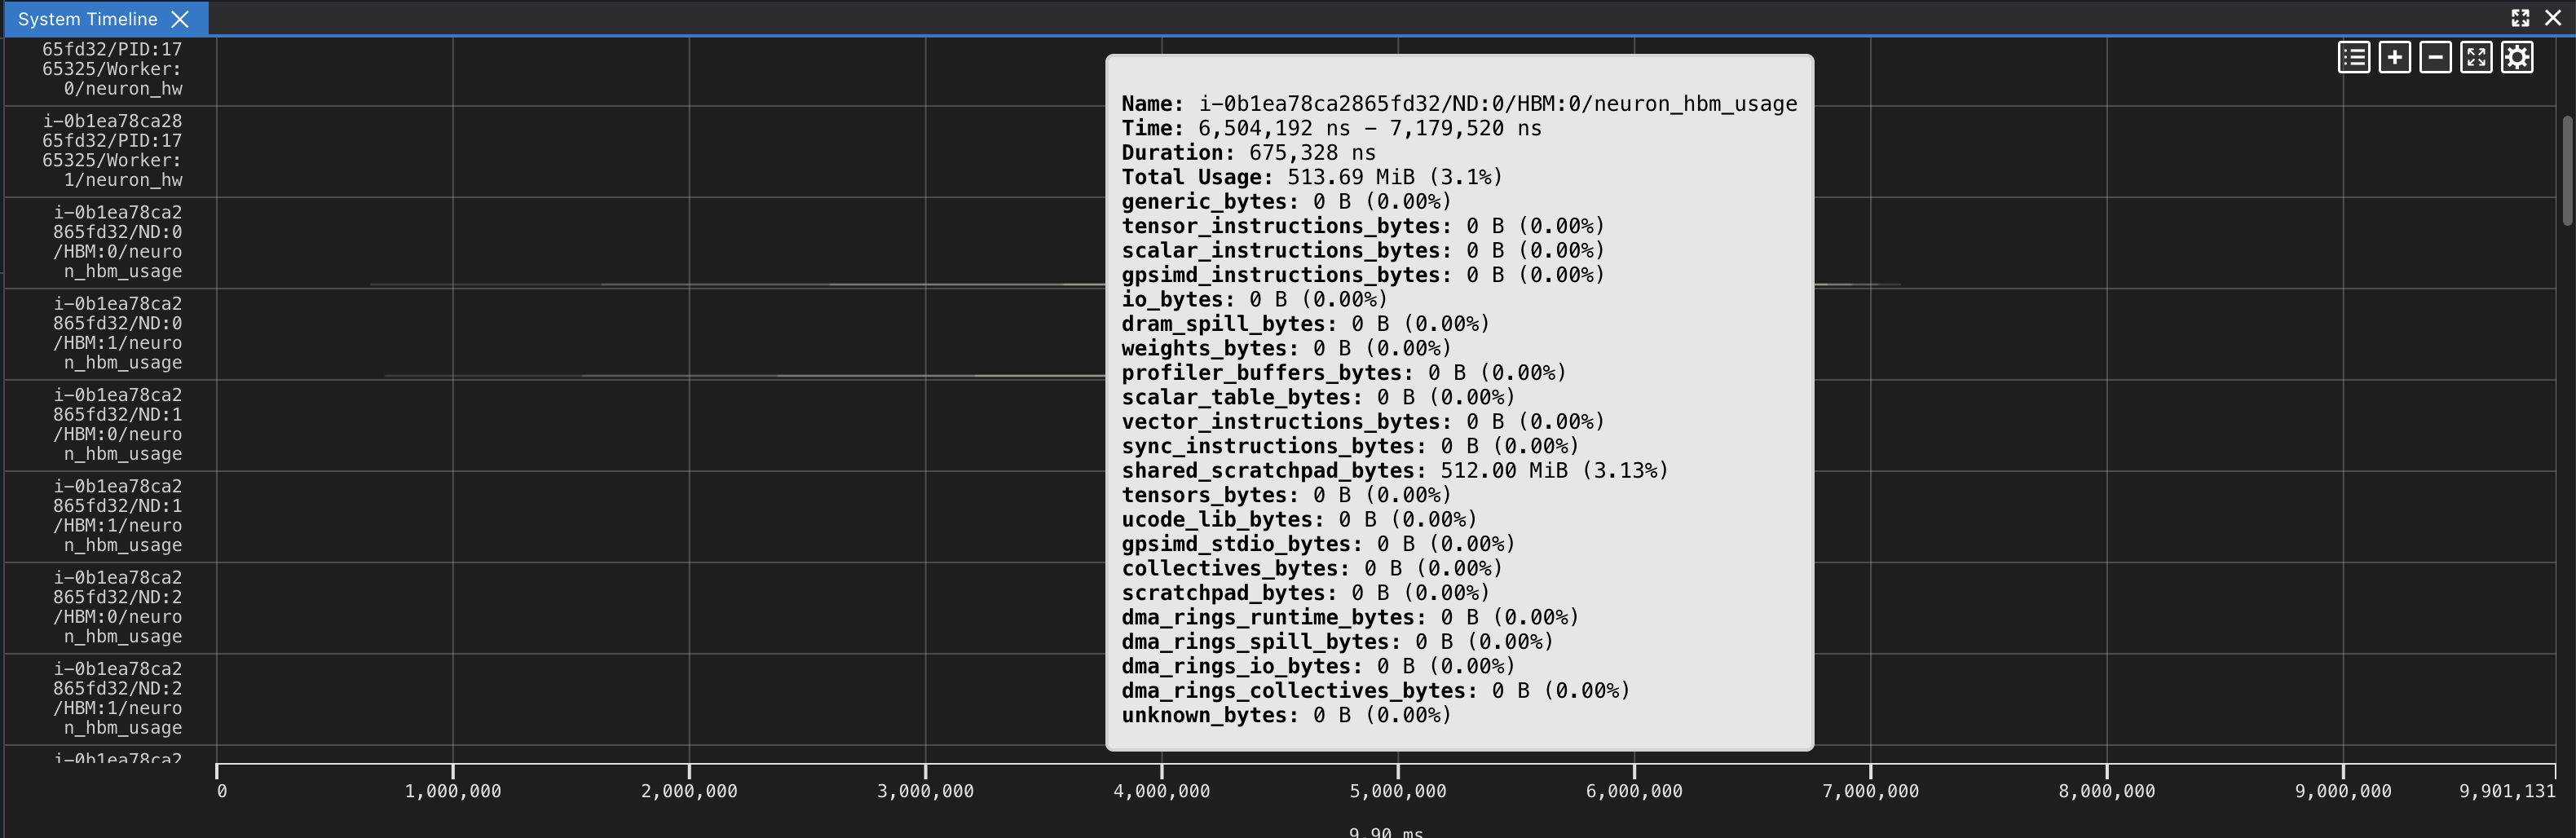
You can also see the device memory (HBM) allocations for each Neuron device over time. Hovering over these memory usage events shows a breakdown by usage category.
Visualizing Host Device Transfers#
The System Trace Viewer includes tracks for host-device data transfers, which are often a significant contributor to end-to-end latency and can reveal whether a workload is bottlenecked on PCIe traffic. host_to_device transfers move data from CPU RAM to device HBM (for example, loading model weights or input tensors), while device_to_host transfers move data in the reverse direction (for example, returning output tensors to the host). For each direction, two tracks are shown:
A transfer events track that displays each individual transfer as a discrete event on the timeline. This is useful for correlating specific transfers with surrounding runtime and hardware events to understand when and why a transfer occurred.
A transfer bandwidth track that plots the PCIe bandwidth consumed by transfers in that direction over time. This helps identify how close the workload is to the link’s practical throughput limit.
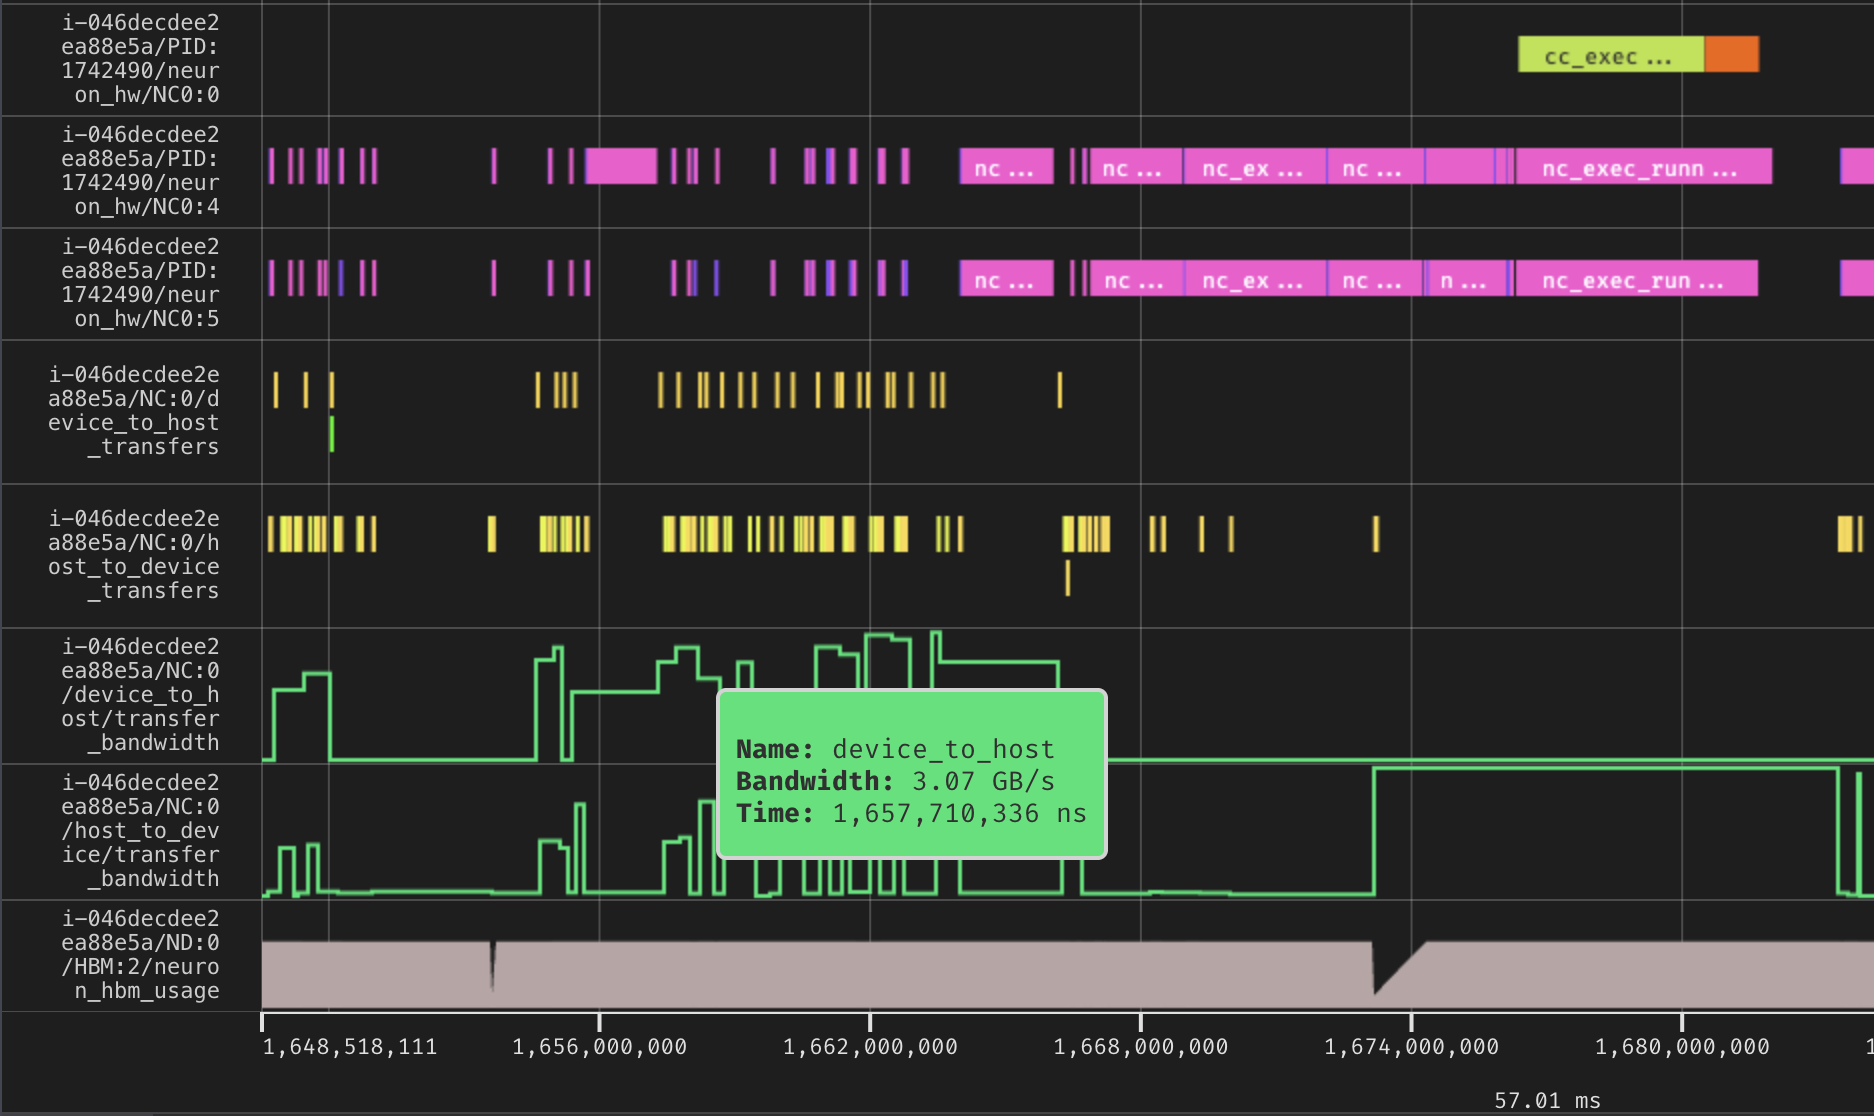
For distributed workloads, transfer tracks are aggregated by Instance ID and NeuronCore. For example, i-046decdee2ea88e5a/NC:0/host_to_device_transfers shows transfers from host to device on instance i-046decdee2ea88e5a that are required for model execution on NeuronCore 0 of that instance.
Other grouping options are available in the System Timeline settings. The default Instance + NeuronCore grouping renders one set of transfer tracks per NeuronCore on each instance in the workload, which is useful for pinpointing per-core behavior. The Instance grouping aggregates transfers across all NeuronCores on a given instance, producing a single set of tracks per instance, which is useful for comparing total host-device traffic between instances.
Adding Widgets#
The System Profile supports both System and Device widgets, enabling multi-profile analysis, for example comparing annotated device events across different devices.
To add a widget:
Click the Add Widget button to open the Add Widget modal.
Select a Device or System widget.
Click a widget tile to load it with the selected profile. Each tile is tagged with its supported profile type (system, device, or both).
To load multiple instances of the same widget type for different profiles, repeat the steps above and select a different profile each time.
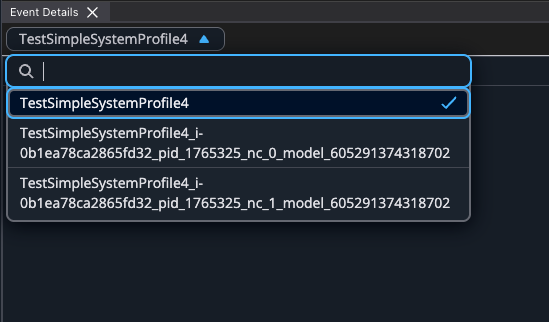
After adding a widget, you can switch to a different profile by using the profile dropdown at the top of the widget.
Note
Adding duplicate widgets for the same profile is not currently supported.
Settings#
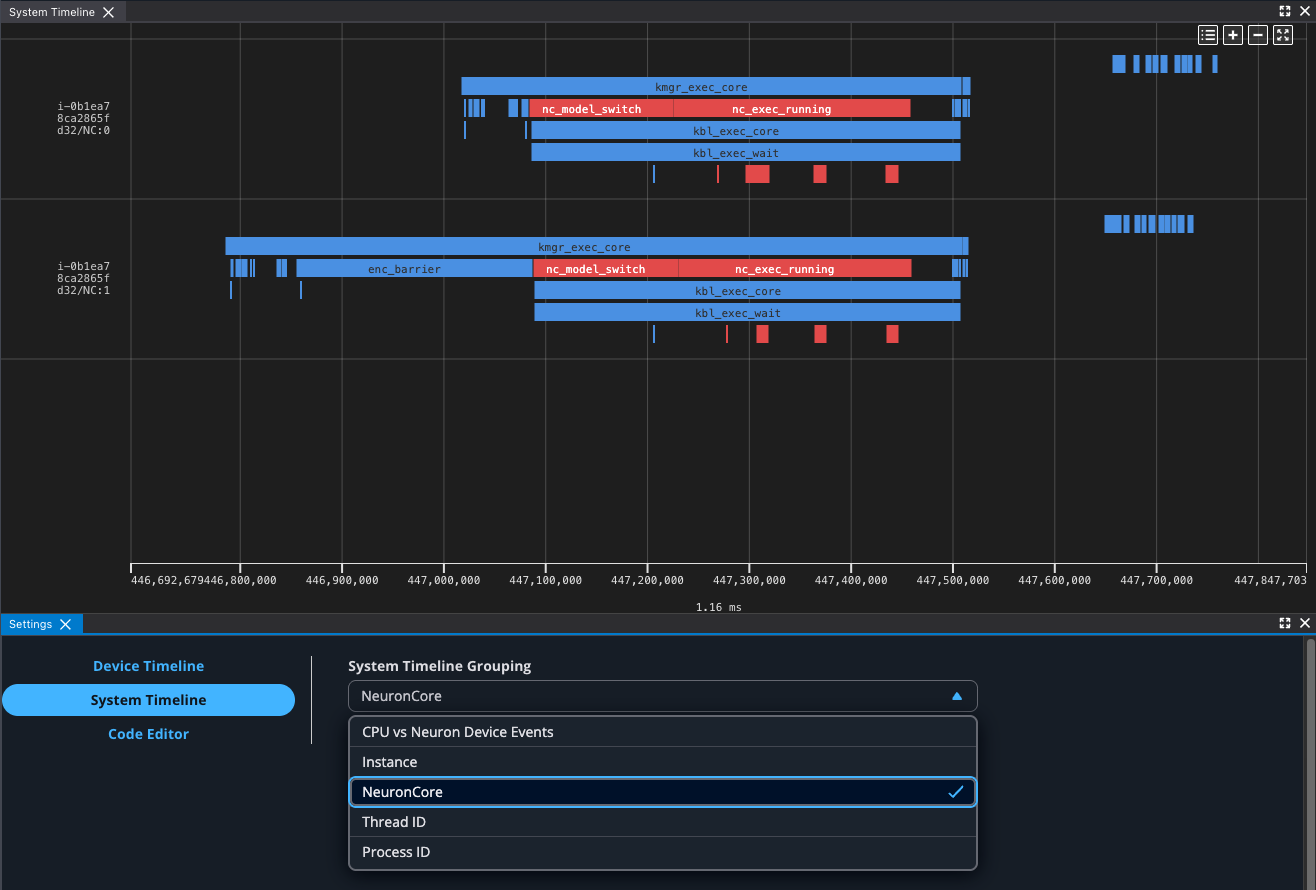
The System Trace Viewer supports multiple grouping modes to organize events for different analysis perspectives. You can switch between the following grouping modes in the settings to focus your analysis on different aspects of system performance:
Grouping Option |
Description |
Example |
|---|---|---|
Default |
Groups events by instance ID, process ID, and event source, with an additional tier of grouping based on the event source.
For framework events, the operator dispatch events ( |
Framework dispatch events: |
CPU vs Device Grouping |
Groups events by event source (CPU or Neuron device events) |
Runtime events: |
NeuronCore Grouping |
Groups events by individual NeuronCore |
|
Thread Grouping |
Groups events by thread identifier |
|
Process Grouping |
Groups events by process identifier |
|
Instance Grouping |
Groups all events by instance only |
|
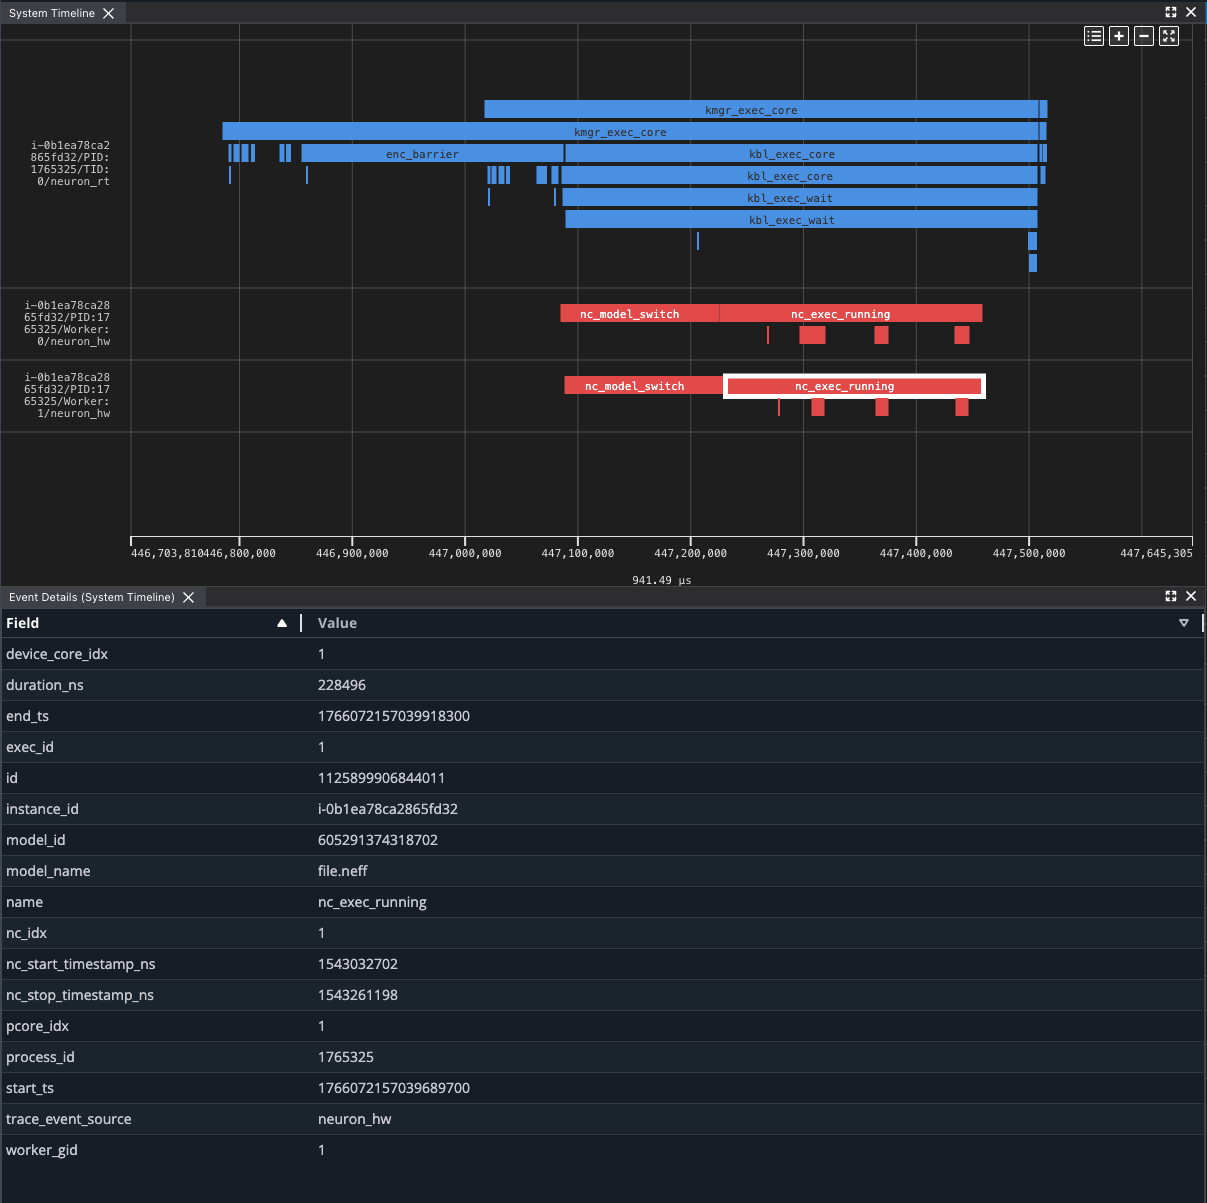
Event Details#
Clicking on trace events in the timeline populates the Event Details widget with a list of properties for the system trace event.
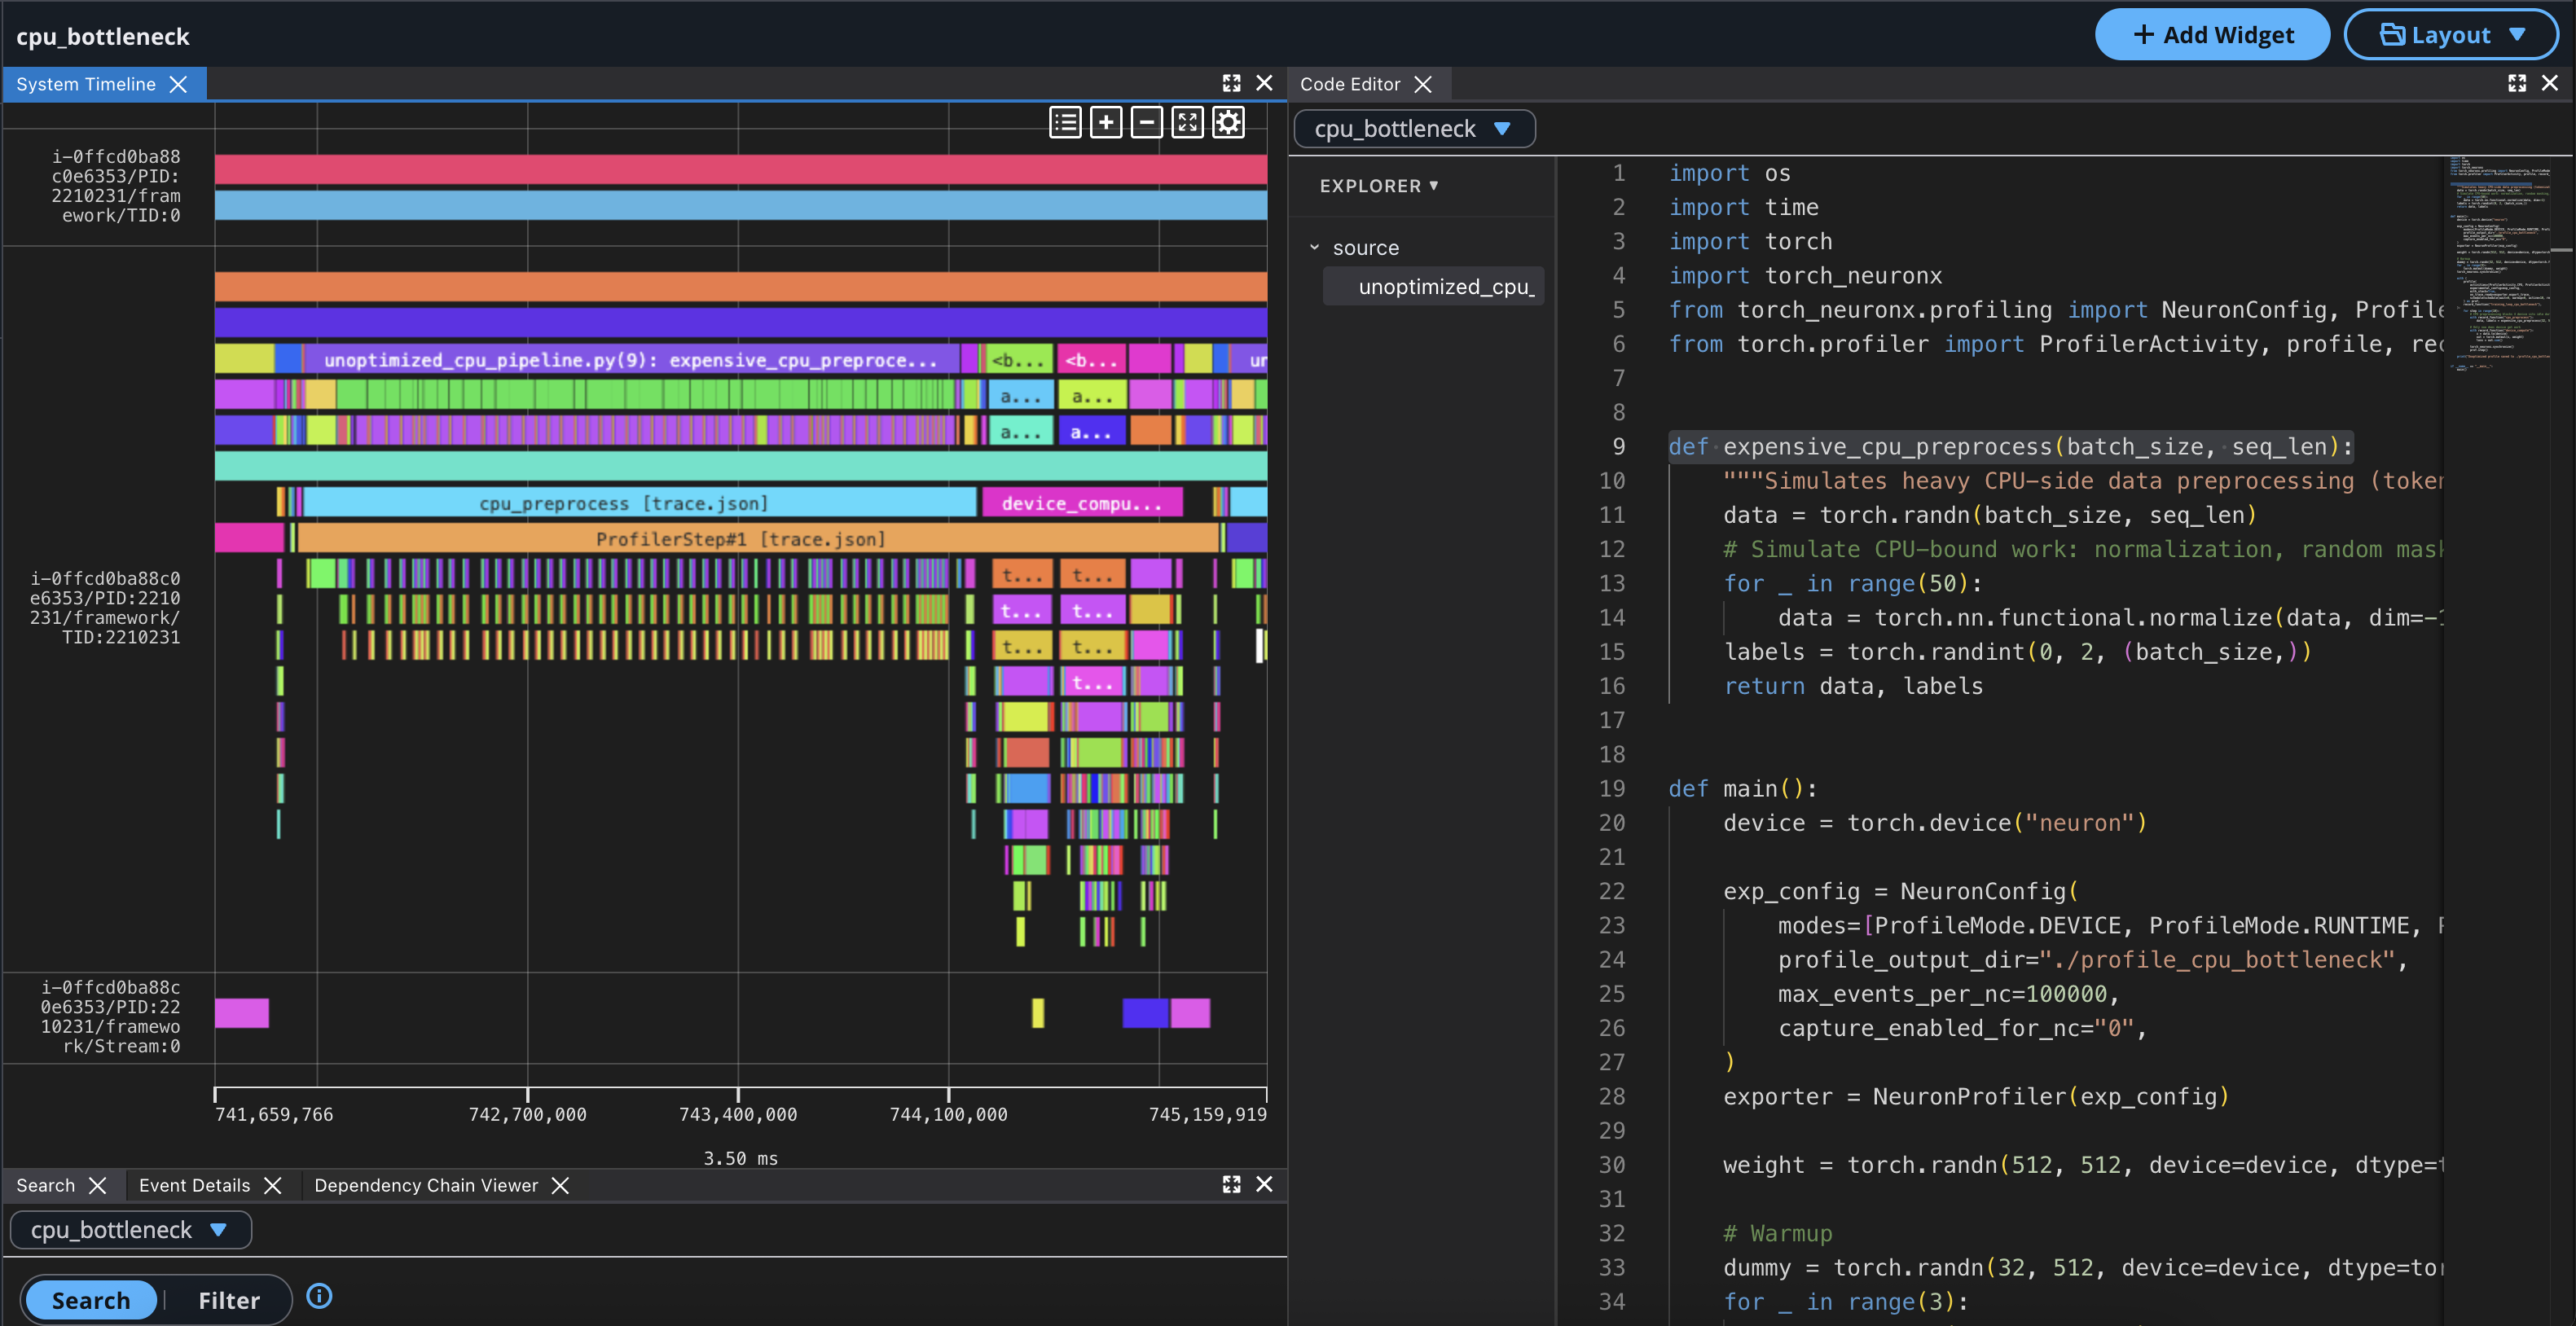
Source Code Linking#
When capturing profiles through the native PyTorch profiling API, using with_stack=True will record source information in the framework events.
If the source code is uploaded alongside the profile, for any framework event with <source_file>(<line_number>) in the name, you can (Ctrl/Cmd) + click on the event to scroll to the corresponding
source code line in the Code Viewer.
Device Profile Linking#
The System Trace Viewer links hardware events to the Device Trace Viewer, which renders the corresponding device traces.
Navigating from the System Trace Viewer to a Device Trace Viewer can be accomplished in two ways:
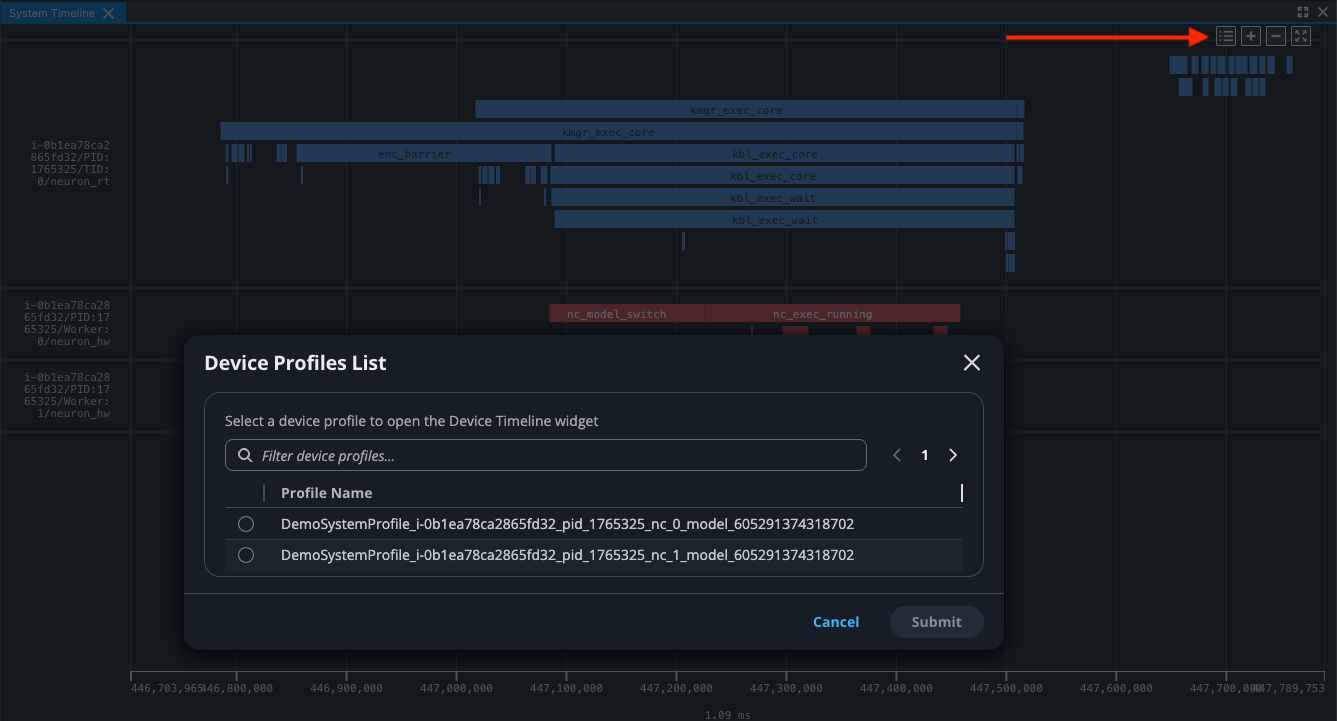
Open the Device Profile List Modal#
To see a list of all device profiles captured during your workload:
Click the “Device Profiles List” button in the top right action bar of the System Trace Viewer to open a modal containing a list of device profiles
Select a Device Profile and click Submit to open the Device Trace Viewer with the selected device profile
Drill-down from Hardware Events#
To drill-down from a hardware event to the Device Trace Viewer:
Find a hardware event such as
nc_exec_runningClick on the hardware event
Wait for the Device Trace Viewer to open
This will open a new Device Trace Viewer with the selected device profile showing detailed hardware events. To learn about device profiles, see Device Profiles in Neuron Explorer.
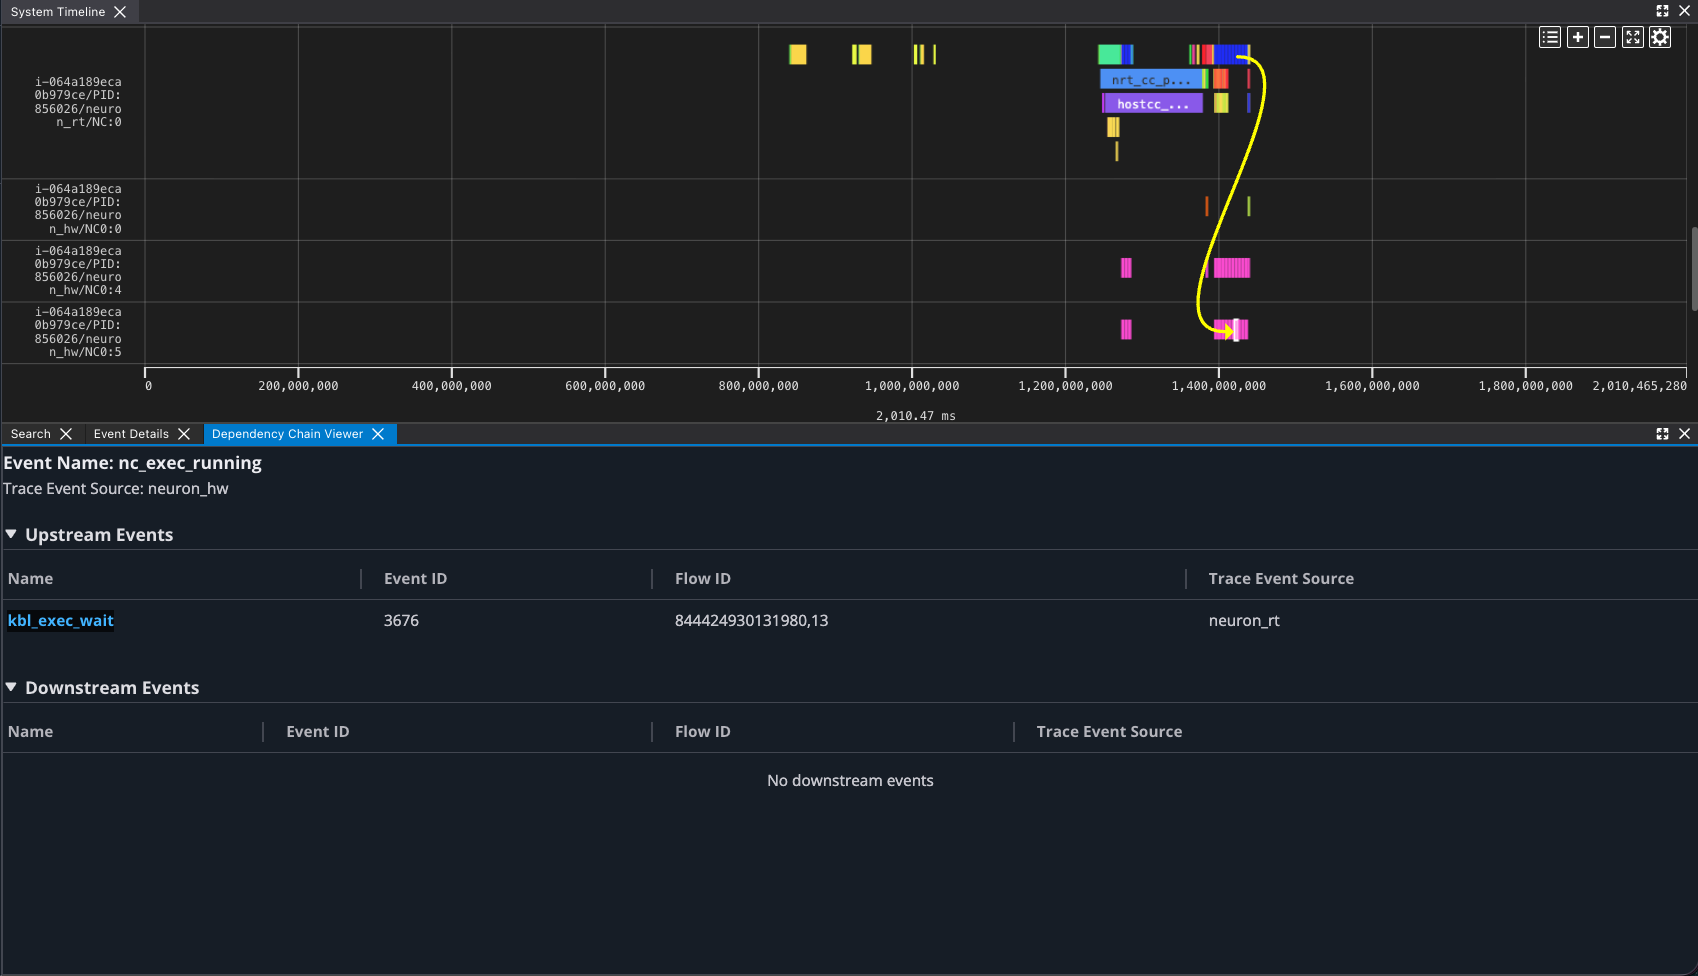
Dependency Chain Viewer#
The Dependency Chain Viewer widget enables you to navigate the dependency chain between system profile events. When you click a system profile event containing a flow-id, the viewer draws arrows indicating the dependency relationship between events. Clicking the event name in the Dependency Chain Viewer triggers the System Trace Viewer to refocus on that specific event.
For example, you can click a runtime event and navigate to its related hardware events to understand where time is being spent.
Note
The Dependency Chain Viewer currently displays the dependency chain between framework events (from PyTorch profiler), neuron_rt, and neuron_hw events.
Native PyTorch profiling is in private beta. You must be enrolled in Native PyTorch private beta 3. Contact the Neuron Product team or see Native PyTorch for AWS Trainium to sign up. For more information, see Capture profiles with Neuron Explorer.
Clicking on an event with dependencies populates the UI with the following elements:
Arrows — curved arrows rendered in the System Trace Viewer display the flow between dependent events.
Upstream Events — table of events preceding the selected event.
Downstream Events — table of events following the selected event.
Using the Dependency Chain Viewer#
Open the system profile in the Neuron Explorer UI.
Click on a system profile event that has upstream or downstream events to populate the Dependency Chain Viewer.
In the Upstream Events and Downstream Events tables, click on an event link to automatically scroll and focus the System Trace Viewer on that event.
This document is relevant for: Inf1, Inf2, Trn1, Trn2, Trn3