This document is relevant for: Inf2, Trn1, Trn2, Trn3
Neuron Explorer UI overview#
This page provides a guided tour of the Neuron Explorer UI. For each viewer and tool, you’ll find what it does and when to use it, grouped by workflow.
Neuron Explorer is available as a browser UI, a VS Code extension, and a CLI. The viewers below cover the browser and VS Code UIs. For CLI-only workflows, see Get started with Neuron Explorer.
UI navigation map#
The following diagram shows how the viewers and tools connect within the Neuron Explorer UI. Use it as a navigation map.
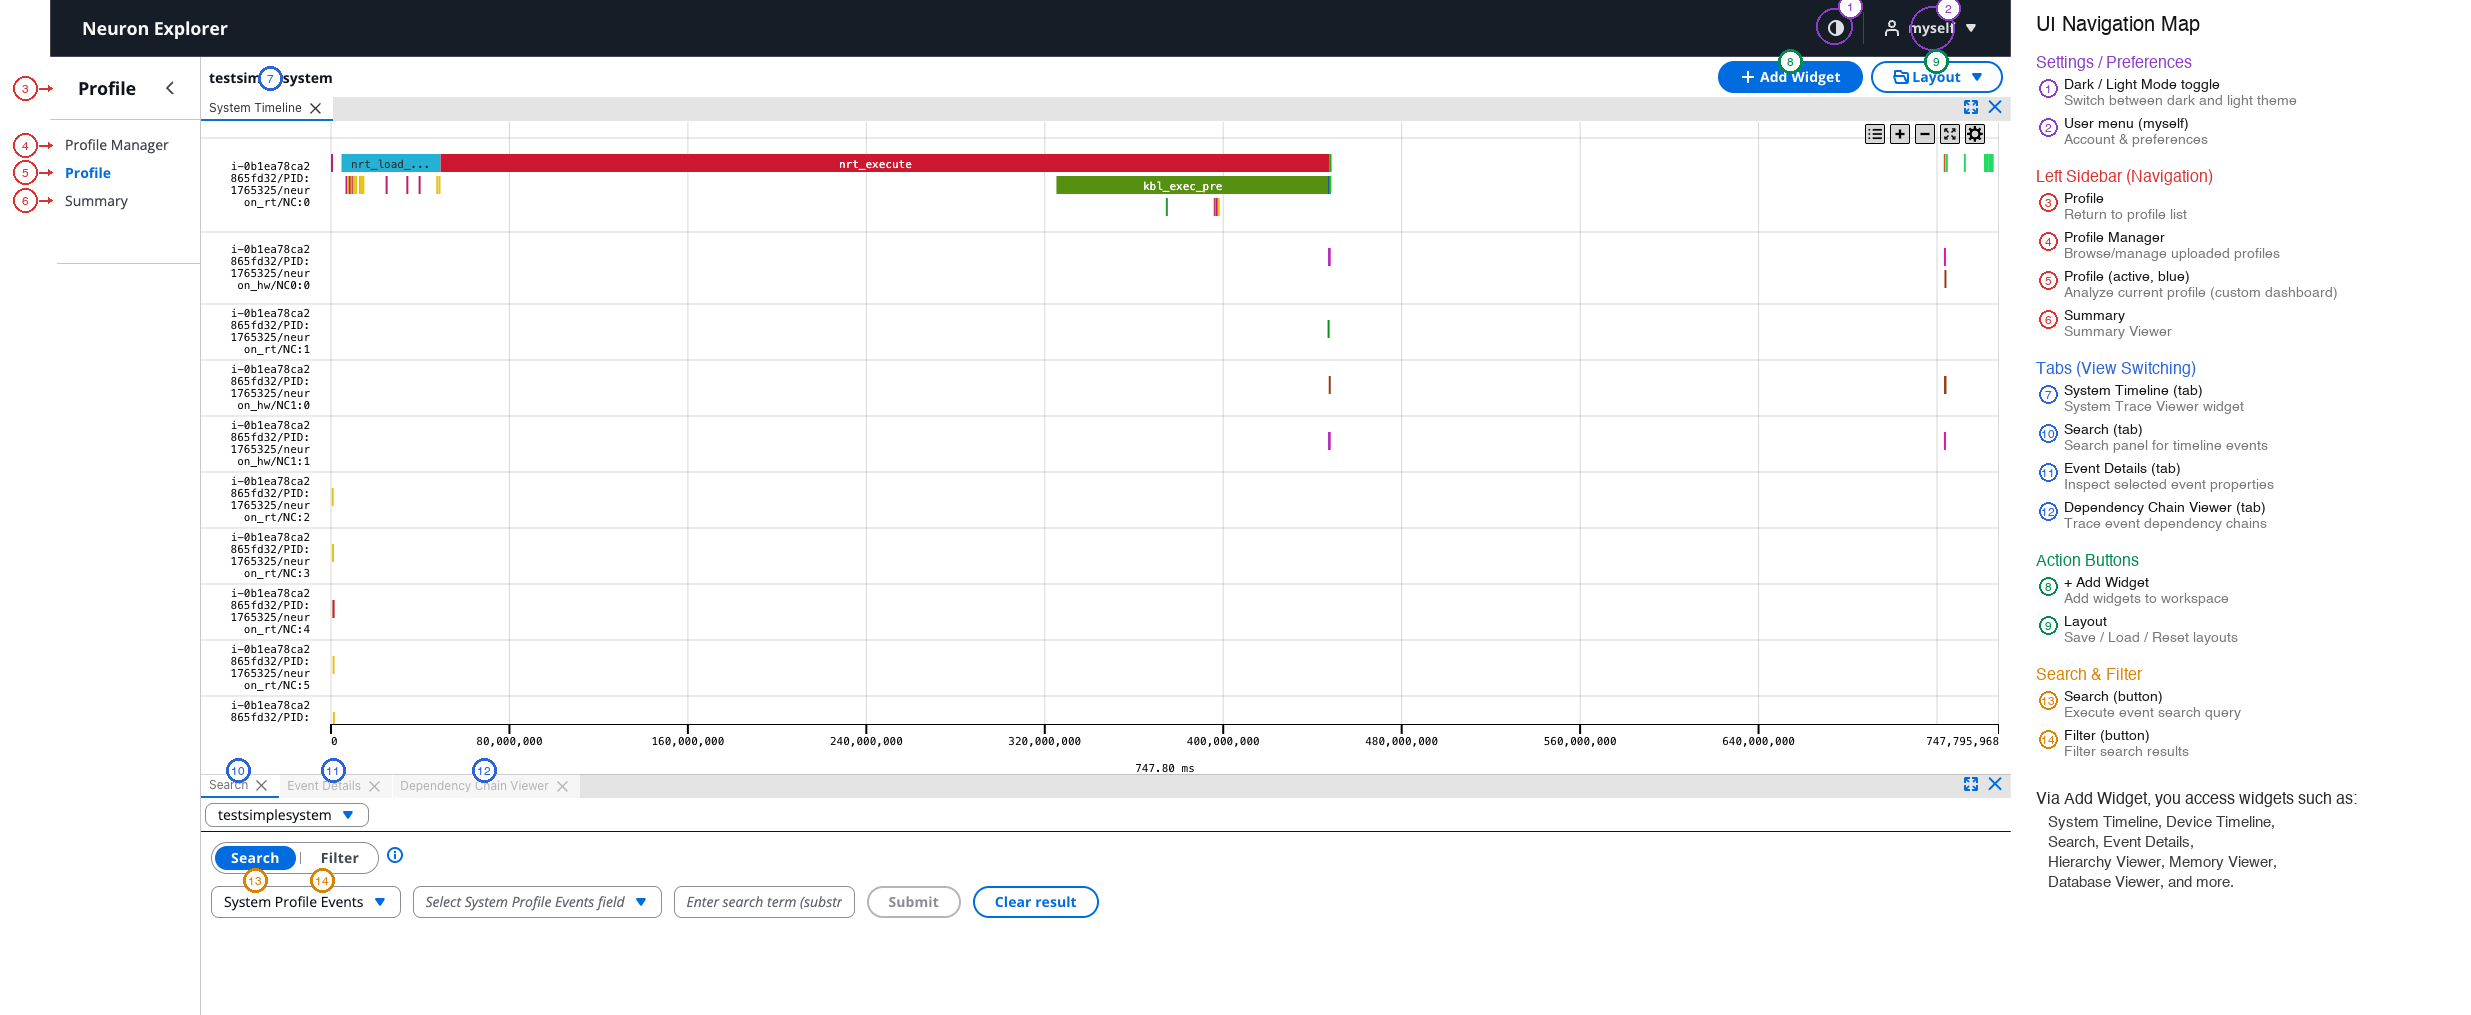
Click the image to enlarge.
Performance overview and triage#
Start with these viewers when you open a profile for the first time. They give you a high-level picture before you drill into details.
Summary Viewer#
Shows key performance metrics (MFU, HFU, MBU, compute/memory utilization), performance insights with ranked recommendations, FLOP utilization breakdowns by engine, DMA utilization, memory bandwidth breakdown, collective operation durations, and NKI instruction coverage. Use it to quickly identify the top bottleneck and get actionable next steps.
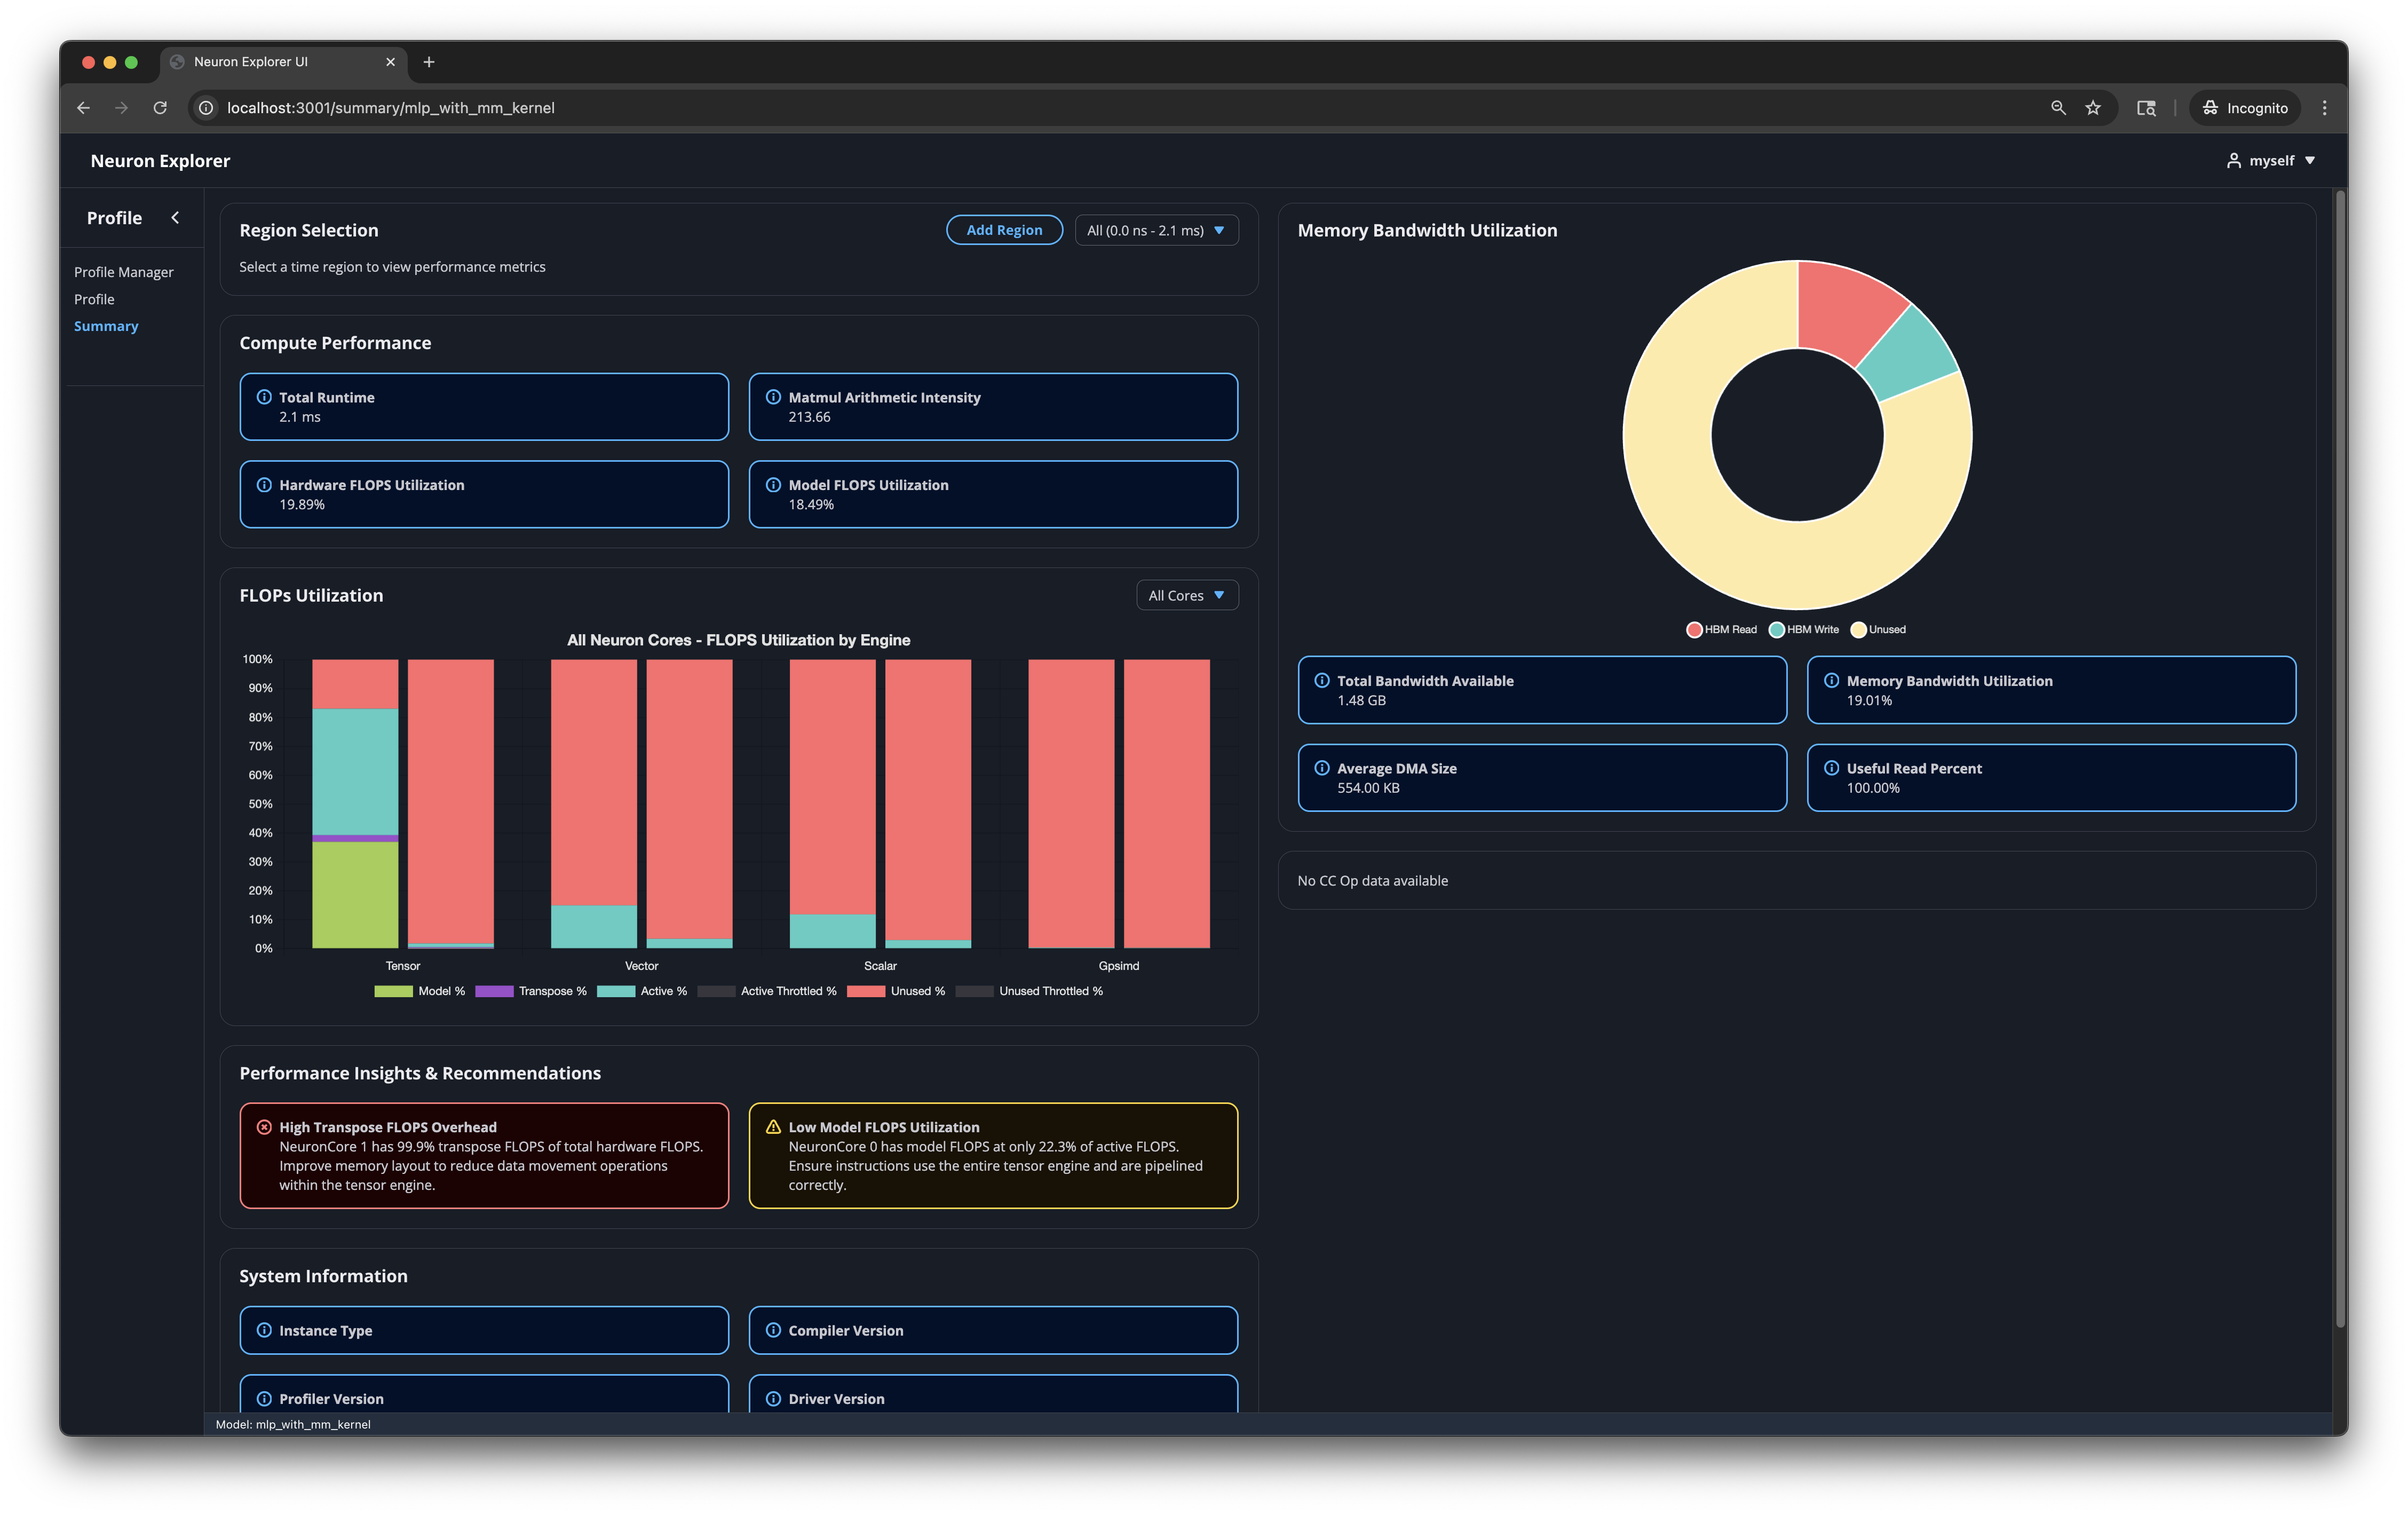
When to use: First thing after loading a profile — identify the top bottleneck and decide where to focus.
Learn more: Summary Viewer
Region Highlighter#
Automatically identifies and marks time regions in your profile based on collective operations, operation hierarchy, or kernel stack frames. The Summary Viewer then shows comparative metrics for each region so you can compare layers or kernels without placing manual annotations.
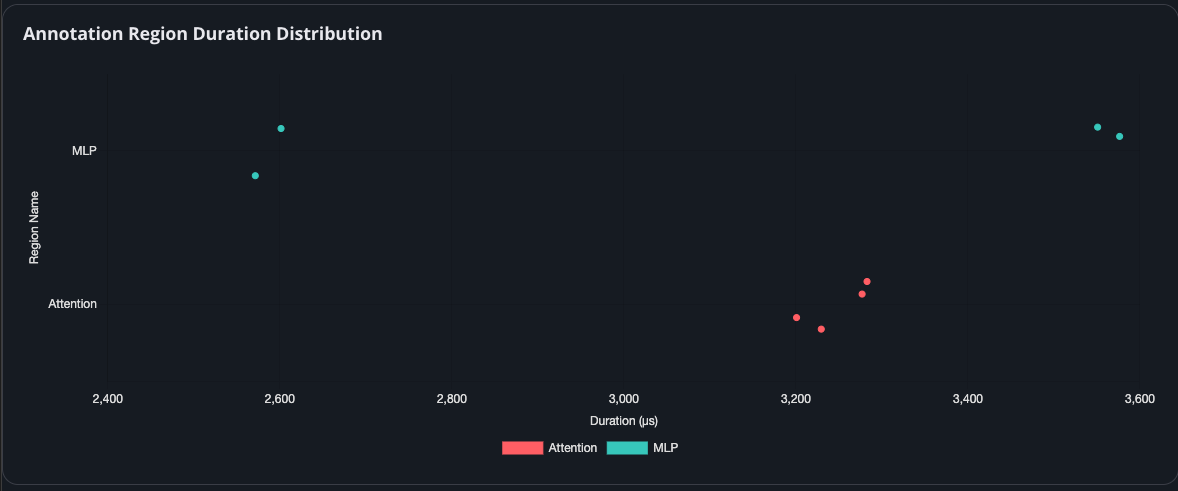
When to use: When you need to compare performance across model layers, kernels, or collective boundaries without manually annotating the timeline.
Learn more: Region Highlighter
AI Recommendation Viewer#
Provides AI-powered bottleneck analysis and optimization recommendations for NKI kernel profiles. Each report ranks 2–3 optimization opportunities by effort and impact, with quantified metrics, implementation guidance, and expected speedup. Requires Amazon Bedrock (opt-in, billed to your account).
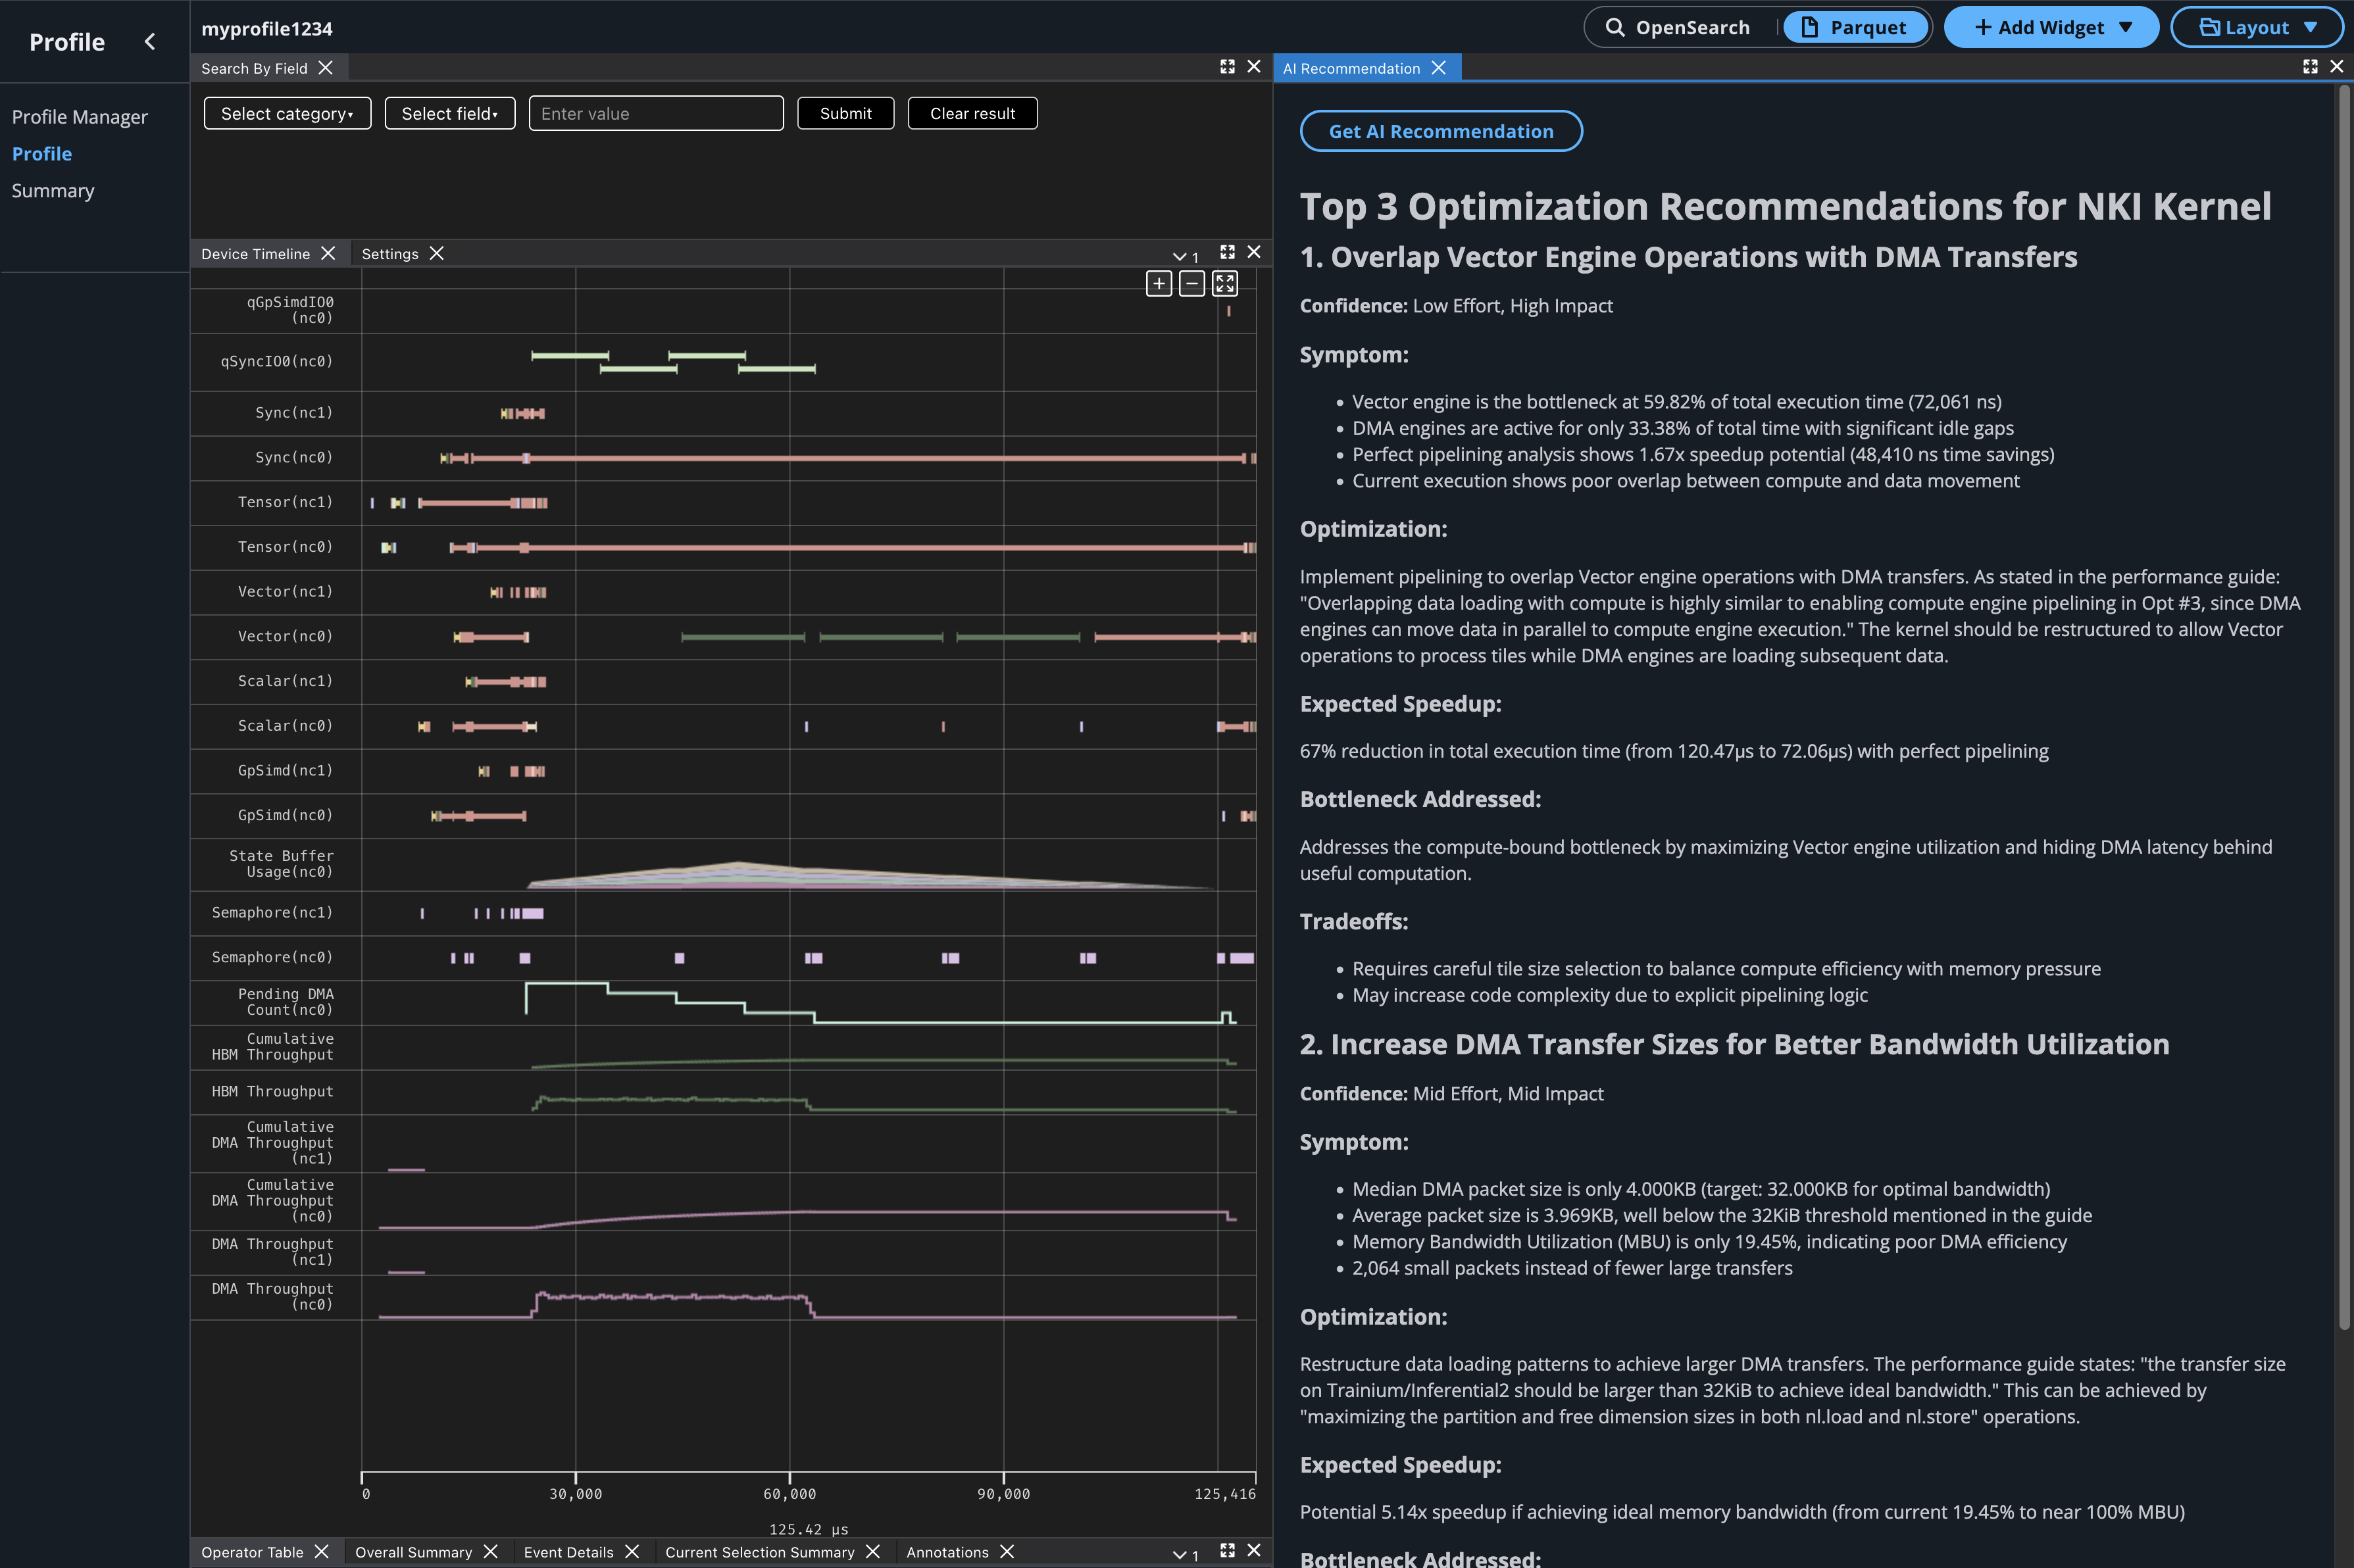
When to use: After profiling an NKI kernel — get specific optimization suggestions without deep manual analysis.
Learn more: AI Recommendation Viewer
Timeline analysis#
Use these viewers to understand execution flow over time at both the hardware and system levels.
Device Trace Viewer#
Displays hardware instruction-level execution on a NeuronCore as an interactive timeline. Shows compute engine instructions, DMA operations, HFU/memory utilization over time. Supports hover details, color-coding by PyTorch operator, panning, and zooming. The core viewer for device-level performance analysis.
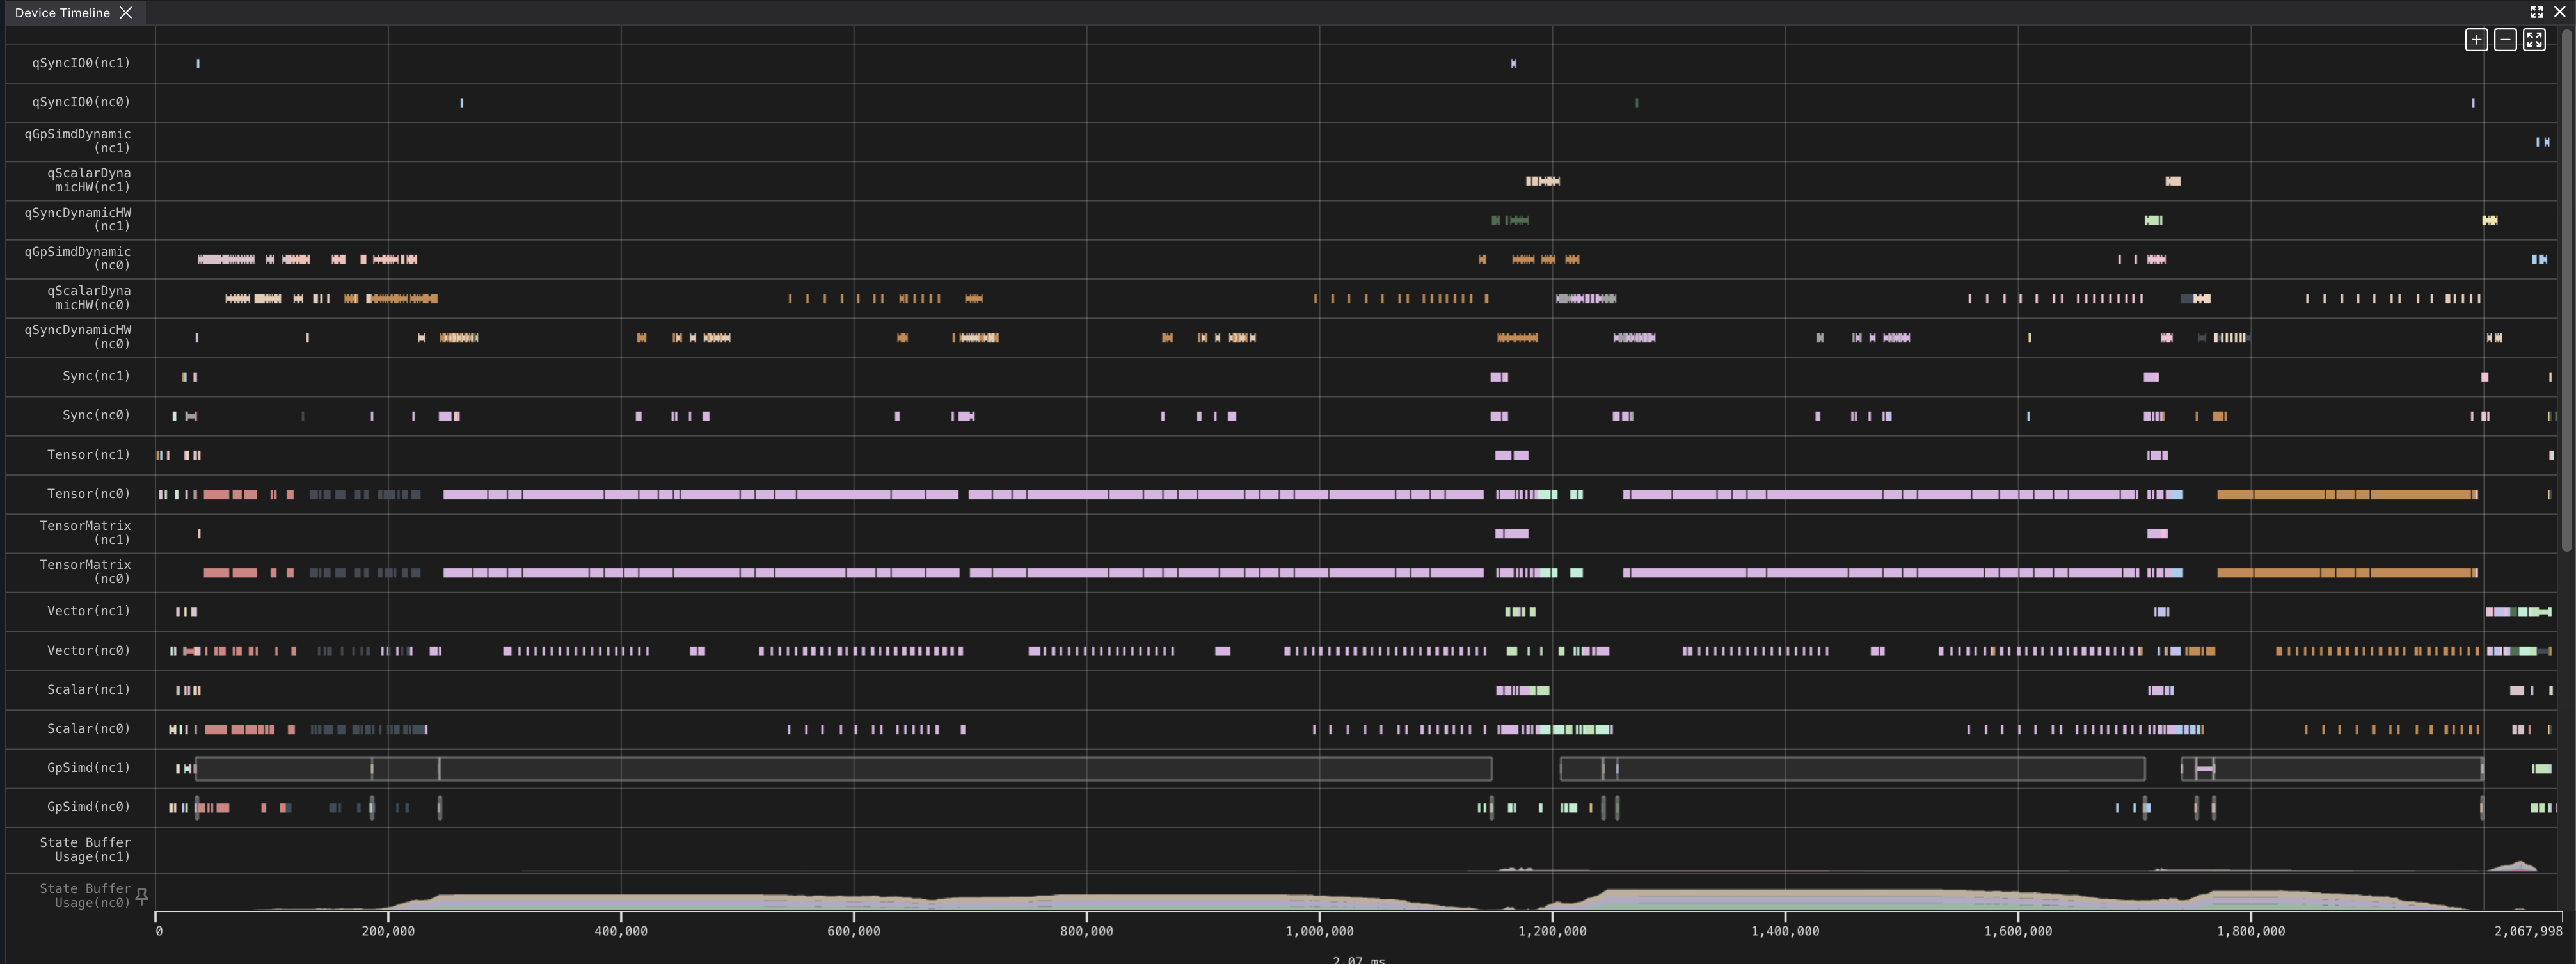
When to use: Investigate hardware-level behavior — identify stalls, DMA/compute overlap, and instruction-level bottlenecks.
Learn more: Device Trace Viewer
System Trace Viewer#
Shows system-level execution across instances and workers — Neuron Runtime API calls,
framework function calls (PyTorch/JAX), host-device transfers, and HBM memory usage
over time. Supports multiple grouping modes (CPU vs Device, NeuronCore, Thread,
Process, Instance) and links nc_exec_running events to the Device Trace Viewer.
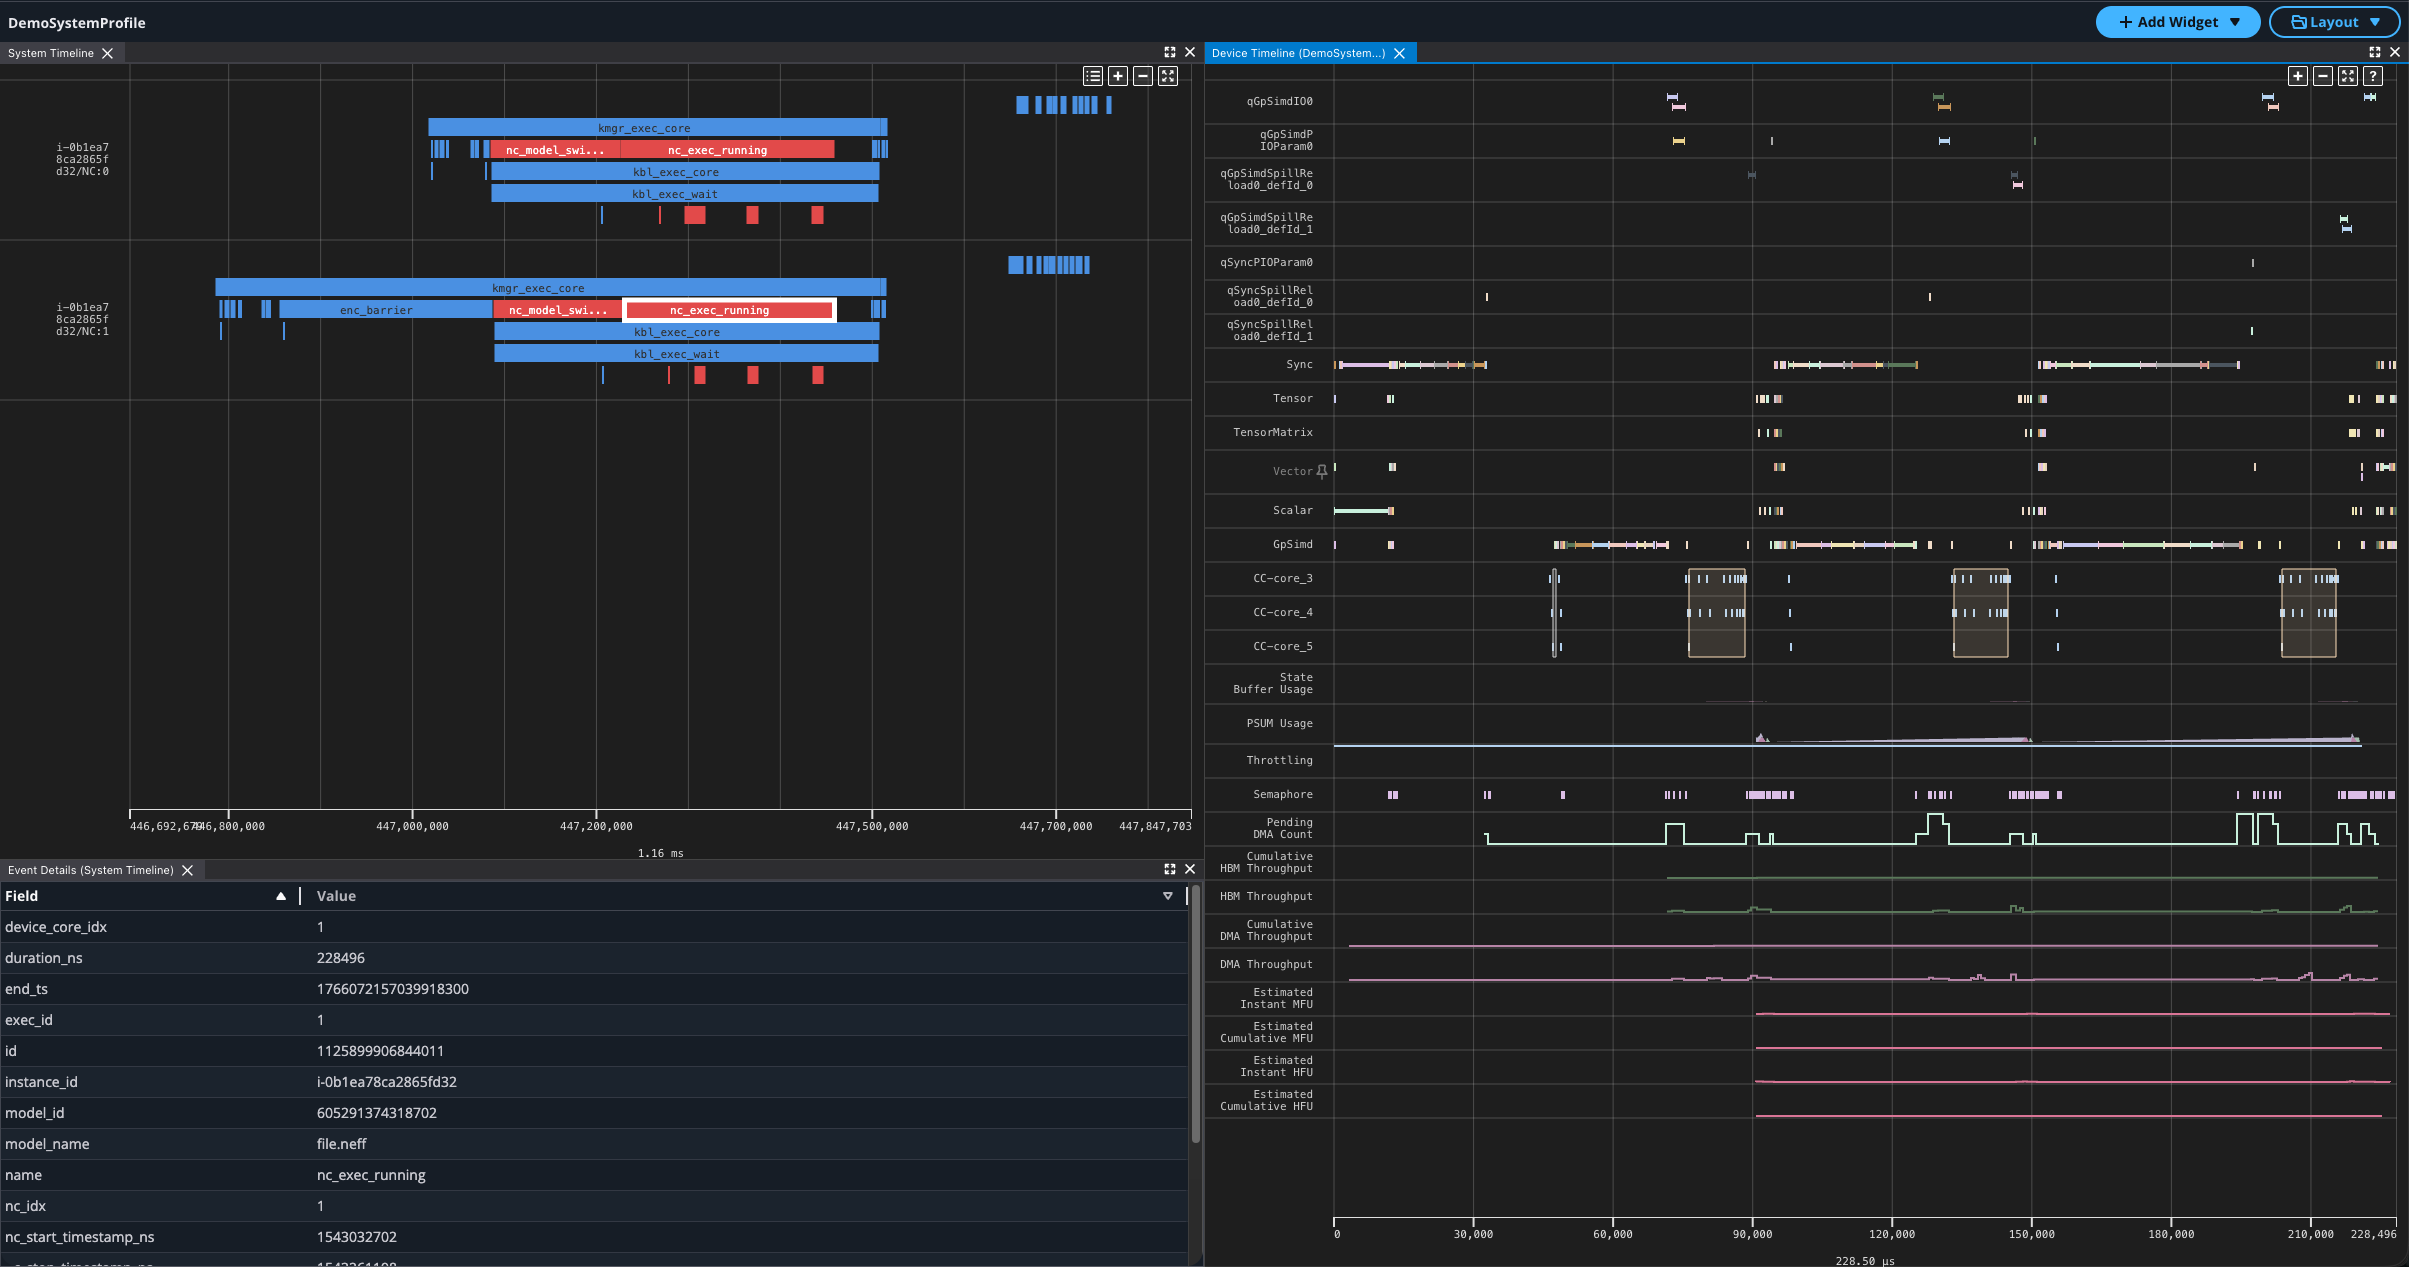
When to use: Investigate distributed workload behavior, host-device data transfer bottlenecks, or framework overhead.
Learn more: System Profile
Hierarchy Viewer#
Displays execution organized by framework layers and HLO operations. You can progressively drill down from model-level constructs to hardware instructions. Right-click an operator to highlight its corresponding instructions in the Device Trace Viewer.
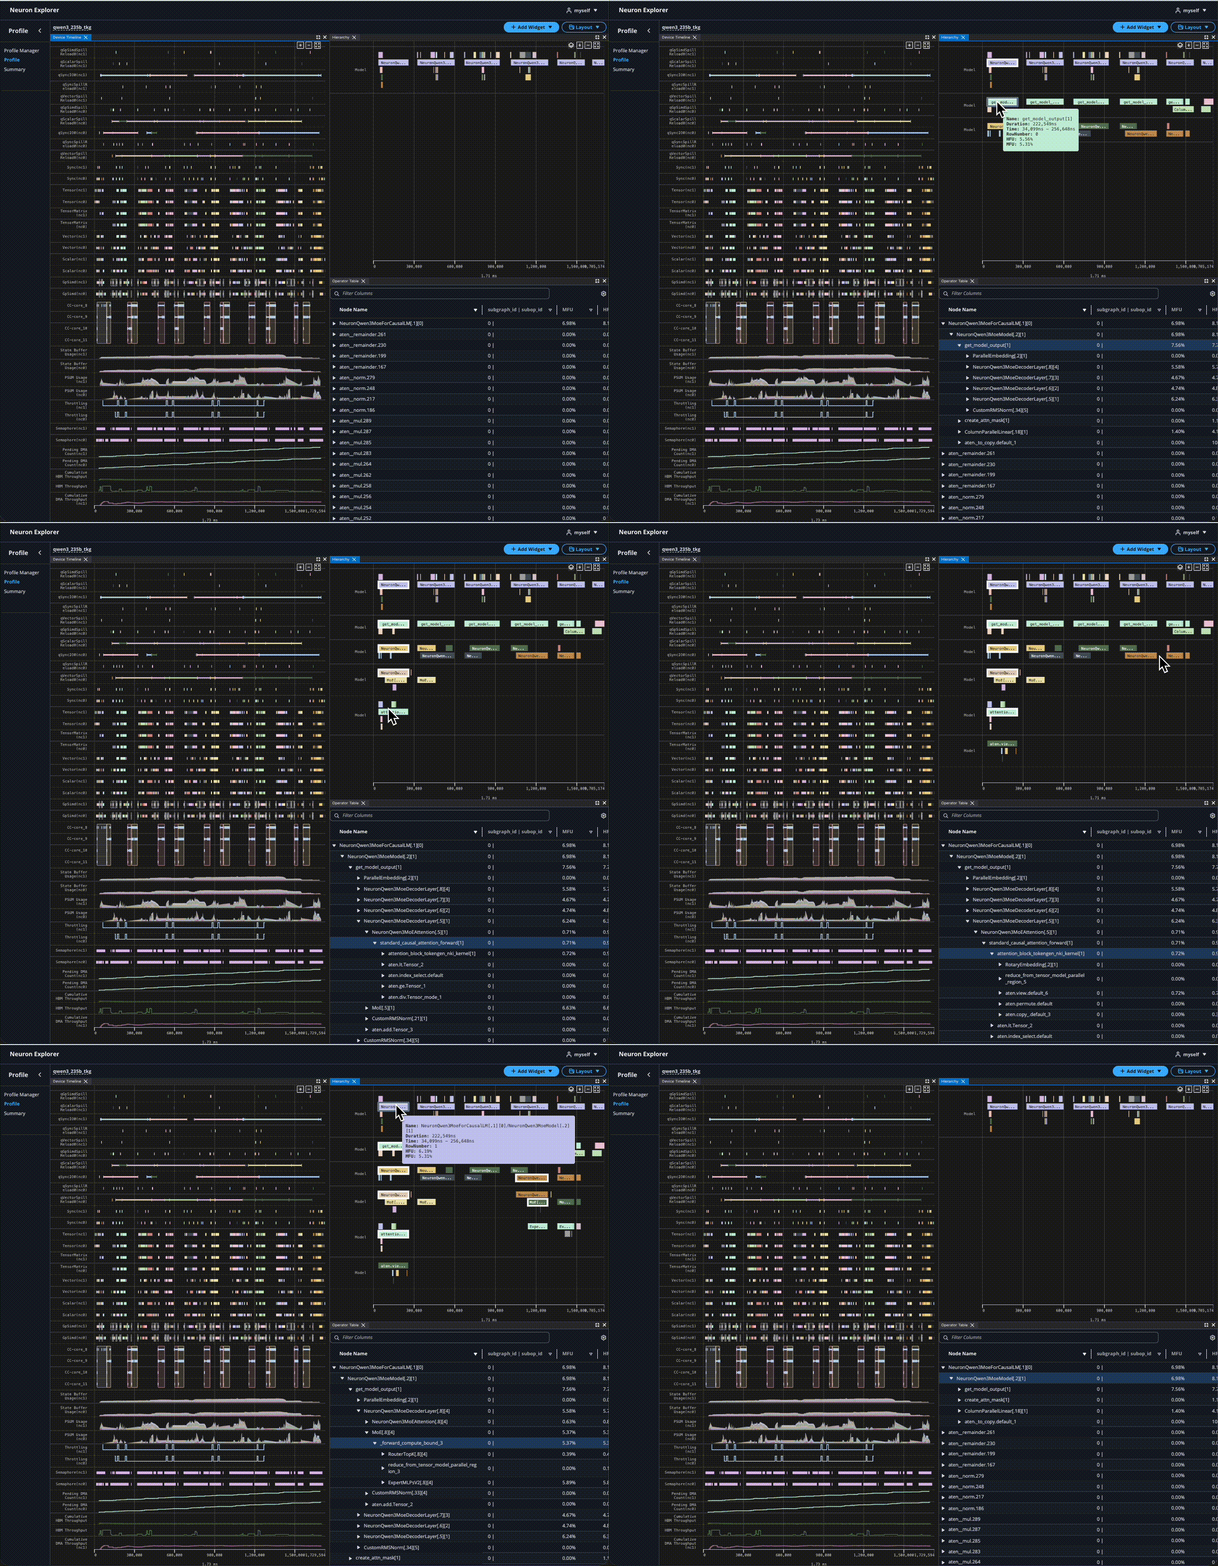
When to use: Map high-level model operations to their hardware execution — find which layer or operator is responsible for a performance issue.
Learn more: Hierarchy Viewer
Dependency Chain Viewer#
Navigates the dependency chain between system profile events. Click a system event to see arrows showing upstream/downstream dependencies — from framework calls through runtime to hardware execution. Part of the System Trace Viewer.
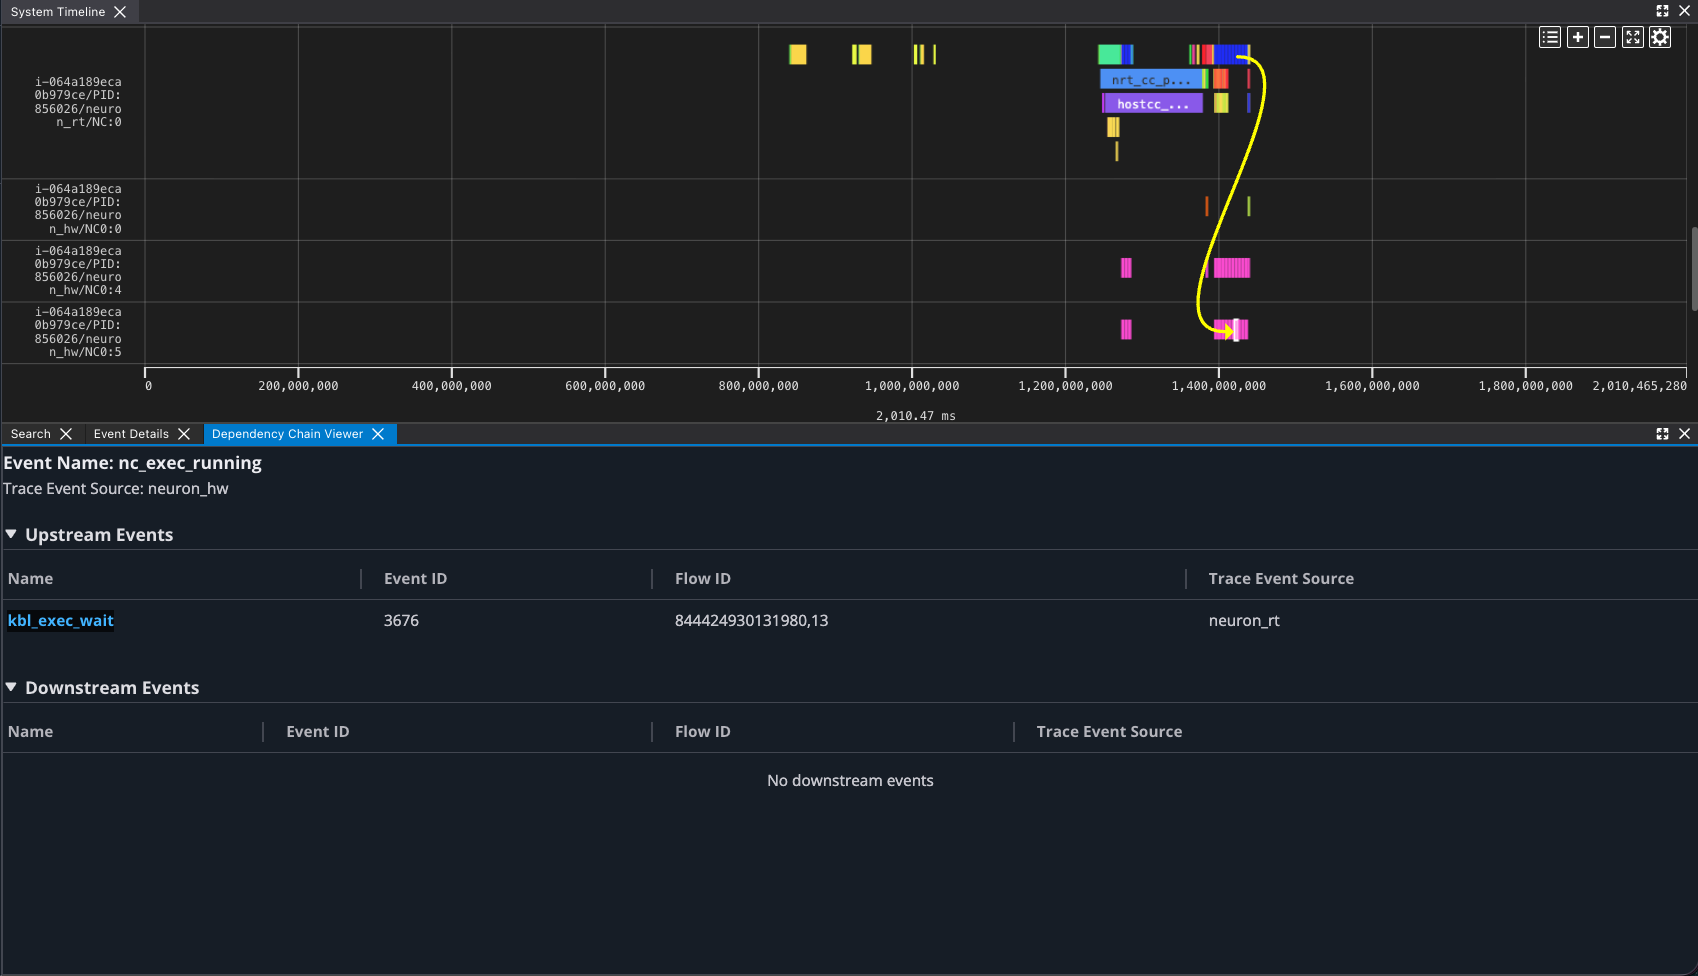
When to use: Trace the causal chain of a slow event — understand what triggered it and what it blocks.
Learn more: System Profile (Dependency Chain Viewer section)
Data inspection and querying#
Use these viewers to examine specific data — tensors, memory, or raw tables — in detail.
Tensor Viewer#
Lists all tensors in the NEFF file with their names, types (input/output/weight), shapes, sizes, and SBUF loading statistics (DMA count, repeat factor, average/total bytes). Enter a tensor name in the search bar to find all related DMA instructions in the Device Trace Viewer.

When to use: Verify tensors are loaded efficiently, find specific tensor DMA patterns, or cross-reference tensor names with device-level operations.
Learn more: Tensor Viewer
Memory Viewer#
Visualizes memory allocation patterns across SBUF partitions over time. Hover over allocations to see timing, addresses, opcodes, and DMA queue info. Use it to identify memory fragmentation and spill/reload opportunities.
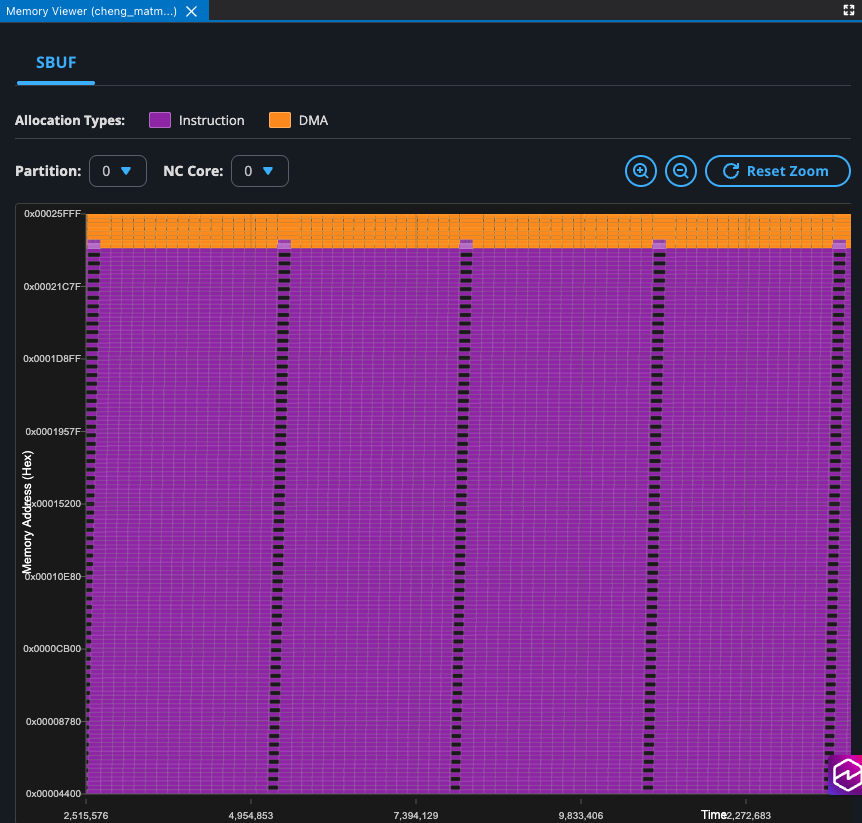
When to use: Debug memory fragmentation, analyze spill/reload patterns, or verify memory compactness for NKI kernel optimization.
Learn more: Memory Viewer
Code correlation#
Use these viewers to link profiling data back to your source code.
Source Code Viewer#
Links NKI/PyTorch source code and hardware instructions bidirectionally:
In the Device Trace Viewer, Ctrl+click an event to open the Source Code Viewer at the corresponding source line.
In the Source Code Viewer, click a line of code to highlight all linked events in the Device Trace Viewer.
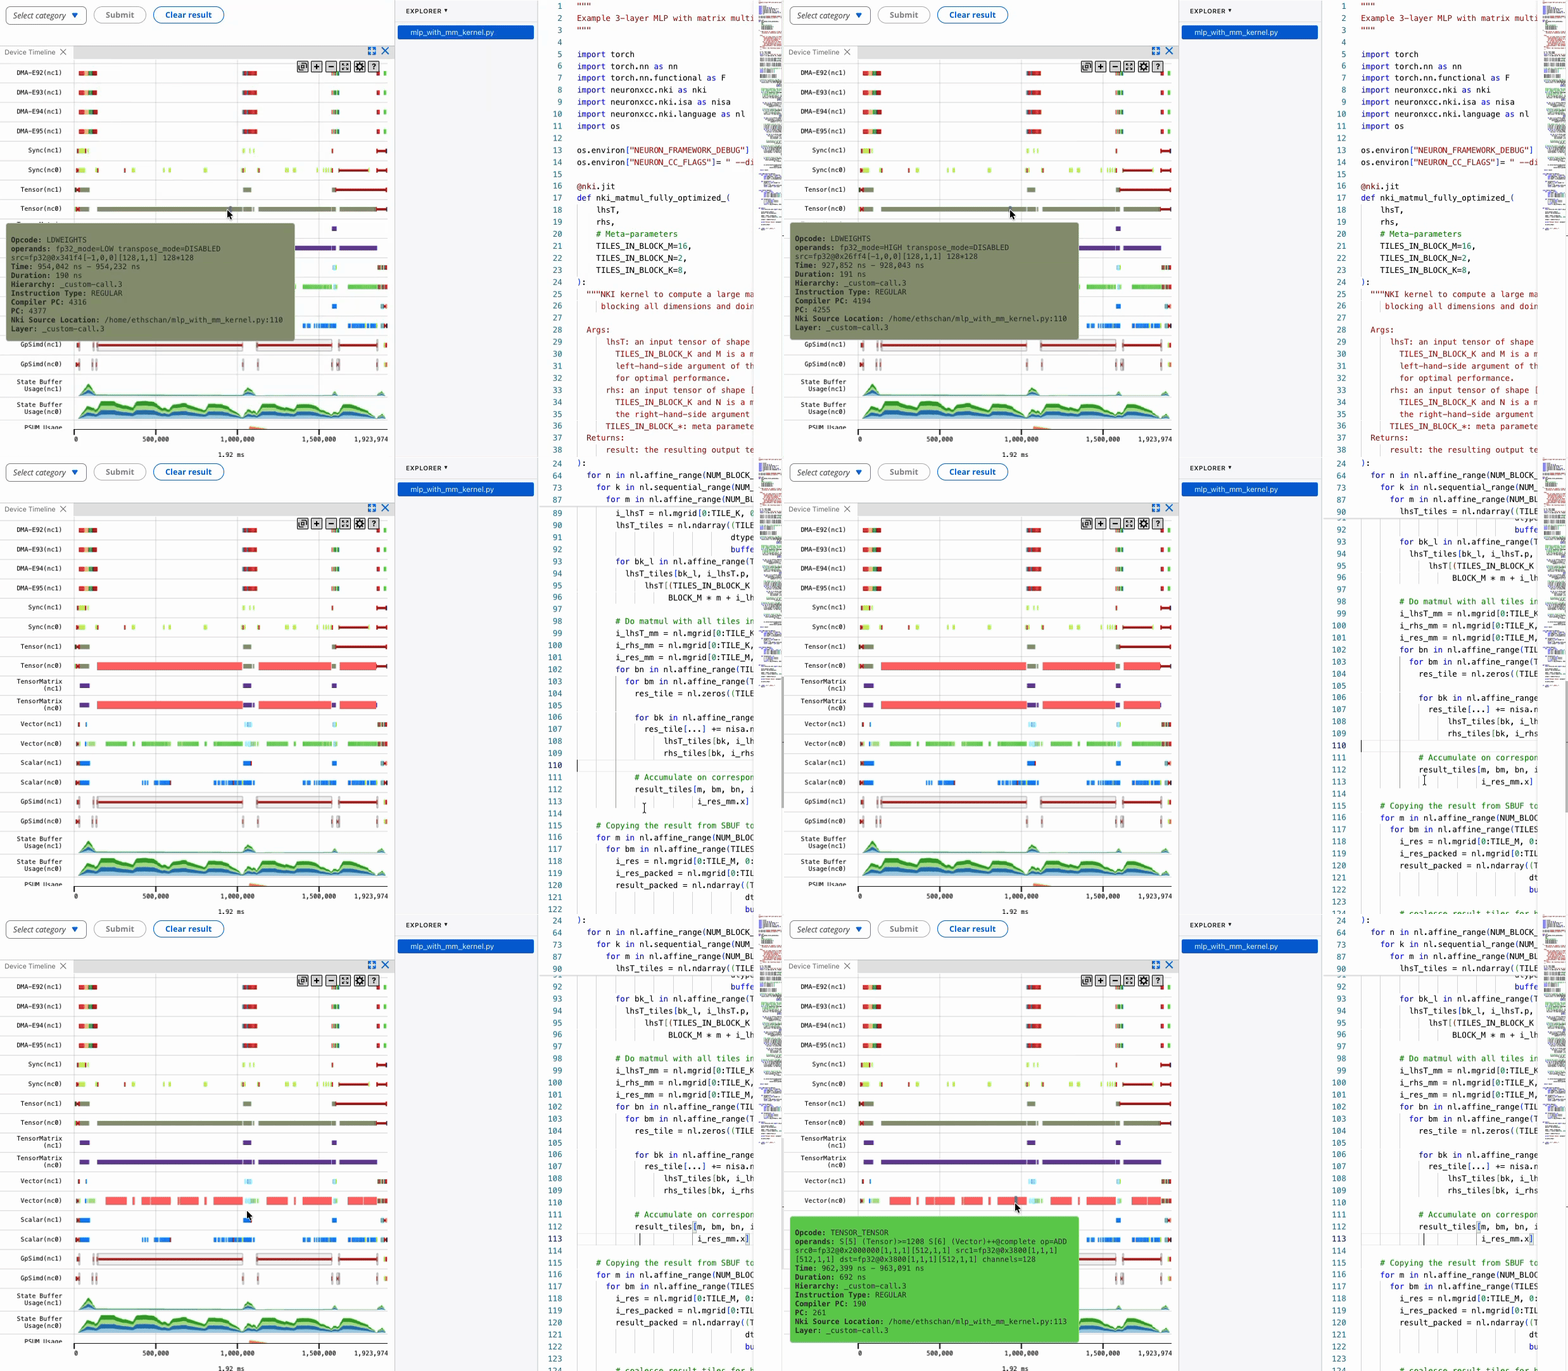
When to use: Trace a performance issue back to the exact source code line, or find the hardware behavior of a specific code region.
Learn more: Source Code Viewer
Measurement and comparison#
Use these tools to measure, annotate, and compare specific regions of a profile.
Annotations#
Right-click the Device Trace Viewer to place annotation markers. Annotations snap to events and display time differences and summary metrics between any two markers. You can save and load annotations for collaboration.
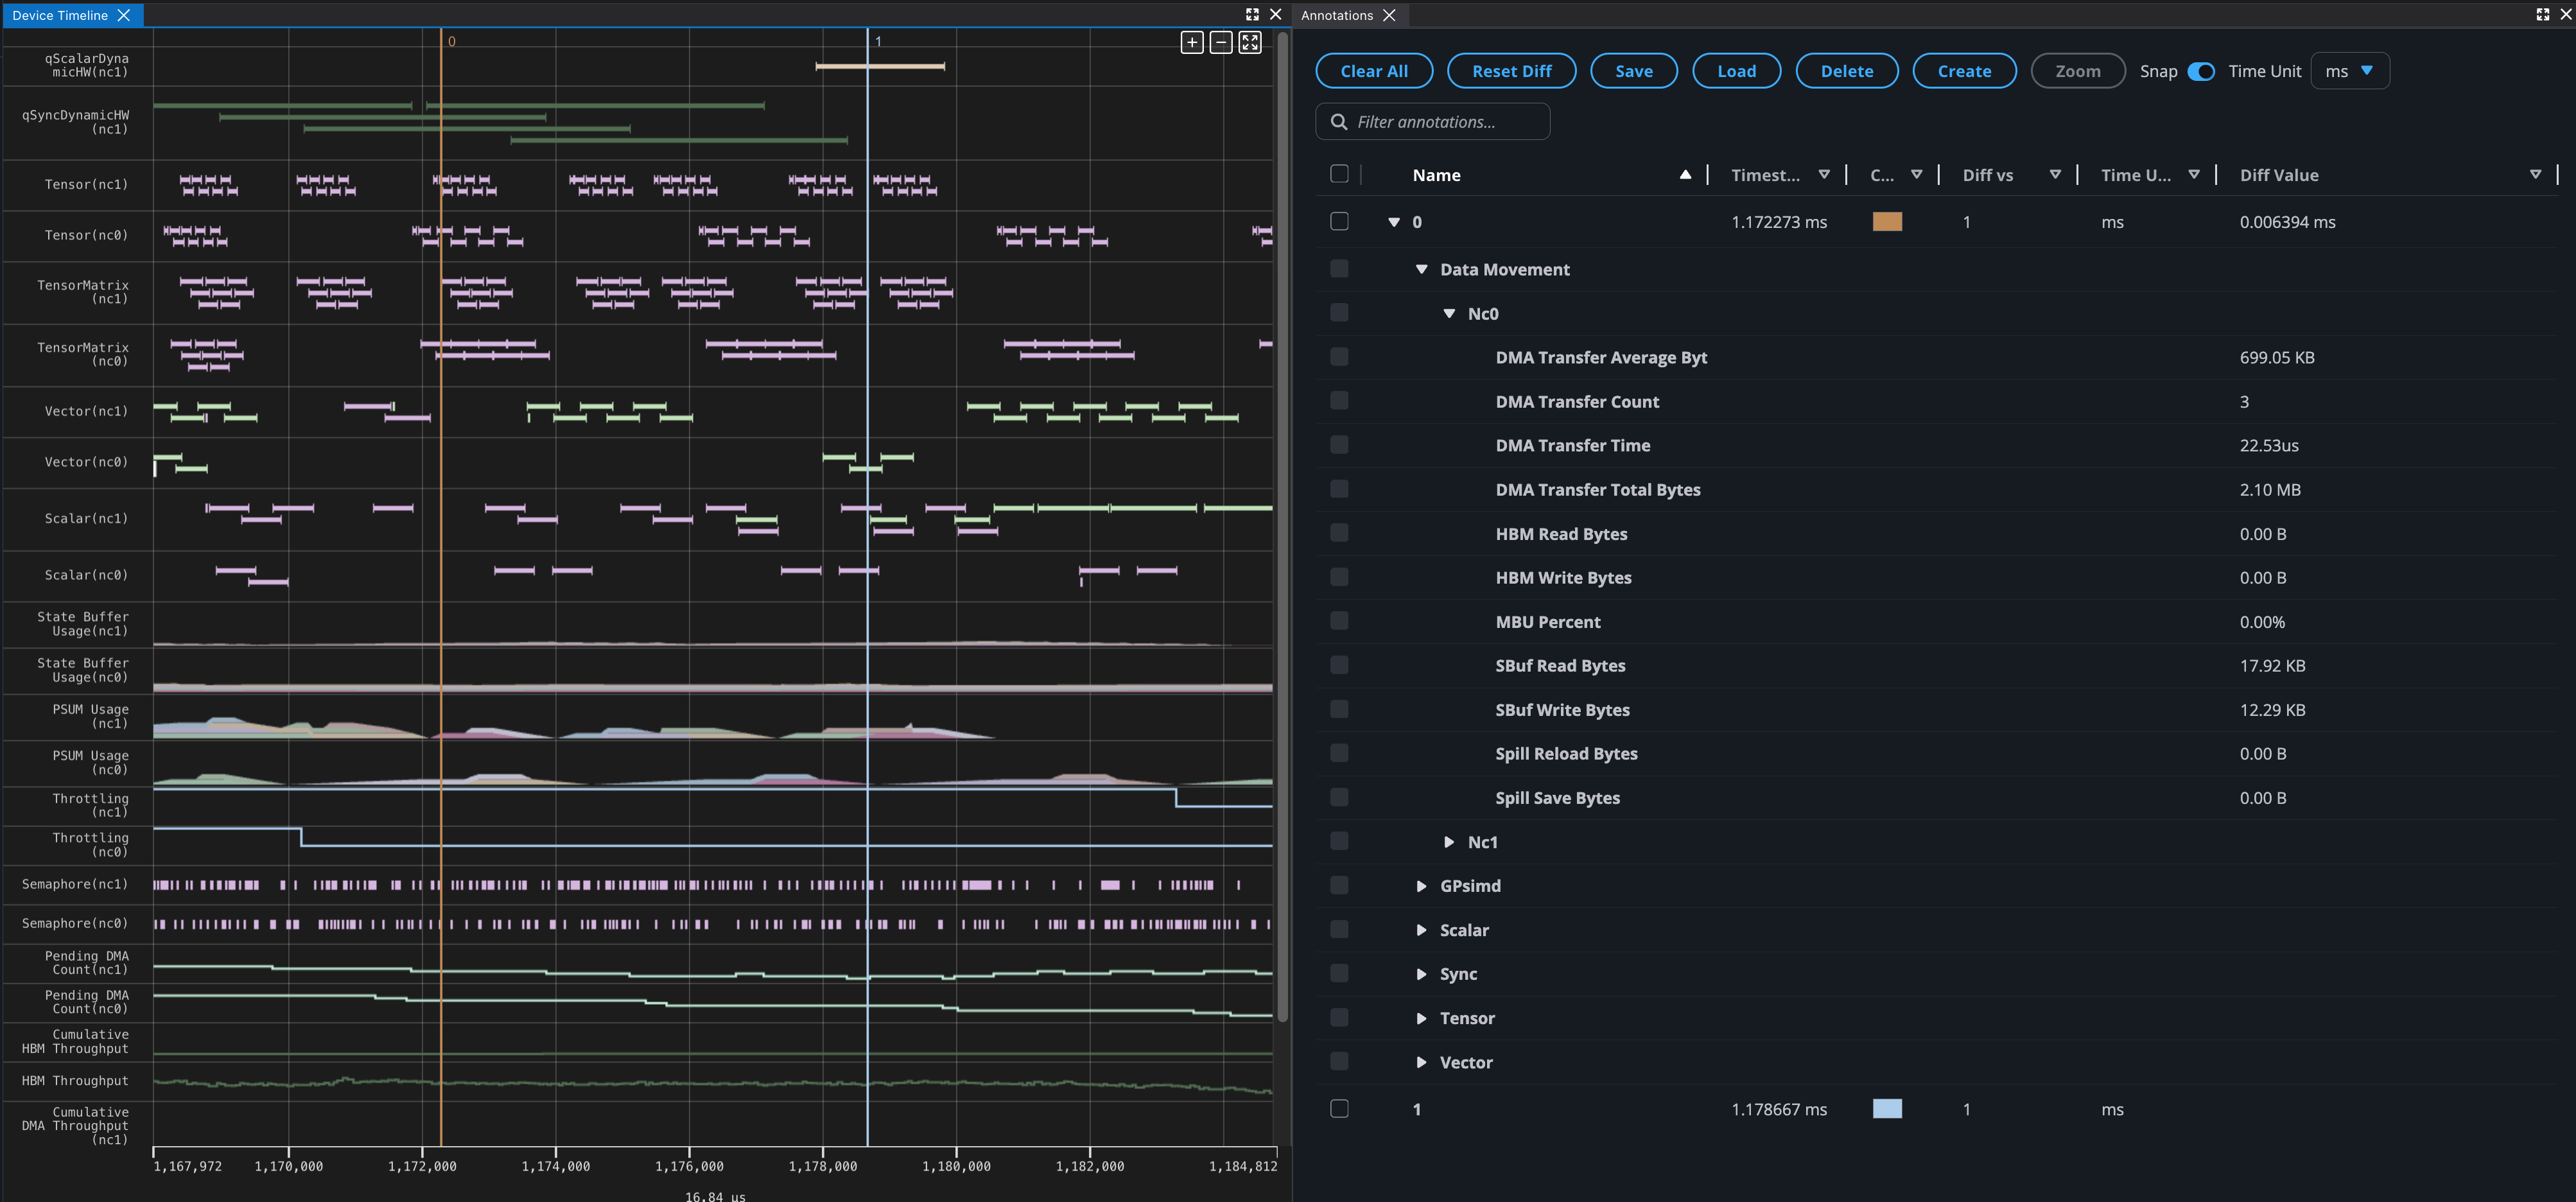
When to use: Mark specific regions for measurement, compare before/after, or share specific profile views with teammates.
Learn more: Device Trace Viewer (Annotations section)
Operator Table#
Aggregates hardware metrics into framework layers and operations (MFU, data movement). Expand rows to drill into nested operators. You can sort and filter columns for streamlined viewing.
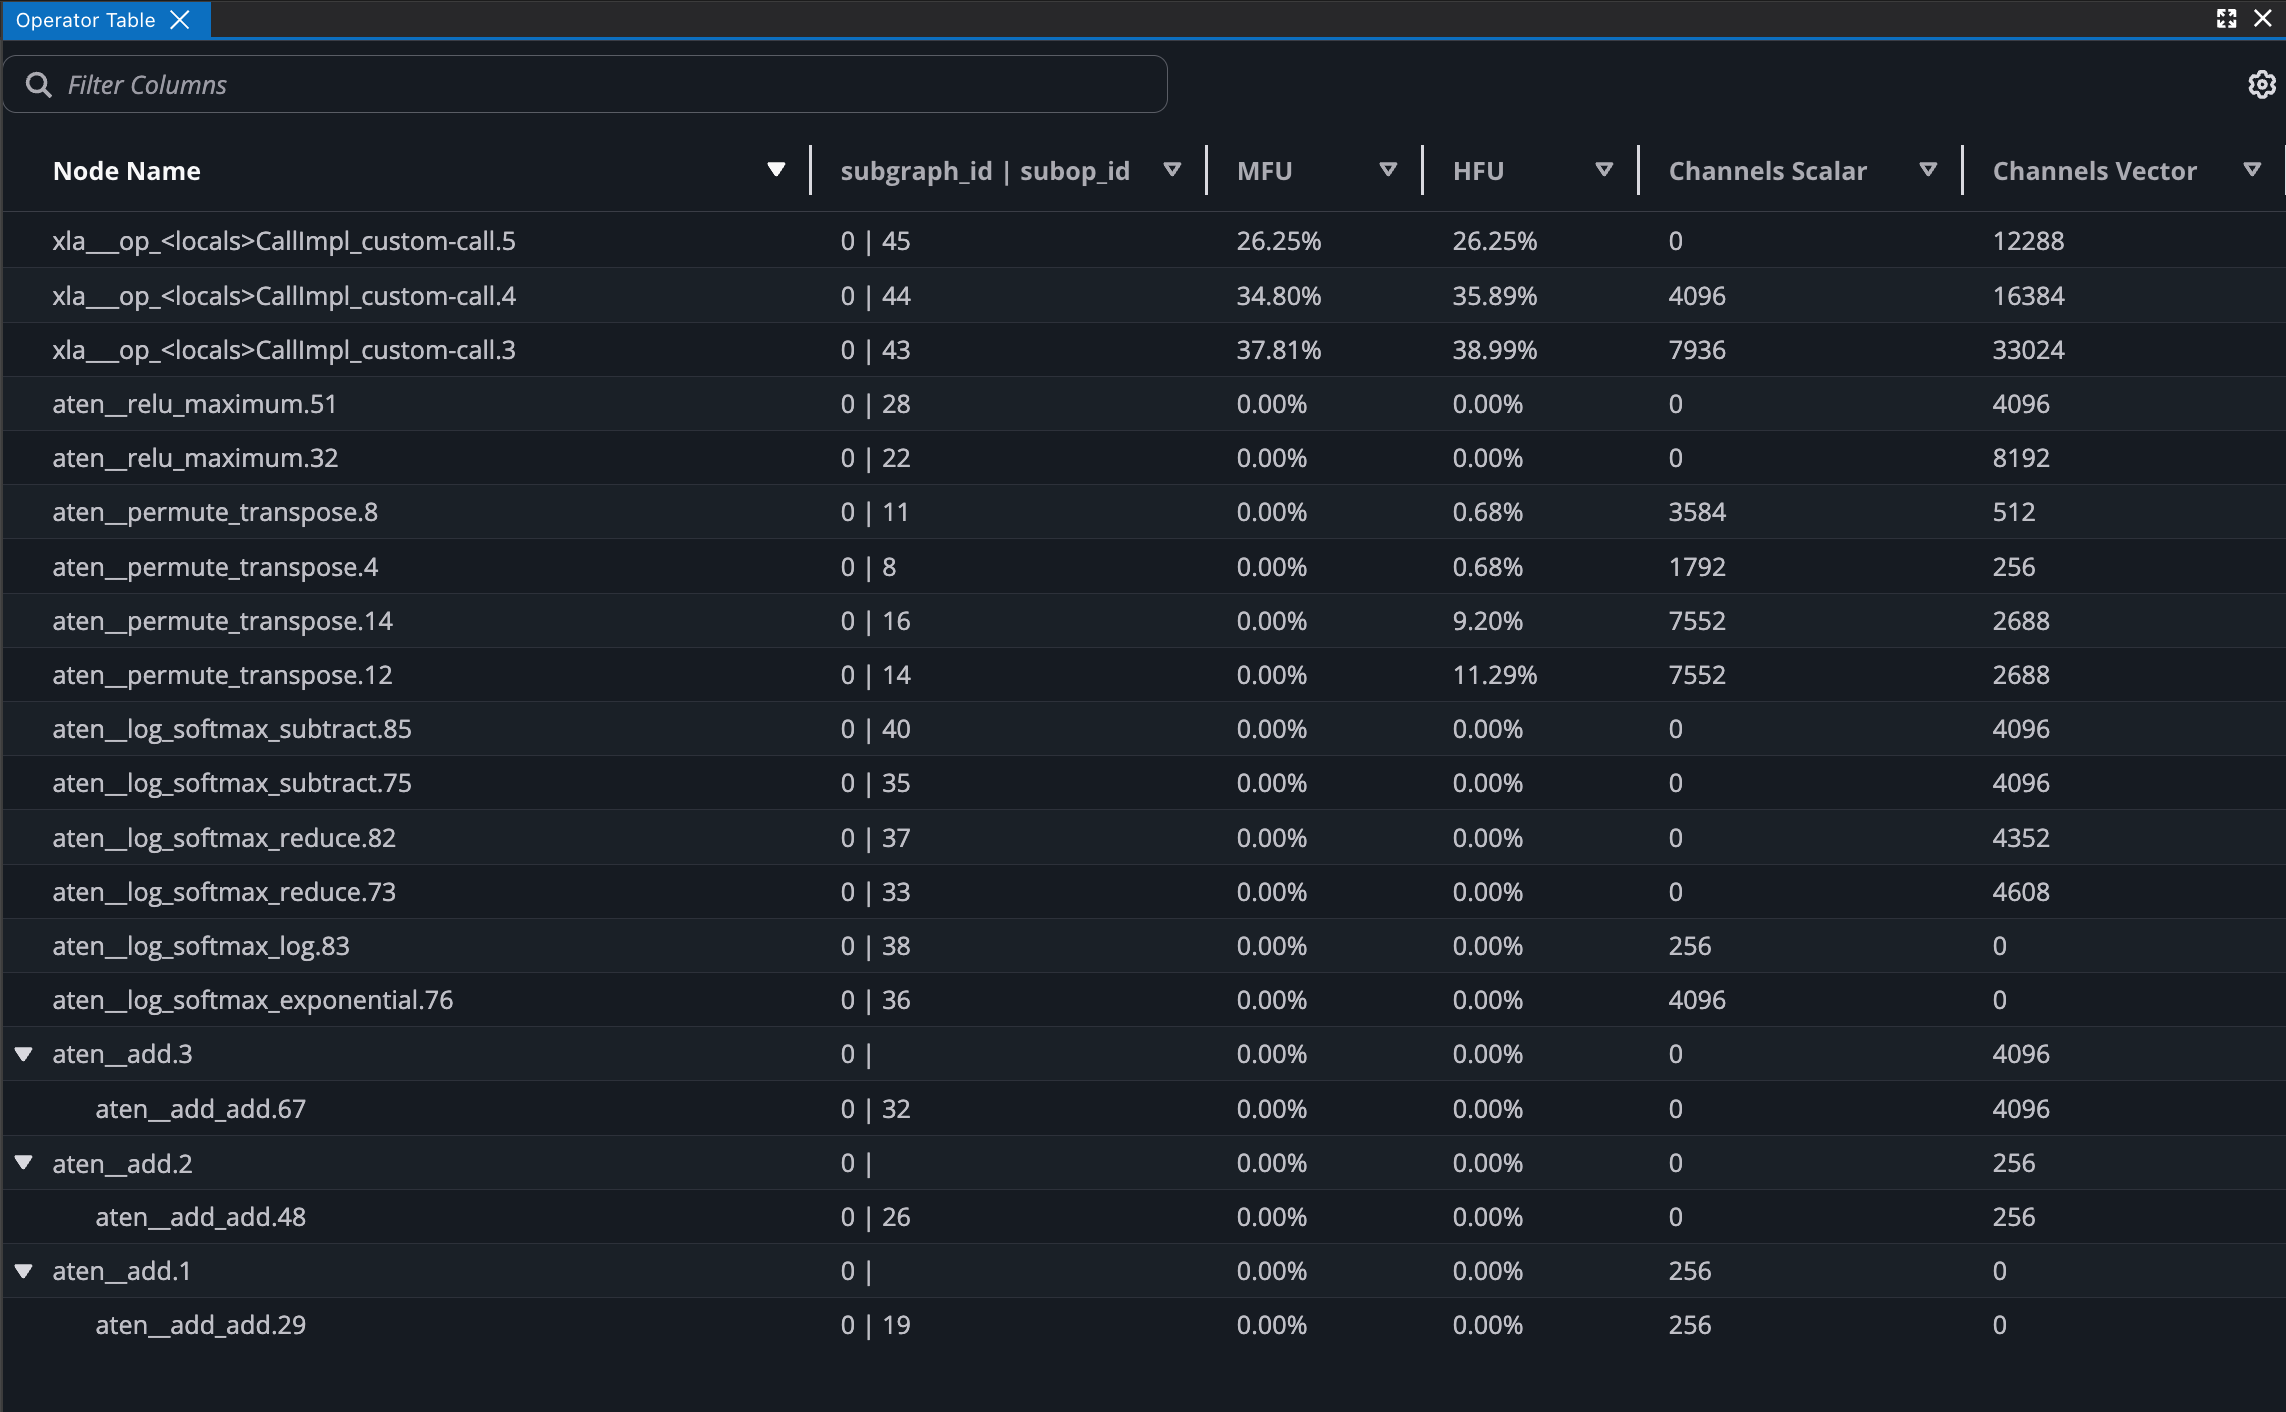
When to use: Compare per-operator performance metrics across your model’s layers without manually selecting timeline regions.
Learn more: Device Trace Viewer (Operator Table section)
Workspace and layout#
Customize your profiling workflow with these features.
Layout customization#
Add widgets to your workspace — drag, resize, and arrange them freely. Widgets include the Device Trace Viewer, System Trace Viewer, Search, Event Details, and more. Save named layouts and reload them across profiles for a consistent workflow.
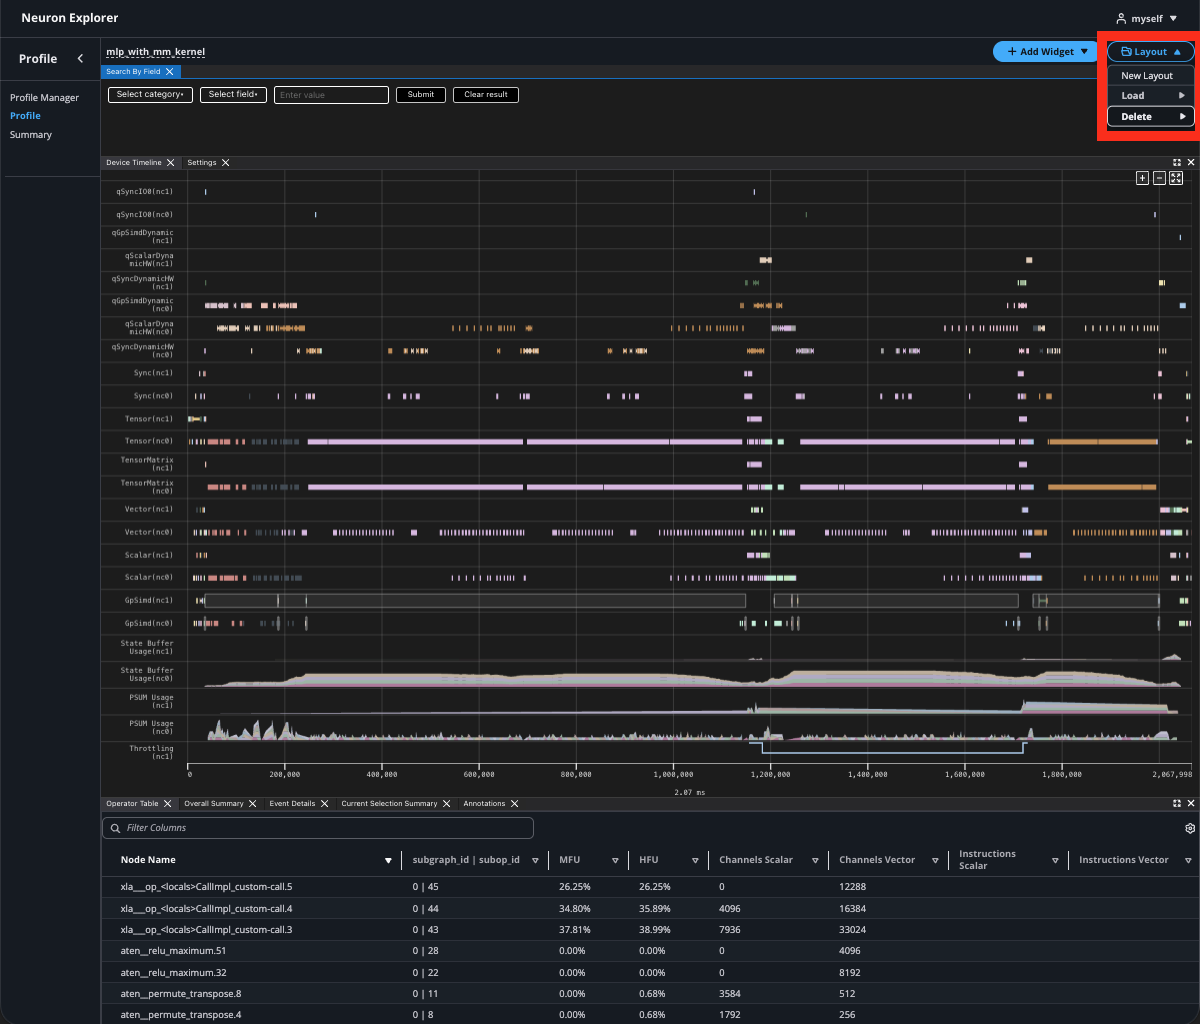
When to use: Set up your workspace once for a specific workflow (e.g., NKI debugging, distributed profiling) and reuse it.
Multi-profile analysis#
Add multiple widgets side by side in a profile page to create your own analysis dashboard. Each widget can show a different profile or data view. Use the profile dropdown to switch profiles within any widget.
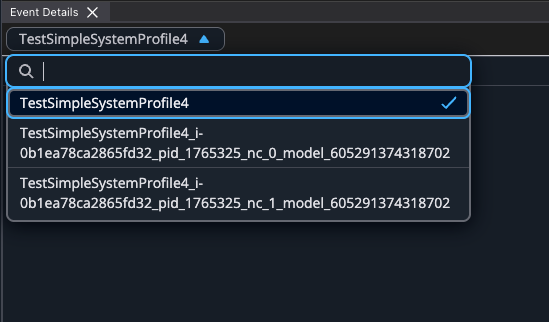
When to use: Compare execution across NeuronCores or instances in a distributed workload.
Dark and light mode#
Click the theme toggle in the top-right corner to switch between dark and light mode.
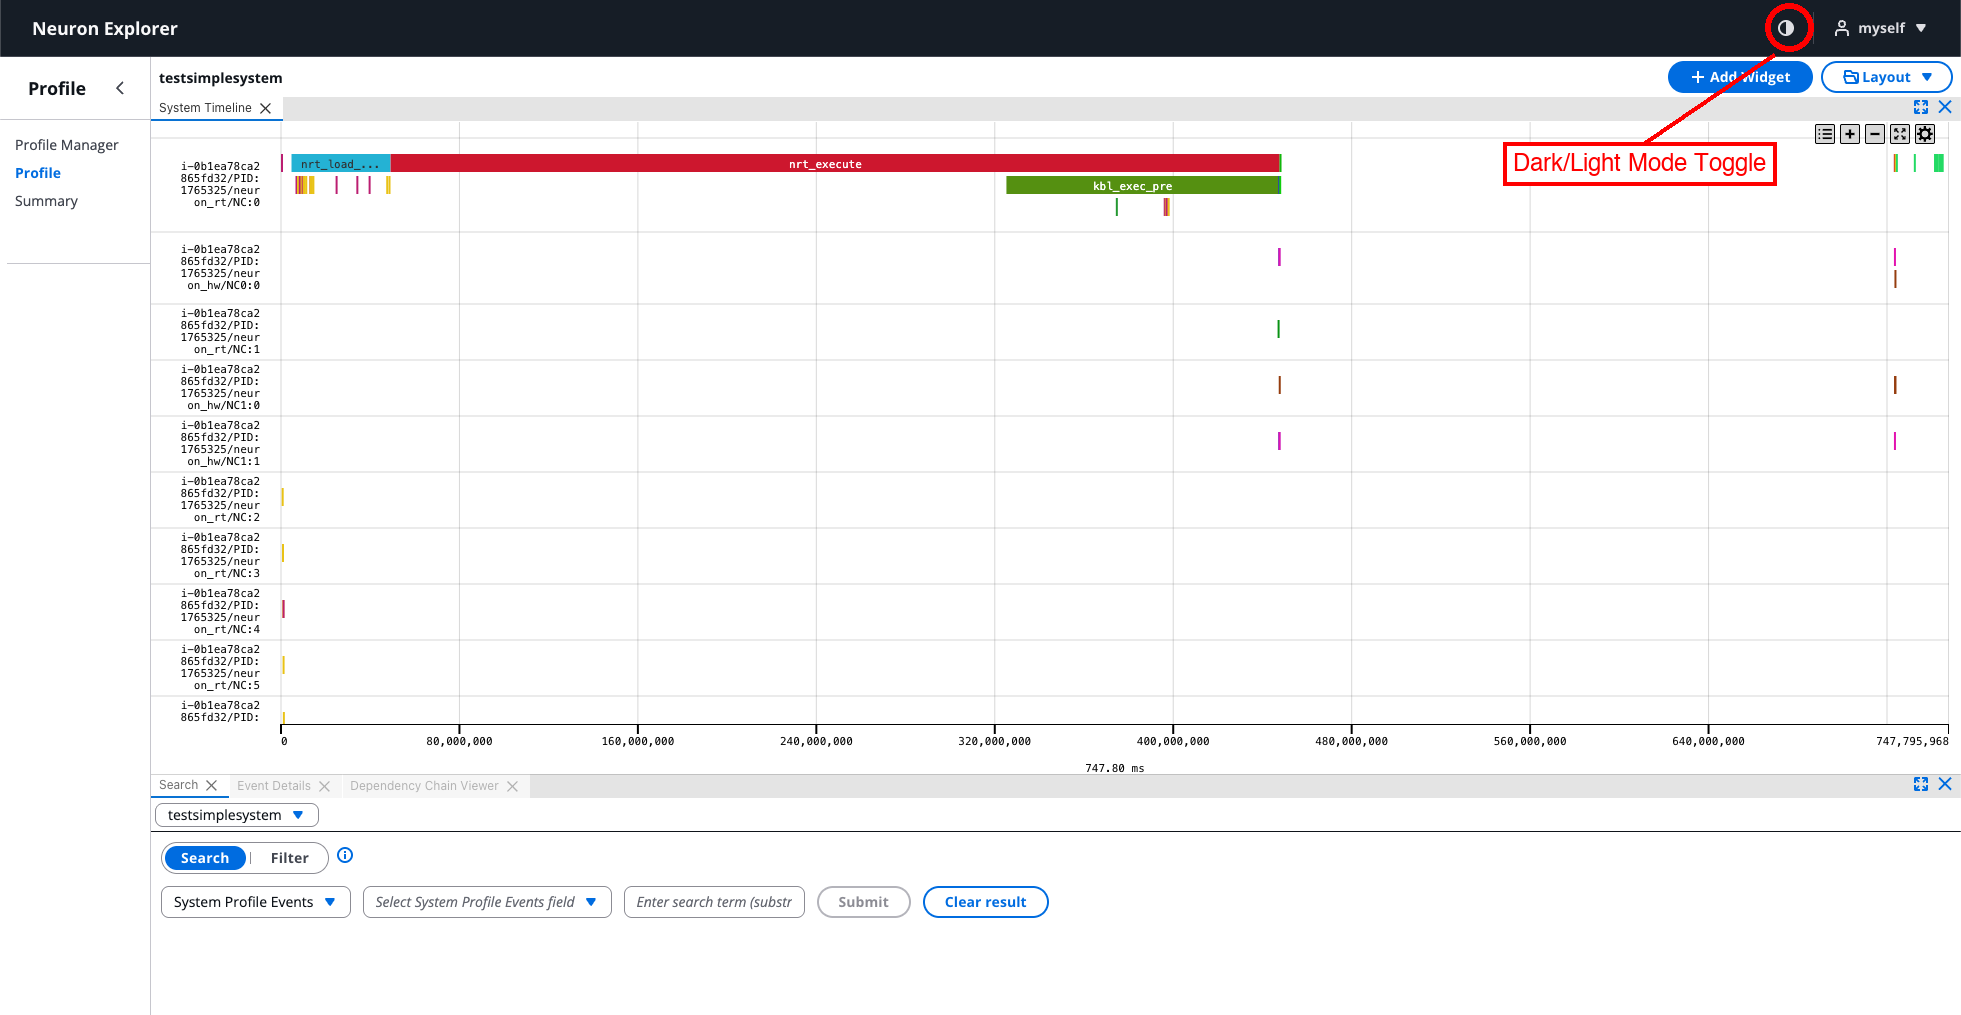
When to use: Personal preference, accessibility considerations, or matching your presentation theme in screenshots.
This document is relevant for: Inf2, Trn1, Trn2, Trn3