
This document is relevant for: Inf1, Inf2, Trn1, Trn2, Trn3
Neuron Monitor User Guide#
Overview#
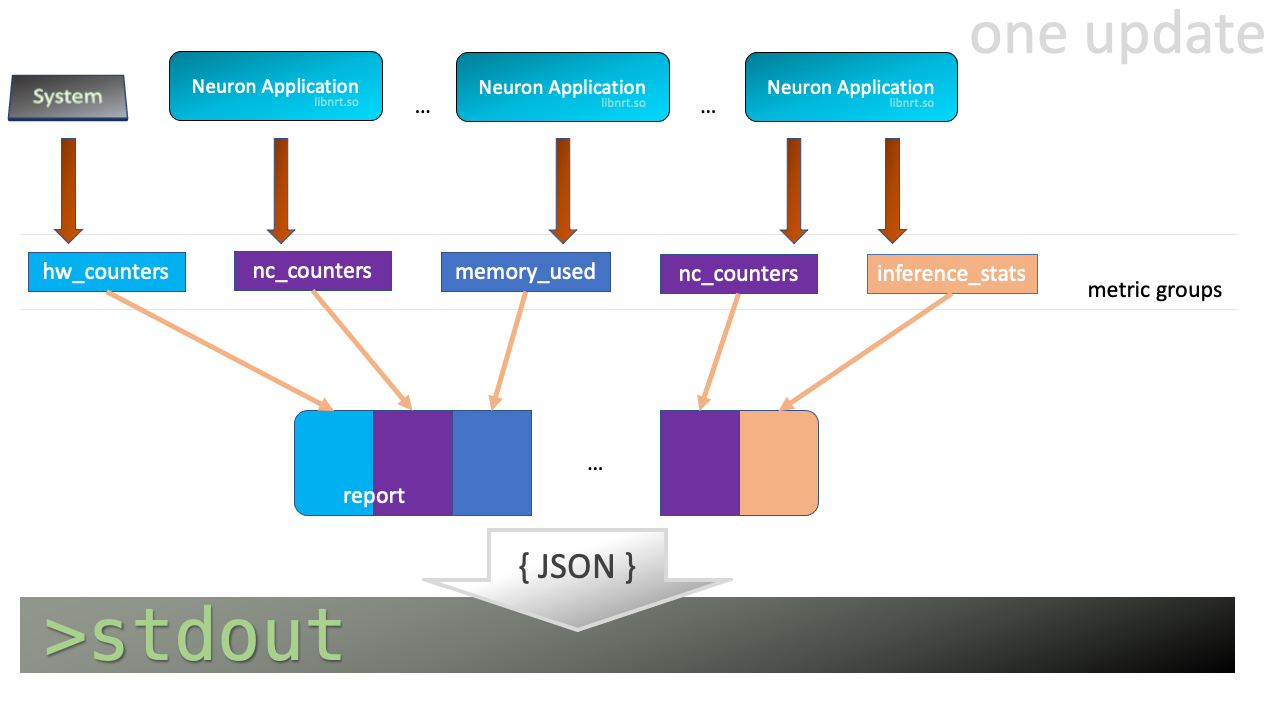
neuron-monitor collects metrics and stats from the Neuron
Applications running on the system and streams the collected data to
stdout in JSON format. It is provided as part of the
aws-neuron-tools package.
These metrics and stats are organized into metric groups which can be configured by providing a configuration file as described in Using neuron-monitor
When running, neuron-monitor will:
Collect the data for the metric groups which, based on the elapsed time since their last update, need to be updated
Take the newly collected data and consolidate it into a large report
Serialize that report to JSON and stream it to stdout from where it can be consumed by other tools - such as the sample neuron-monitor-cloudwatch.py and neuron-monitor-prometheus.py scripts.
Wait until at least one metric group needs to be collected and repeat this flow
Note
neuron-monitor fully supports the newly launched Trn2 instances.
Using neuron-monitor#
neuron-monitor CLI
- neuron-monitor [parameters]#
neuron-monitor accepts the following optional parameters:
--verbose(int) default=0: Can be 0 to 4, and controls the amount of debugging and verbose information sent to stderr; 0: no output, 4: maximum verbosity-c, --config-file(string): Allows specifying a valid path to a neuron-monitor JSON configuration file
Example:
neuron-monitor -c monitor.conf
Not specifying any configuration file will enable collecting all the metric groups with a period of 5 seconds for all currently running Neuron applications.
Configuration file example#
Example of a configuration file which enables all available metric
groups for every running Neuron application, with a global update period of 1
second and sets an update period of 2 seconds for the "neuron_hw_counters"
metric group:
{
  "period": "1s",
  "neuron_runtimes": [
    {
      "tag_filter": ".*",
      "metrics": [
        {
          "type": "neuroncore_counters"
        },
        {
          "type": "memory_used"
        },
        {
          "type": "neuron_runtime_vcpu_usage"
        },
        {
          "type": "execution_stats"
        }
      ]
    }
  ],
  "system_metrics": [
    {
      "type": "vcpu_usage"
    },
    {
      "type": "memory_info"
    },
    {
       "period": "2s",
       "type": "neuron_hw_counters"
    }
  ]
}
Neuron applications tagging#
In order to make application monitoring easier, Neuron applications can be tagged with a 255 character
string which identifies that app. Tagging is done using the NEURON_PROCESS_TAG environment variable.
For example:
NEURON_PROCESS_TAG=my_app_1 python training.py will associate the my_app_1 tag with that Python application.
If NEURON_PROCESS_TAG is not specified, the application’s PID will be used as a TAG.
This tag will be used by neuron-monitor to filter Neuron applications.
JSON objects and fields in the configuration file#
"neuron_runtimes"- array of objects specifying which Neuron Applications to monitor and what metric groups are enabled for each of them"tag_filter"- a regex which will be used to filter Neuron applications tags in order to determine if they will be monitored (optional)"metrics"- array of objects specifying which metric groups to capture for this Neuron application"type"- type of metric group
"period"- this field applies to metric group objects and sets the amount of time between two updates for that metric groupif can be specified as part of the root and/or neuron_runtime objects where it applies to all their children, and/or as part of a metric group object
if there’s no period specified, a default value of 5 seconds will be used
"system_metrics"- array of objects specifying which system level metric groups are enabled
Neuron Runtime-level metric groups#
neuroncore_counters - NeuronCore related metrics
memory_used - data on the amount of memory used by the Neuron application
vcpu_usage - Neuron application vCPU utilization data
execution_stats - Neuron application execution stats, including error count and latency
System-wide metric groups#
vcpu_usage - system-wide vCPU usage
memory_info - system-wide memory usage
neuron_hw_counters - counters for correctable and uncorrectable memory ecc events
Execution model#
neuron-monitor waits for one or more metric groups to be up for update, then collects the corresponding data, consolidates it into a report which is streamed to stdout as a JSON and goes back to waiting.
The JSON output format#
Whenever the report gets updated, a complete JSON is written to stdout. This is its structure:
{
  "neuron_runtime_data": [
    {
      "pid": 0,
      "address": "",
      "neuron_runtime_tag", "my_app_1",
      "error": "",
      "report": {
        "neuroncore_counters": {
            [...]
        },
        "execution_stats": {
            [...]
        },
        "memory_used": {
            [...]
        },
        "neuron_runtime_vcpu_usage": {
            [...]
        }
      }
    }
  ],
  "system_data": {
    "neuron_hw_counters": {
            [...]
    },
    "vcpu_usage": {
            [...]
    },
    "memory_info": {
            [...]
    }
  },
  "instance_info": {
            [...]
  },
  "neuron_hardware_info": {
            [...]
  },
  "neuron_k8s_info": {
            [...]
  }
}
"neuron_runtime_data"is an array containing one entry per each Neuron application which passes the filter specified in the settings file"pid"is the pid of this Neuron application"neuron_runtime_tag"is the configured tag for the Neuron application"error"specifies any error that occurred when collecting data from this Neuron application"report"will contain the results for the Neuron application-level metric groups; their formats are described below
"system_data"has a similar structure to"neuron_runtime_data"‘s"report"but only contains system-level metric groups (not associated to any Neuron application)
Regardless of the configuration, the following two JSON objects are always present in the output:
instance_info#
Contains information about the instance on which neuron-monitor is running.
"instance_info": {
  "instance_name": "My_Instance",
  "instance_id": "i-0011223344556677a",
  "instance_type": "trn2n.48xlarge",
  "instance_availability_zone": "us-west-2b",
  "instance_availability_zone_id": "usw2-az2",
  "instance_region": "us-west-2",
  "ami_id": "ami-0011223344556677b",
  "subnet_id": "subnet-112233ee",
  "error": ""
}
Depending on when the instance was launched, the following fields might not be available:
instance_availability_zone_id: available only for instances launched in 2020-08-24 and laterinstance_region: available only for instances launched on 2020-08-24 and laterinstance_name: available only ifinstance_regionis set and aws-cli tools are installed
error will contain an error string if getting one of the fields,
except those mentioned above, resulted in an error.
neuron_hardware_info#
Contains basic information about the Neuron hardware.
"neuron_hardware_info": {
  "neuron_device_type": "trainium2",
  "neuron_device_version": "v4",
  "neuroncore_version": "v3d",
  "neuron_device_count": 16,
  "neuron_device_memory_size": 103079215104,
  "neuroncore_per_device_count": 4,
  "logical_neuroncore_config": 2,
  "error": ""
}
neuron_device_type: type of the Neuron Devices on the instanceneuroncore_version: version of the NeuronCores on the instanceneuron_device_count: number of available Neuron Devicesneuron_device_memory_size: total memory available on each Neuron Deviceneuroncore_per_device_count: number of NeuronCores present on each Neuron Devicelogical_neuroncore_config: the current Logical NeuronCore configurationerror: will contain an error string if any occurred when getting this information (usually due to the Neuron Driver not being installed or not running).
The following JSON object is disabled by default, but can be made available if “k8s_info” is enabled:
neuron_k8s_info#
Contains information about what Kubernetes pods/containers are using Neuron resources
"neuron_k8s_info": {
  "period": 15.030359284,
  "neuroncores_k8s_info": {
    "0": {
      "pod_name": "p0",
      "namespace": "n0",
      "container_name": ["c0"]
    },
    "1": {
      "pod_name": "p0",
      "namespace": "n0",
      "container_name": ["c0"]
    },
    ...
  "neurondevices_k8s_info": {
    "0": {
      "pod_name": "p0",
      "namespace": "n0",
      "container_name": ["c0"]
    },
    ...
  }
  "error": ""
},
"neuroncores_k8s_info"- object containing information on which Neuron cores are being used by Kubernetes pod/containers, indexed by Neuron core index:"neuroncore_index": { neuroncore_k8s_data }"pod_name"- name of pod using Neuron core"namespace"- namespace of pod using Neuron core"container_name"- names of containers using Neuron core
"neurondevices_k8s_info"- object containing information on which Neuron devices are being used by Kubernetes pod/containers, indexed by Neuron device index:"neurondevice_index": { neurondevice_k8s_data }"pod_name"- name of pod using Neuron device"namespace"- namespace of pod using Neuron device"container_name"- names of containers using Neuron device
"error"- will contain an error string if any occurred when getting this information
For more information on how to enable K8s information, see neuron-monitor-k8s-info.py (Beta).
Metric Groups#
Each metric group requested in the settings file will get an entry in the resulting output. The general format for such an entry is:
"metric_group": {
  "period": 1.015, // Actual captured period, in seconds
  "error": "",     // Error, if any occurred, otherwise an empty string
  [...]            // Metric group specific data
}
Neuron application level metric groups#
neuroncore_counters#
"neuroncore_counters": {
  "period": 1.000113182,
  "neuroncores_in_use": {
    "0": {
      "neuroncore_utilization": 42.01,
      "flops": 1234567891011,
      "v3d": {
        "nc_v3.0": {
          "neuroncore_utilization": 21.01
        },
        "nc_v3.1": {
          "neuroncore_utilization": 63.01
        }
      }
    },
    "1": {
      "neuroncore_utilization": 42.02,
      "flops": 1234567891021,
      "v3d": {
        "nc_v3.2": {
          "neuroncore_utilization": 21.02
        },
        "nc_v3.3": {
          "neuroncore_utilization": 63.02
        }
      }
    },
    [...]
  },
  "error": ""
}
"neuroncores_in_use"is an object containing data for all the NeuronCores that were active when the data was captured, indexed by NeuronCore index:"neuroncore_index": { neuroncore_data }"neuroncore_utilization"- NeuronCore utilization, in percent, during the captured period"flops"- number of floating point operations per second during the captured period"v3d"- only available on Trn2 - contains the utilization for every physical NeuronCore that makes up the current NeuronCore
"error"- string containing any error that occurred when collecting the data
execution_stats#
"execution_stats": {
  "period": 1.030613214,
  "error_summary": {
    "generic": 0,
    "numerical": 0,
    "transient": 0,
    "model": 0,
    "runtime": 0,
    "hardware": 0
  },
  "execution_summary": {
    "completed": 123,
    "completed_with_err": 0,
    "completed_with_num_err": 0,
    "timed_out": 0,
    "incorrect_input": 0,
    "failed_to_queue": 0
  },
  "latency_stats": {
    "total_latency": {
      "p0": 0.01100001,
      "p1": 0.01100002,
      "p25": 0.01100004,
      "p50": 0.01100008,
      "p75": 0.01100010,
      "p99": 0.01100012,
      "p100": 0.01100013
    },
    "device_latency": {
      "p0": 0.01000001,
      "p1": 0.01000002,
      "p25": 0.01000004,
      "p50": 0.01000008,
      "p75": 0.01000010,
      "p99": 0.01000012,
      "p100": 0.01000013
    }
  },
  "error": ""
},
"error_summary"is an object containing the error counts for the captured period indexed by their type"generic"- generic execution errors"numeric"- NAN errors encountered during execution"transient"- recoverable errors, such as ECC corrections"model"- model-related errors"runtime"- Neuron Runtime errors"hardware"- hardware errors such as uncorrectable ECC issues
"execution_summary"is an object containing all execution outcome counts for the captured period indexed by their type"completed"- executions completed successfully"completed_with_err"- executions that ended in an error other than a numeric error"completed_with_num_err"- executions that ended in a numeric error"timed_out"- executions that took longer than the Neuron Runtime configured timeout value"incorrect_input"- executions that failed to start due to incorrect input being provided"failed_to_queue"- execution requests that were rejected due to Neuron Runtime not being able to queue them
"latency_stats"contains two objects containing latency percentiles, in seconds, for the data captured for the model executed during the captured period. If there are no models being executed during this time, the two objects will benull(i.e."total_latency": null)"total_latency"- percentiles, in seconds, representing latency for an execution as measured by the Neuron Runtime"device_latency"- percentiles, in seconds, representing execution time exclusively on the Neuron Device
"error"- string containing any error that occurred when collecting the data
memory_used#
"memory_used": {
  "period": 1.00001,
  "neuron_runtime_used_bytes": {
    "host": 6997643264,
    "neuron_device": 12519788544,
    "usage_breakdown": {
      "host": {
        "application_memory": 6996594688,
        "constants": 0,
        "dma_buffers": 1048576,
        "tensors": 0
      },
      "neuroncore_memory_usage": {
        "0": {
          "constants": 193986816,
          "model_code": 176285056,
          "model_shared_scratchpad": 0,
          "runtime_memory": 0,
          "tensors": 20971520
        },
        "1": {
          "constants": 193986816,
          "model_code": 176285056,
          "model_shared_scratchpad": 0,
          "runtime_memory": 0,
          "tensors": 20971520
        },
        ...
      }
  }
  "loaded_models": [
    {
      "name": "neff",
      "uuid": "91f2f66e83ea419dace1da07617ad39f",
      "model_id": 10005,
      "is_running": false,
      "subgraphs": {
        "sg_00": {
          "memory_used_bytes": {
            "host": 20480,
            "neuron_device": 21001024,
            "usage_breakdown": {
              "host": {
                "application_memory": 20480,
                "constants": 0,
                "dma_buffers": 0,
                "tensors": 0
              },
              "neuron_device": {
                "constants": 20971520,
                "model_code": 29504,
                "runtime_memory": 0,
                "tensors": 0
              }
            }
          },
          "neuroncore_index": 0,
          "neuron_device_index": 12
        }
      }
    },
    ...
    ],
    "error": ""
 }
"memory_used"summarizes the amount of memory used by the Neuron application"neuron_runtime_used_bytes"- current amount of memory used by the Neuron application"host"- total host DRAM usage in bytes"neuron_device"- total Neuron device memory usage in bytes"usage_breakdown"- a breakdown of the total memory usage in the other two fields"host"- breakdown of the host memory usage"application_memory"- amount of host memory used by the application - this includes all allocations that are not included in the next categories"constants"- amount of host memory used for constants during training (or weights during inference)"dma_buffers"- amount of host memory used for DMA transfers"tensors"- amount of host memory used for tensors
"neuroncore_memory_usage"- a breakdown of memory allocated on the Neuron Devices and the NeuronCores for which it was allocated"0"-"64"(for trn2-48xlarge) - NeuronCores for which the memory was allocated"constants"- amount of device memory used for constants during training (or weights during inference)"model_code"- amount of device memory used for models’ executable code"model_shared_scratchpad"- amount of device memory used for the scratchpad shared by the models - a memory region reserved for the models’ internal variables and auxiliary buffers"runtime_memory"- amount of device memory used by the Neuron Runtime"tensors"- amount of device memory used for tensors
"loaded_models"- array containing objects representing loaded models"name"- name of the model"uuid"- unique id for the model"model_id"- Neuron application-assigned ID for this model"is_running"- true if this model is currently started, false otherwise“
subgraphs"- object containing all the subgraphs for the model, indexed by their name:"subgraph_name": { subgraph_data }"memory_used_bytes"- memory usage for this subgraph"host"- total host DRAM usage in bytes"neuron_device"- total Neuron device DRAM usage in bytes"usage_breakdown"- a breakdown of memory allocated at load time for this model"host"- breakdown of host memory allocated for this model"application_memory"- amount of host memory allocated for this model by the Neuron Runtime which doesn’t fall in any of the next categories"constants"- amount of host memory used for constants during training (or weights during inference)"dma_buffers"- host memory allocated for DMA transfers for this model"tensors"- amount of device memory used for tensors at model load time
"neuron_device"- a breakdown of device memory allocated for this model"constants"- amount of device memory used for constants during training (or weights during inference)"model_code"- amount of device memory used for the model’s executable code"runtime_memory"- amount of device memory used by the Neuron Runtime for this model"tensors"- amount of device memory allocated for tensors at this model’s load time
"neuroncore_index"- NeuronCore index on which the subgraph is loaded"neuron_device_index"- Neuron device index on which the subgraph is loaded
"error"- string containing any error that occurred when collecting the data
neuron_runtime_vcpu_usage#
"neuron_runtime_vcpu_usage": {
  "period": 1.030604818,
  "vcpu_usage": {
    "user": 42.01,
    "system": 12.34
  },
  "error": ""
}
"vcpu_usage"- object showing vCPU usage in percentages for the Neuron application during the captured period"user"- percentage of time spent in user code by this Neuron Application"system"- percentage of time spent in kernel code by this Neuron application
"error"- string containing any error that occurred when collecting the data
System level metric groups#
neuron_hw_counters#
"neuron_hw_counters": {
  "period": 1.030359284,
  "neuron_devices": [
    {
      "neuron_device_index": 0,
      "mem_ecc_corrected": 0,
      "mem_ecc_uncorrected": 0,
      "sram_ecc_uncorrected": 0,
      "sram_ecc_corrected": 0
    }
  ],
  "error": ""
},
"neuron_devices"- array containing ECC data for all Neuron devices"neuron_device_index"- Neuron device index"mem_ecc_corrected"- number of corrected ECC events in the Neuron device’s DRAM"mem_ecc_uncorrected"- number of uncorrected ECC events in the Neuron device’s DRAM"sram_ecc_uncorrected"- number of uncorrected ECC events in the Neuron device’s SRAM"sram_ecc_corrected"- number of corrected ECC events in the Neuron device’s SRAM
"error"- string containing any error that occurred when collecting the data
vcpu_usage#
"vcpu_usage": {
  "period": 0.999974868,
  "average_usage": {
    "user": 32.77,
    "nice": 0,
    "system": 22.87,
    "idle": 39.36,
    "io_wait": 0,
    "irq": 0,
    "soft_irq": 0
  },
  "usage_data": {
    "0": {
      "user": 34.41,
      "nice": 0,
      "system": 27.96,
      "idle": 37.63,
      "io_wait": 0,
      "irq": 0,
      "soft_irq": 0
    },
    "1": {
      "user": 56.84,
      "nice": 0,
      "system": 28.42,
      "idle": 14.74,
      "io_wait": 0,
      "irq": 0,
      "soft_irq": 0
    },
    [...]
  },
  "context_switch_count": 123456,
  "error": ""
}
each vCPU usage object contains the following fields:
"user"- percentage of time spent in user code"nice"- percentage of time spent executing niced user code"system"- percentage of time spent executing kernel code"idle"- percentage of time spent idle"io_wait"- percentage of time spent waiting for IO operations"irq"- percentage of time spent servicing hardware interrupts"soft_irq"- percentage of time spent servicing software interrupts
"average_usage"- contains the average usage across all vCPUs during the captured period"usage_data"- contains per vCPU usage during the captured period"context_switch_count"- contains the number of vCPU context switches during the captured period"error"- string containing any error that occurred when collecting the data
memory_info#
"memory_info": {
  "period": 5.346411129,
  "memory_total_bytes": 49345835008,
  "memory_used_bytes": 16042344448,
  "swap_total_bytes": 0,
  "swap_used_bytes": 0,
  "error": ""
}
"memory_total_bytes"- total size of the host memory, in bytes"memory_used_bytes"- amount of host memory in use, in bytes"swap_total_bytes"- total size of the host swap file, in bytes"swap_used_bytes"- amount of swap memory in use, in bytes
Companion scripts#
neuron-monitor is installed with three Python companion scripts: neuron-monitor-cloudwatch.py, neuron-monitor-prometheus.py, and neuron-monitor-k8s-info.py (Beta)
neuron-monitor-cloudwatch.py#
It requires Python3 and the boto3 Python
module.
It is installed to:
/opt/aws/neuron/bin/neuron-monitor-cloudwatch.py.
Using neuron-monitor-cloudwatch.py#
neuron-monitor | neuron-monitor-cloudwatch.py --namespace <namespace> --region <region>
For example:
neuron-monitor | neuron-monitor-cloudwatch.py --namespace neuron_monitor_test --region us-west-2
neuron-monitor-prometheus.py#
It requires Python3 and the Prometheus client Python
module. It is installed
to: /opt/aws/neuron/bin/neuron-monitor-prometheus.py.
Using neuron-monitor-prometheus.py#
neuron-monitor | neuron-monitor-prometheus.py --port <port>
For example:
neuron-monitor | neuron-monitor-prometheus.py --port 8008
The default value for --port is 8000.
If your data visualization framework is Grafana, we provided a Grafana dashboard
which integrates with Prometheus and this script.
neuron-monitor-k8s-info.py (Beta)#
It requires Python3 and the gRPC Python
package. It is installed
to: /opt/aws/neuron/bin/neuron-monitor-k8s-info.py.
Important
This companion script is in Beta and is disabled by default.
It only works on EKS, and is currently not supported with EKS auto mode.
Using neuron-monitor-k8s-info.py#
neuron-monitor | neuron-monitor-prometheus.py --port <port> --enable-k8s-info | neuron-monitor-k8s-info.py --period <seconds>
For example:
neuron-monitor | neuron-monitor-prometheus.py --port 8008 --enable-k8s-info | neuron-monitor-k8s-info.py --period 30
The default value for --period is 15.
Running neuron monitor in Kubernetes environment#
For running neuron monitor in Kubernetes environment, please refer to instructions here.
This document is relevant for: Inf1, Inf2, Trn1, Trn2, Trn3