
This document is relevant for: Inf1, Inf2, Trn1, Trn2, Trn3
Region Highlighter#
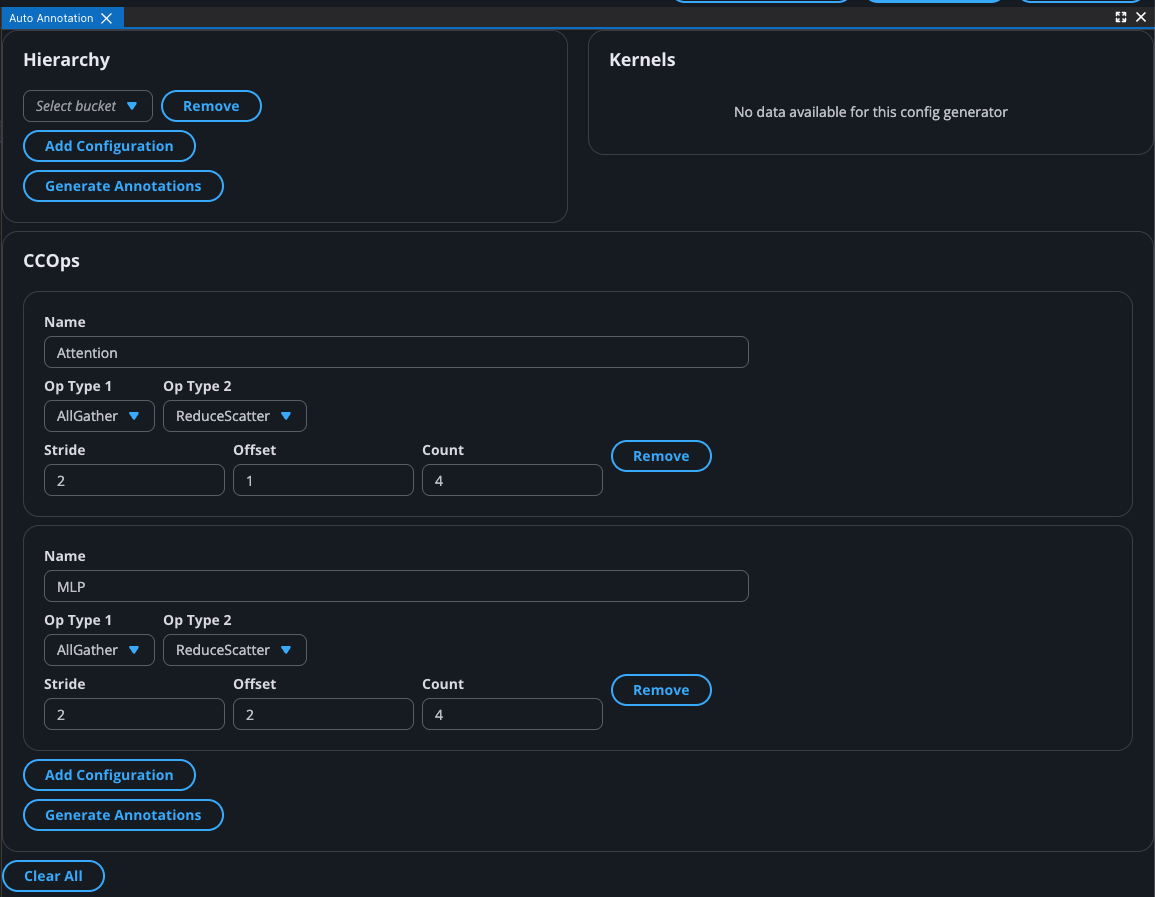
Region Highlighter automatically identifies and marks regions in your profiles based on collective operations, operation hierarchy, and kernel stack frames. Rather than manually scanning the timeline and placing annotations, the Region Highlighter analyzes the profile structure, in combination with a user-provided configuration, and generates bounded time regions that highlight areas of interest for performance analysis. These regions integrate directly with existing Annotation tool, and the Summary Viewer for comparative, per-region performance insights.
Region Highlighter is enabled by default and requires no additional configuration or external services.
Applies to#
Region Highlighter is applicable to:
Device profiles with collective operations, hierarchy data, or kernel stack frame information
System profiles containing device-level profiling data
How it works#
Region Highlighter uses three complementary analysis methods to identify meaningful regions in a profile:
- Collective operations boundaries
Uses Collective Operation boundaries in the profile timeline, such as all-reduce or all-gather to generate regions in between collectives for quick comparison.
- Hierarchy data analysis
Analyzes the operation hierarchy structure to detect logical groupings of operations. This produces regions aligned to model layers and operation groups, giving you a structured view of where time is spent across different parts of your model.
- Kernel stack frame analysis
Generates regions based on kernel execution boundaries derived from stack frame information. These regions align with individual kernel invocations, making it straightforward to compare the performance characteristics of different kernels.
Each method contributes a set of annotation regions, the resulting regions are combined to give a comprehensive view of the profile’s structure. Once generated, the explorer provides a quick overview summary of the performance of each of the regions.
NOTE: Only one method of generating regions can be used at a time.
What are annotation regions?#
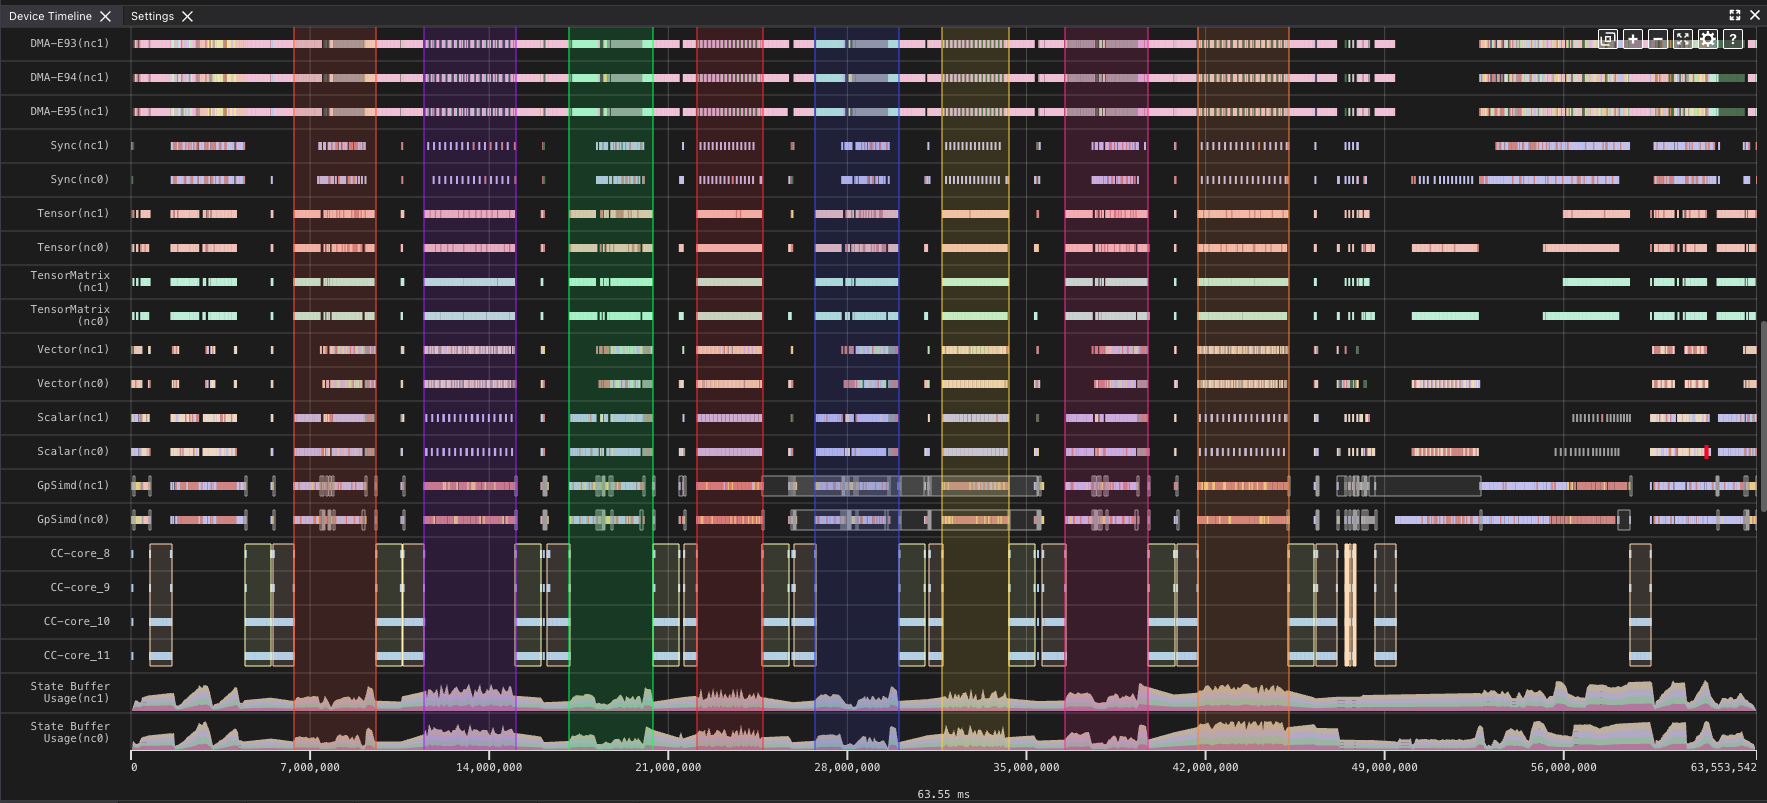
An annotation region is a time slice in the profile demarcated by a start annotation and an end annotation. Unlike individual annotation markers, regions represent bounded time intervals suitable for comparative performance analysis.
Region Highlighter generates these regions automatically. You can view, rename, save, and load them through the Annotations tab in the Device Trace Viewer, just like manually created annotations. Each region captures a specific segment of the profile timeline so you can compare metrics across different parts of your workload.
Detailed Region Comparison#
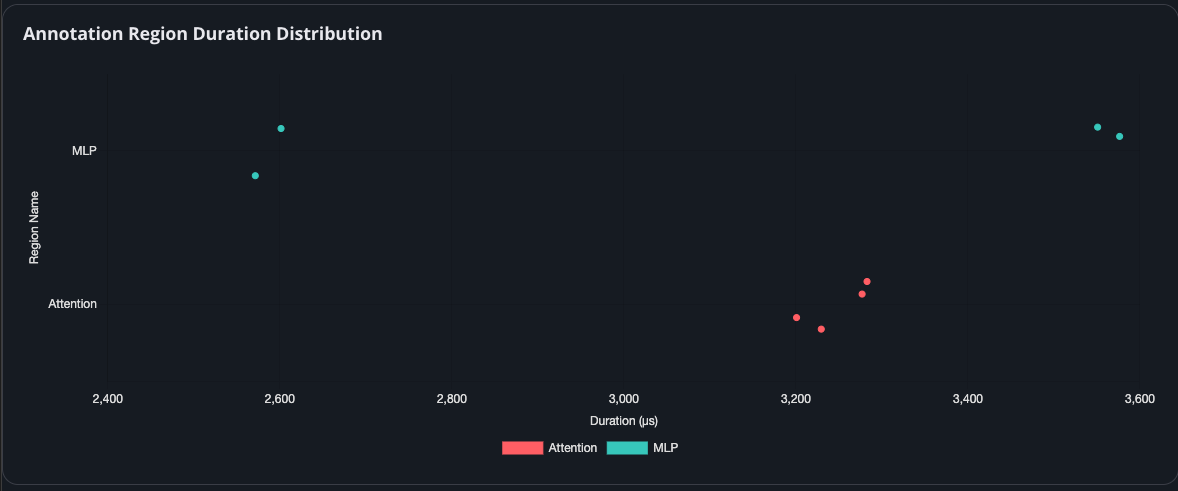
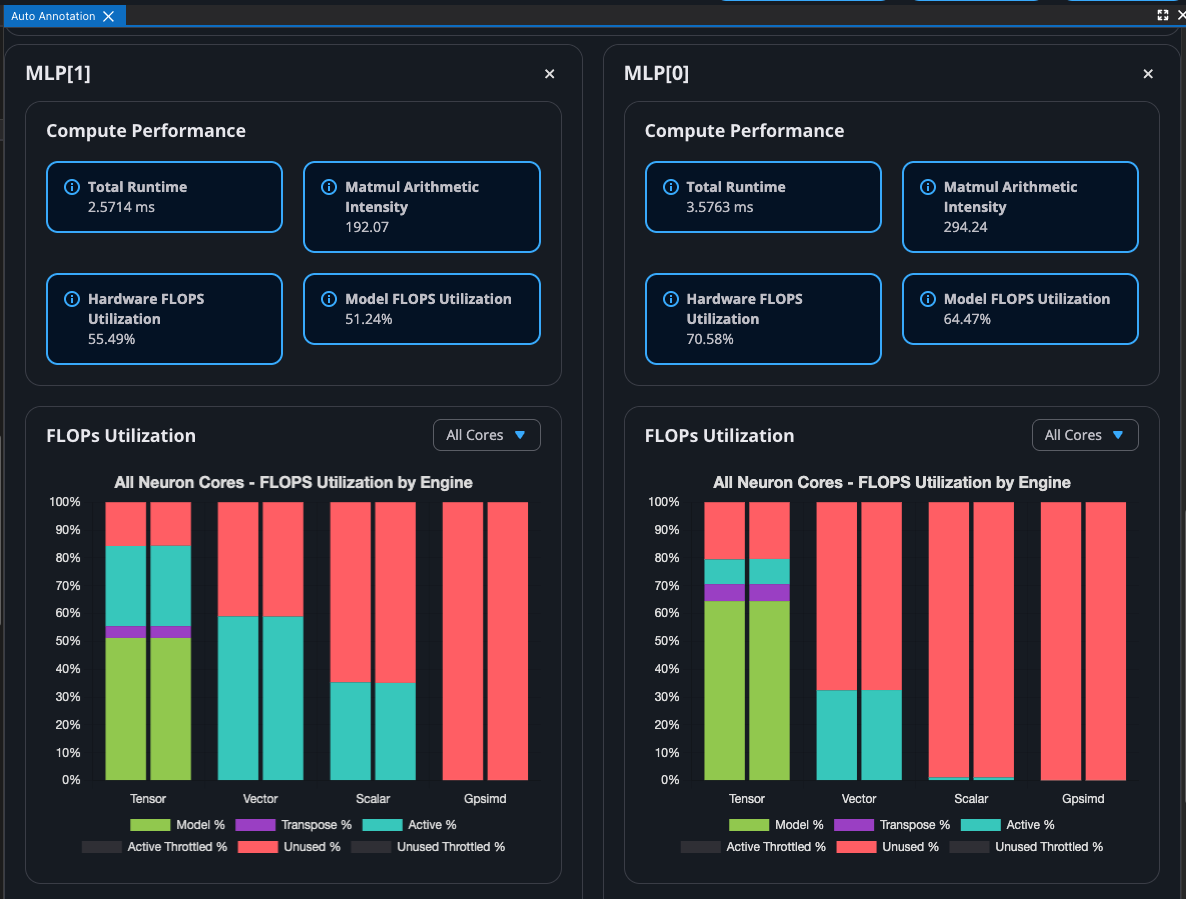
The Region Highlighter tool also provides the ability to compare up to 3 regions side-by-side using the same views on the SummaryPage. To access this view, click the data points in the Annotation Region Duration Distribution chart shown above.
Using Region Highlighter with the Summary Viewer#
Region Highlighter regions automatically populate the Summary Viewer’s region selection menu. This allows you to:
Compare per-region metrics — Select individual regions to view their performance statistics, including compute utilization, memory bandwidth, and DMA activity.
Identify outliers — Quickly spot regions with anomalous performance characteristics by switching between regions and comparing key metrics.
Drill into specific layers — Use hierarchy-based regions to analyze performance at the model layer level without manually placing annotations.
Select a region from the “Region Selection” menu in the Summary Viewer to view its performance data. See Summary Viewer for details on interpreting region-level insights.
Data requirements#
Region Highlighter generates regions based on the data available in each profile. If a profile is missing a particular data source, the corresponding analysis method is skipped:
Data source |
Annotation type produced |
|---|---|
Collective operations metadata |
Regions around collective communication operations |
Operation hierarchy |
Regions aligned to model layers and operation groups |
Kernel stack frames |
Regions aligned to kernel execution boundaries |
If none of these data sources are present, Region Highlighter will not generate any regions.
Further reading#
Summary Viewer — Interpret the per-region performance insights that Region Highlighter feeds into
Device Trace Viewer — Learn about the Device Trace Viewer where annotation regions are displayed
AI Recommendation Viewer — Get AI-powered optimization recommendations for NKI profiles
This document is relevant for: Inf1, Inf2, Trn1, Trn2, Trn3