
This document is relevant for: Inf1, Inf2, Trn1, Trn2, Trn3
Device Trace Viewer#
The Neuron Device Trace Viewer displays a hardware instruction level granularity of execution on a NeuronCore. Neuron Explorer collects the timestamped start and end events that occur on the device into a NTFF. As a post-processing step, the profiler will correlate these events with information in the compiled NEFF to generate a detailed report of the hardware performance. The Neuron Explorer UI provides several different tools for an extensible and customizable workflow.
Tools#
Device Trace Viewer#
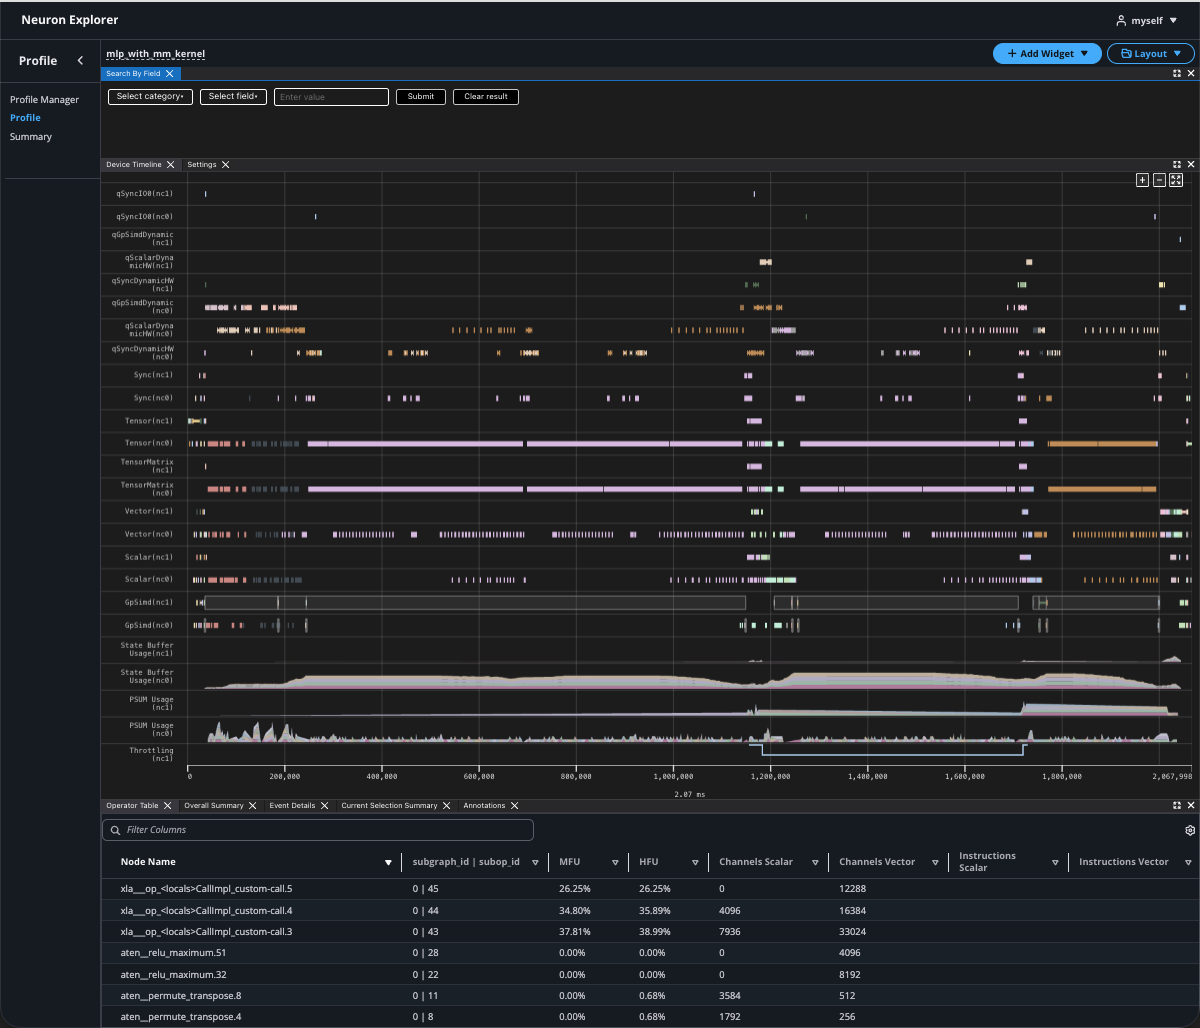
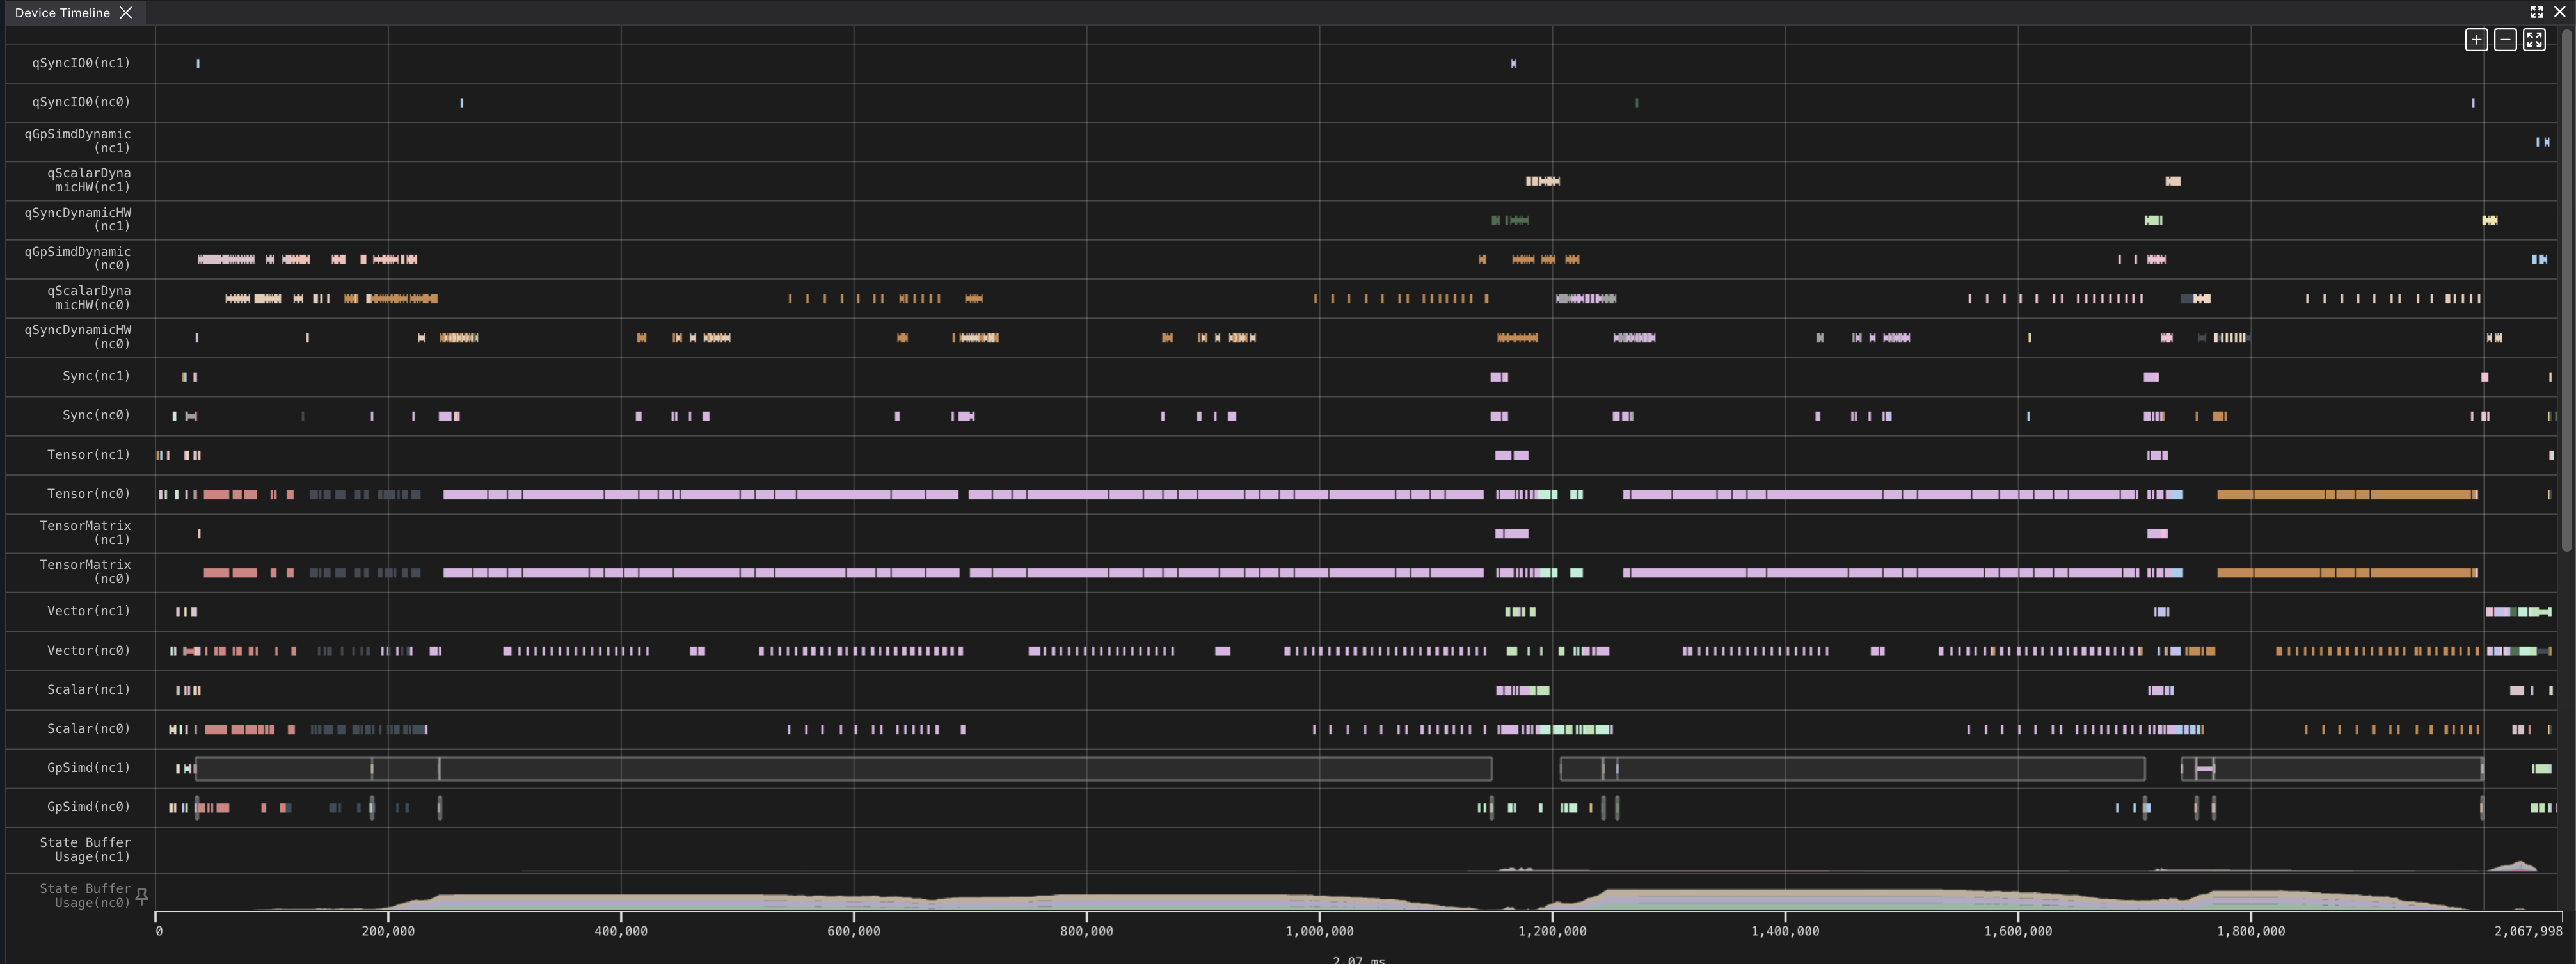
The Device Trace Viewer presents a timeline view of the device execution, including activity on the DMA and compute engines, Hardware FLOPs Utilization (HFU) and device memory utilization over time, and more.
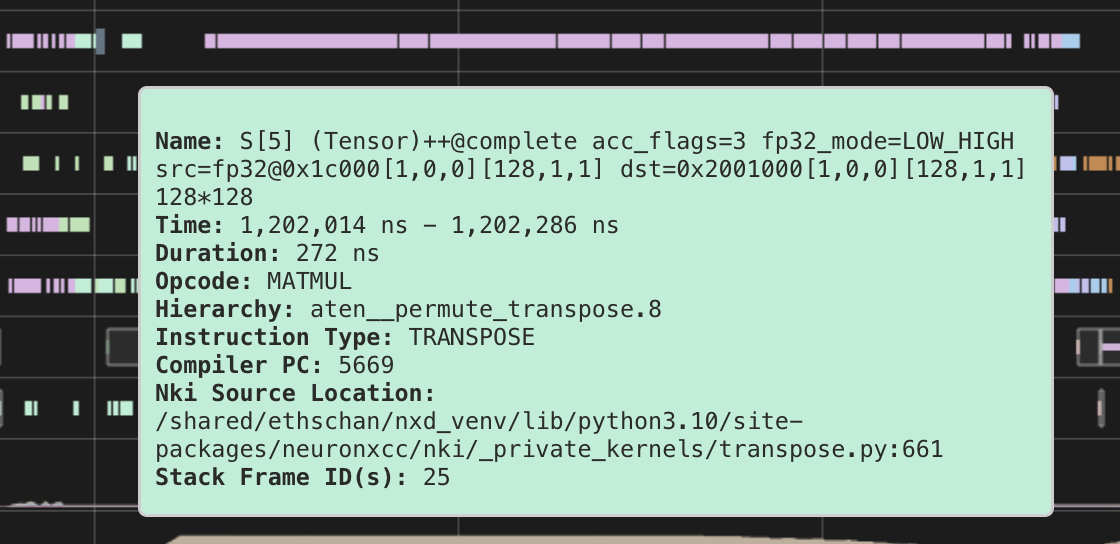
Hover#
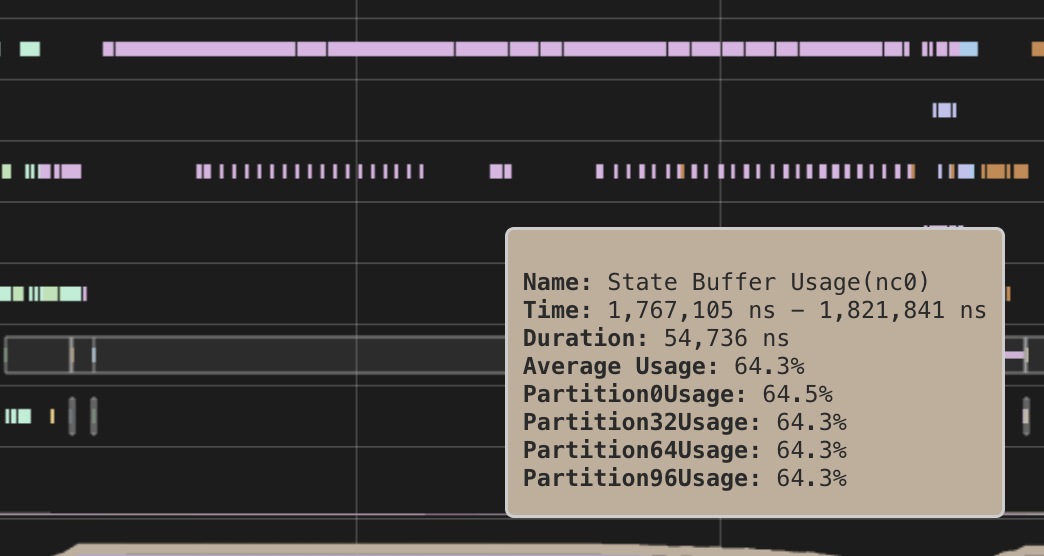
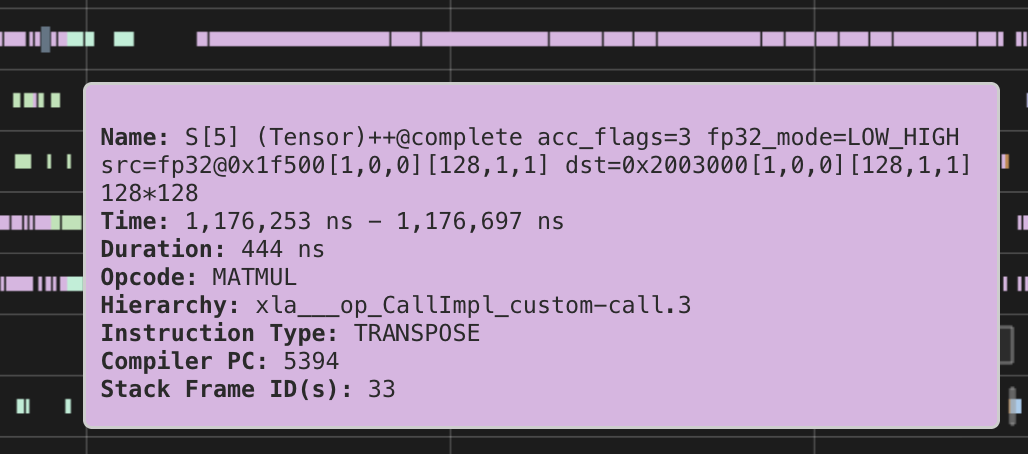
Hover on events in the timeline to see important identifying information at a glance, such as the time window, the hierarchy, and the hardware instruction that was executed.
For more details, clicking the event will display the full details in the Event Details widget.
Color Scheme#
|
|
Instructions are color-coded according to their associated PyTorch operator. All instructions derived from the same PyTorch operator share an identical color.
Note
In future releases, we will introduce more customizable options for color-coding.
Panning#
Panning is supported in a couple of ways:
Left-clicking the x-axis and dragging it
Spinning scroll-wheel while holding down shift
- With the keyboard:
A/D keys for left/right movement
Left/right arrow keys for left/right movement
The amount panned depends on the current zoom level.
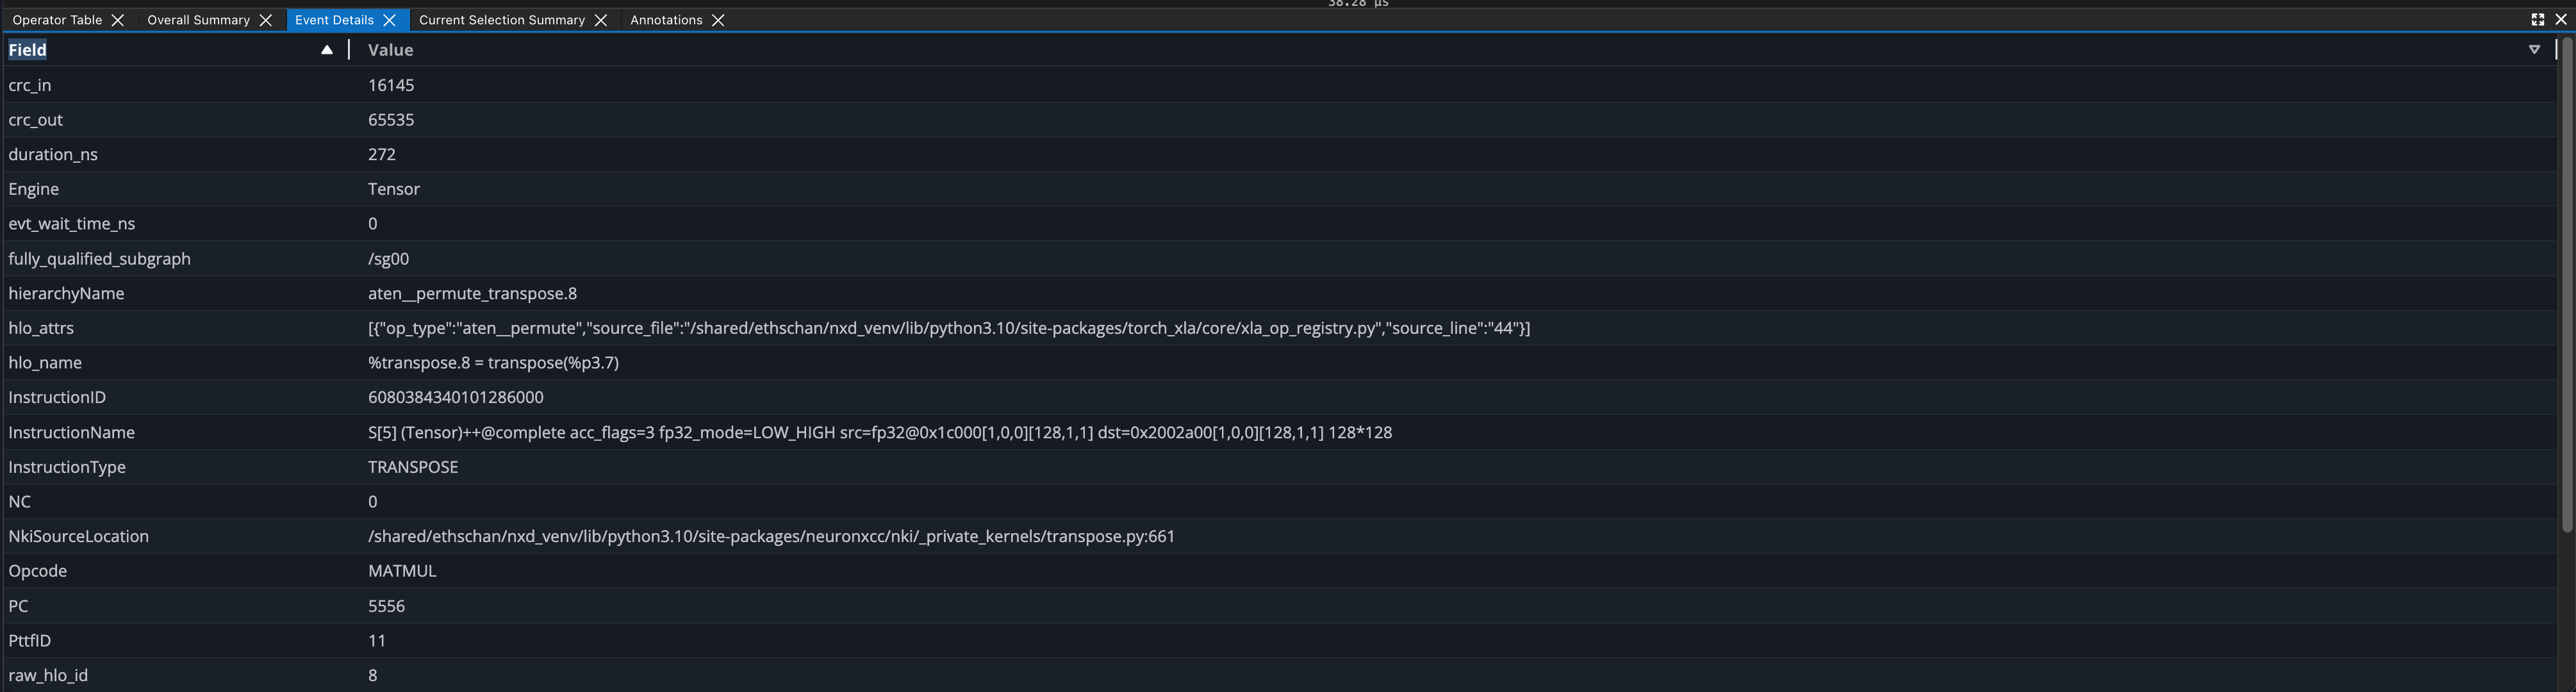
Event Details#
Upon clicking an event in the Device Trace Viewer, all details related to the event will appear in the Event Details. The information shown will be a superset of the information available on hover, allowing us to dive deeper into what is happening on the hardware.
The Event Details table will populate with field data from clicked events from the instruction widget.
When filtering by fields through Search, all matching events will be rendered as pages in the Event Details. Users can navigate through each page to analyze data for each matching event.
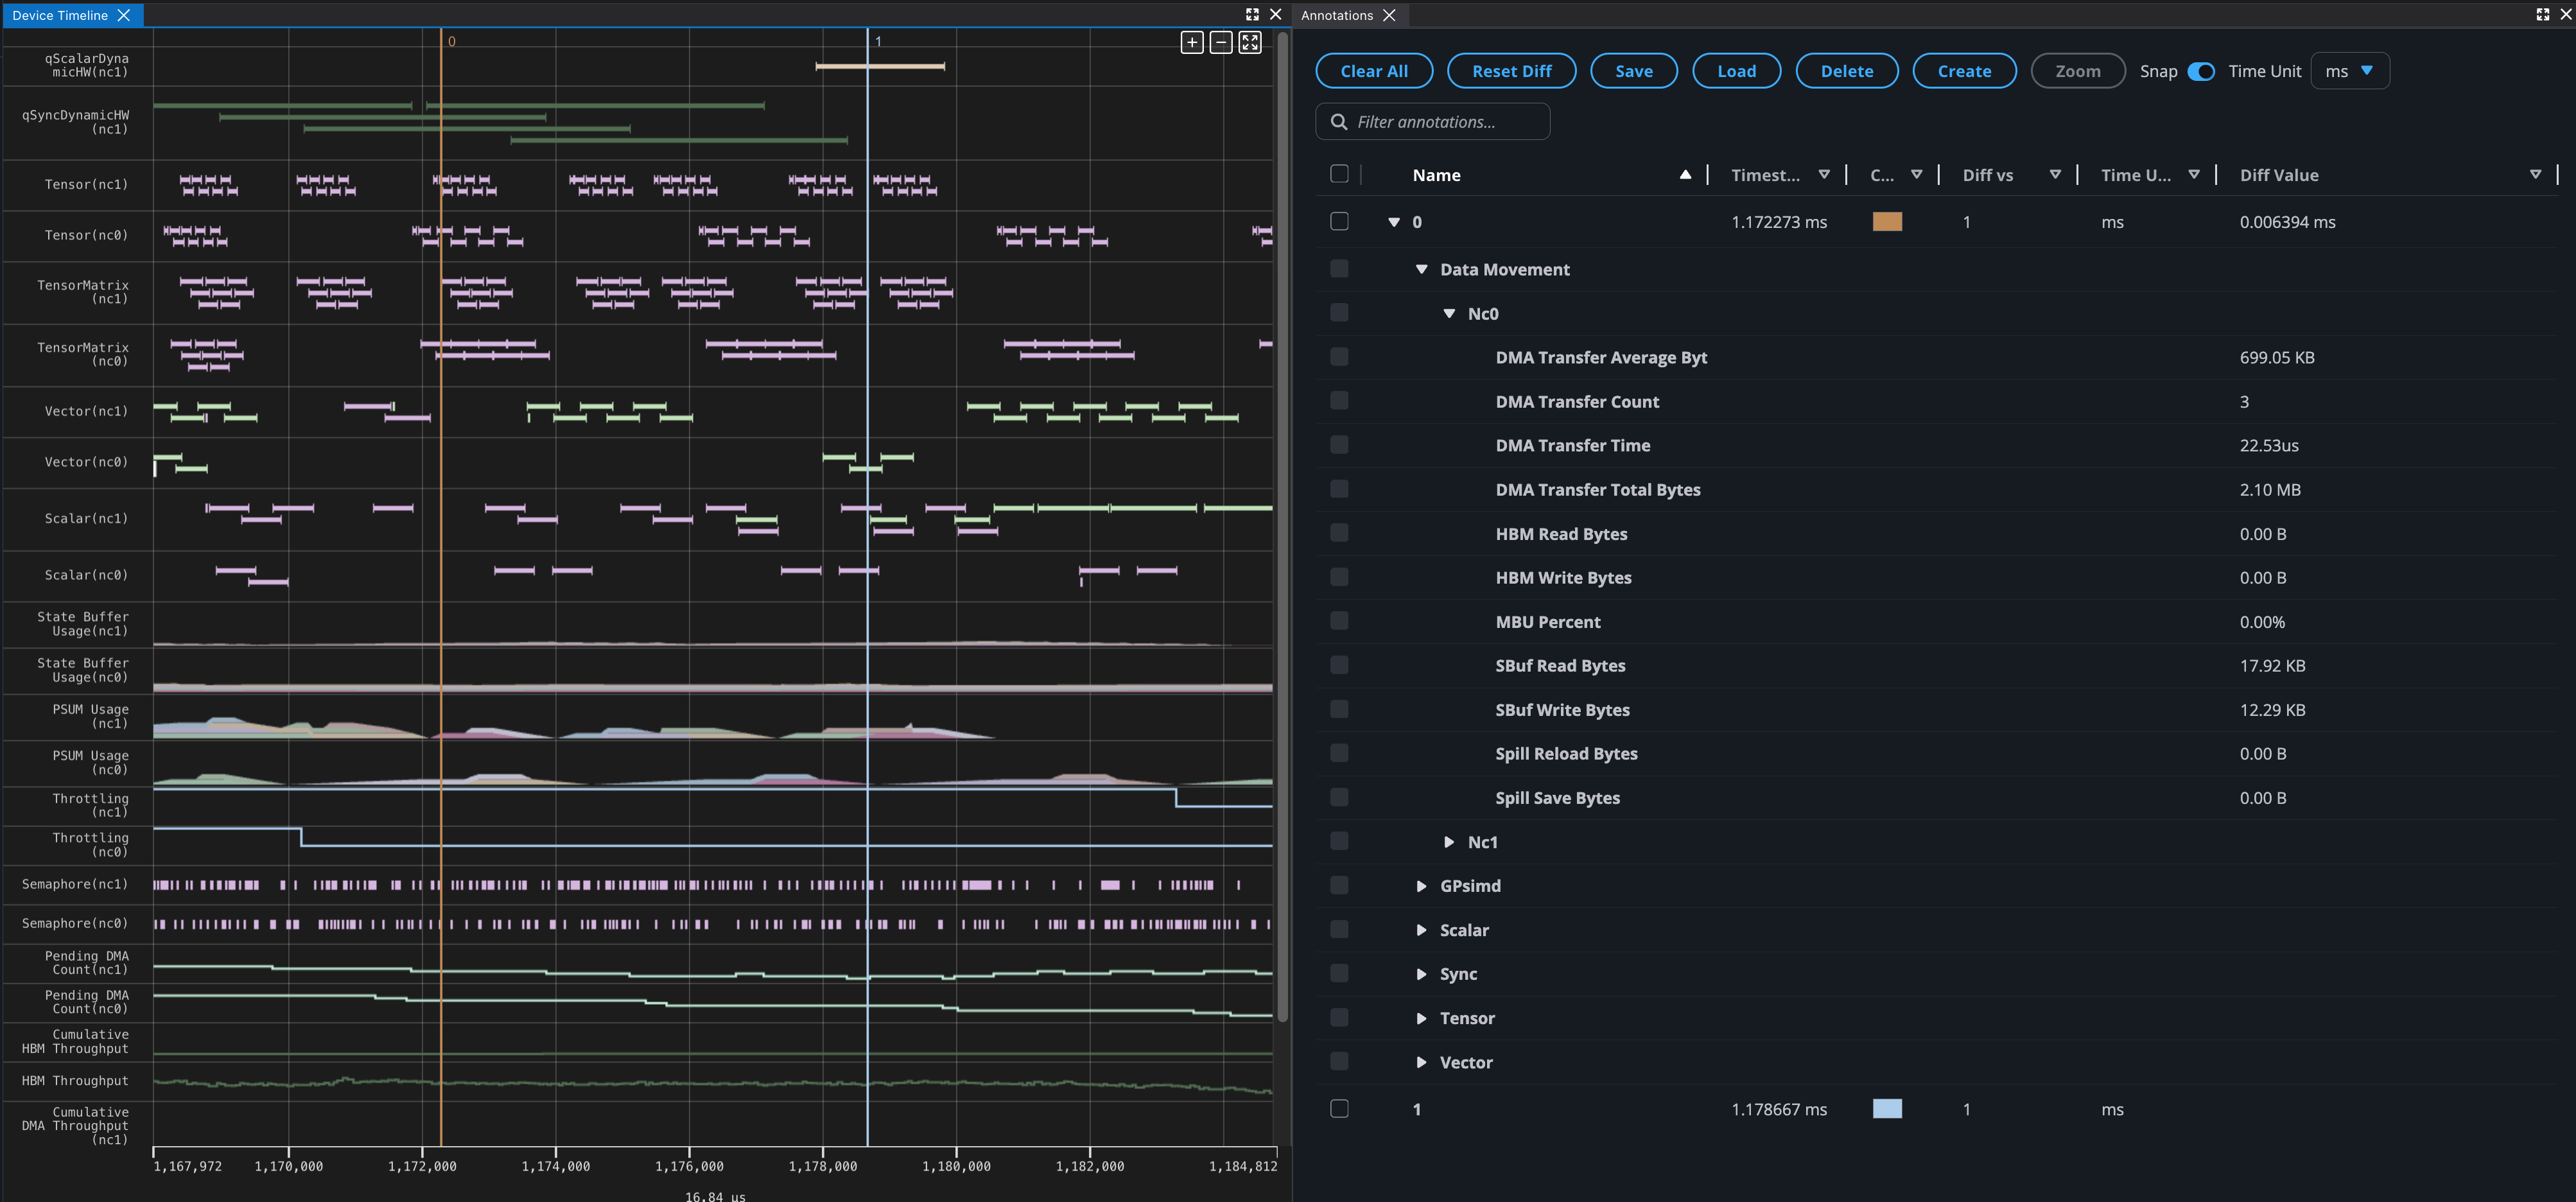
Annotations#
Users can create annotations by right-clicking in the Device Trace Viewer. These annotations can be moved by clicking and dragging the vertical line, and will snap to the closest events when applicable.
The annotations tab will show more details on all available annotations in the profile, such as the time difference and summary metrics that occur between two markers. The option of which two annotations to compare is configurable in the diff vs column. You can also quickly zoom in to the region between two annotations by selecting the checkbox on the left. Users can rename, delete, save, and load annotations for better readability and collaboration.
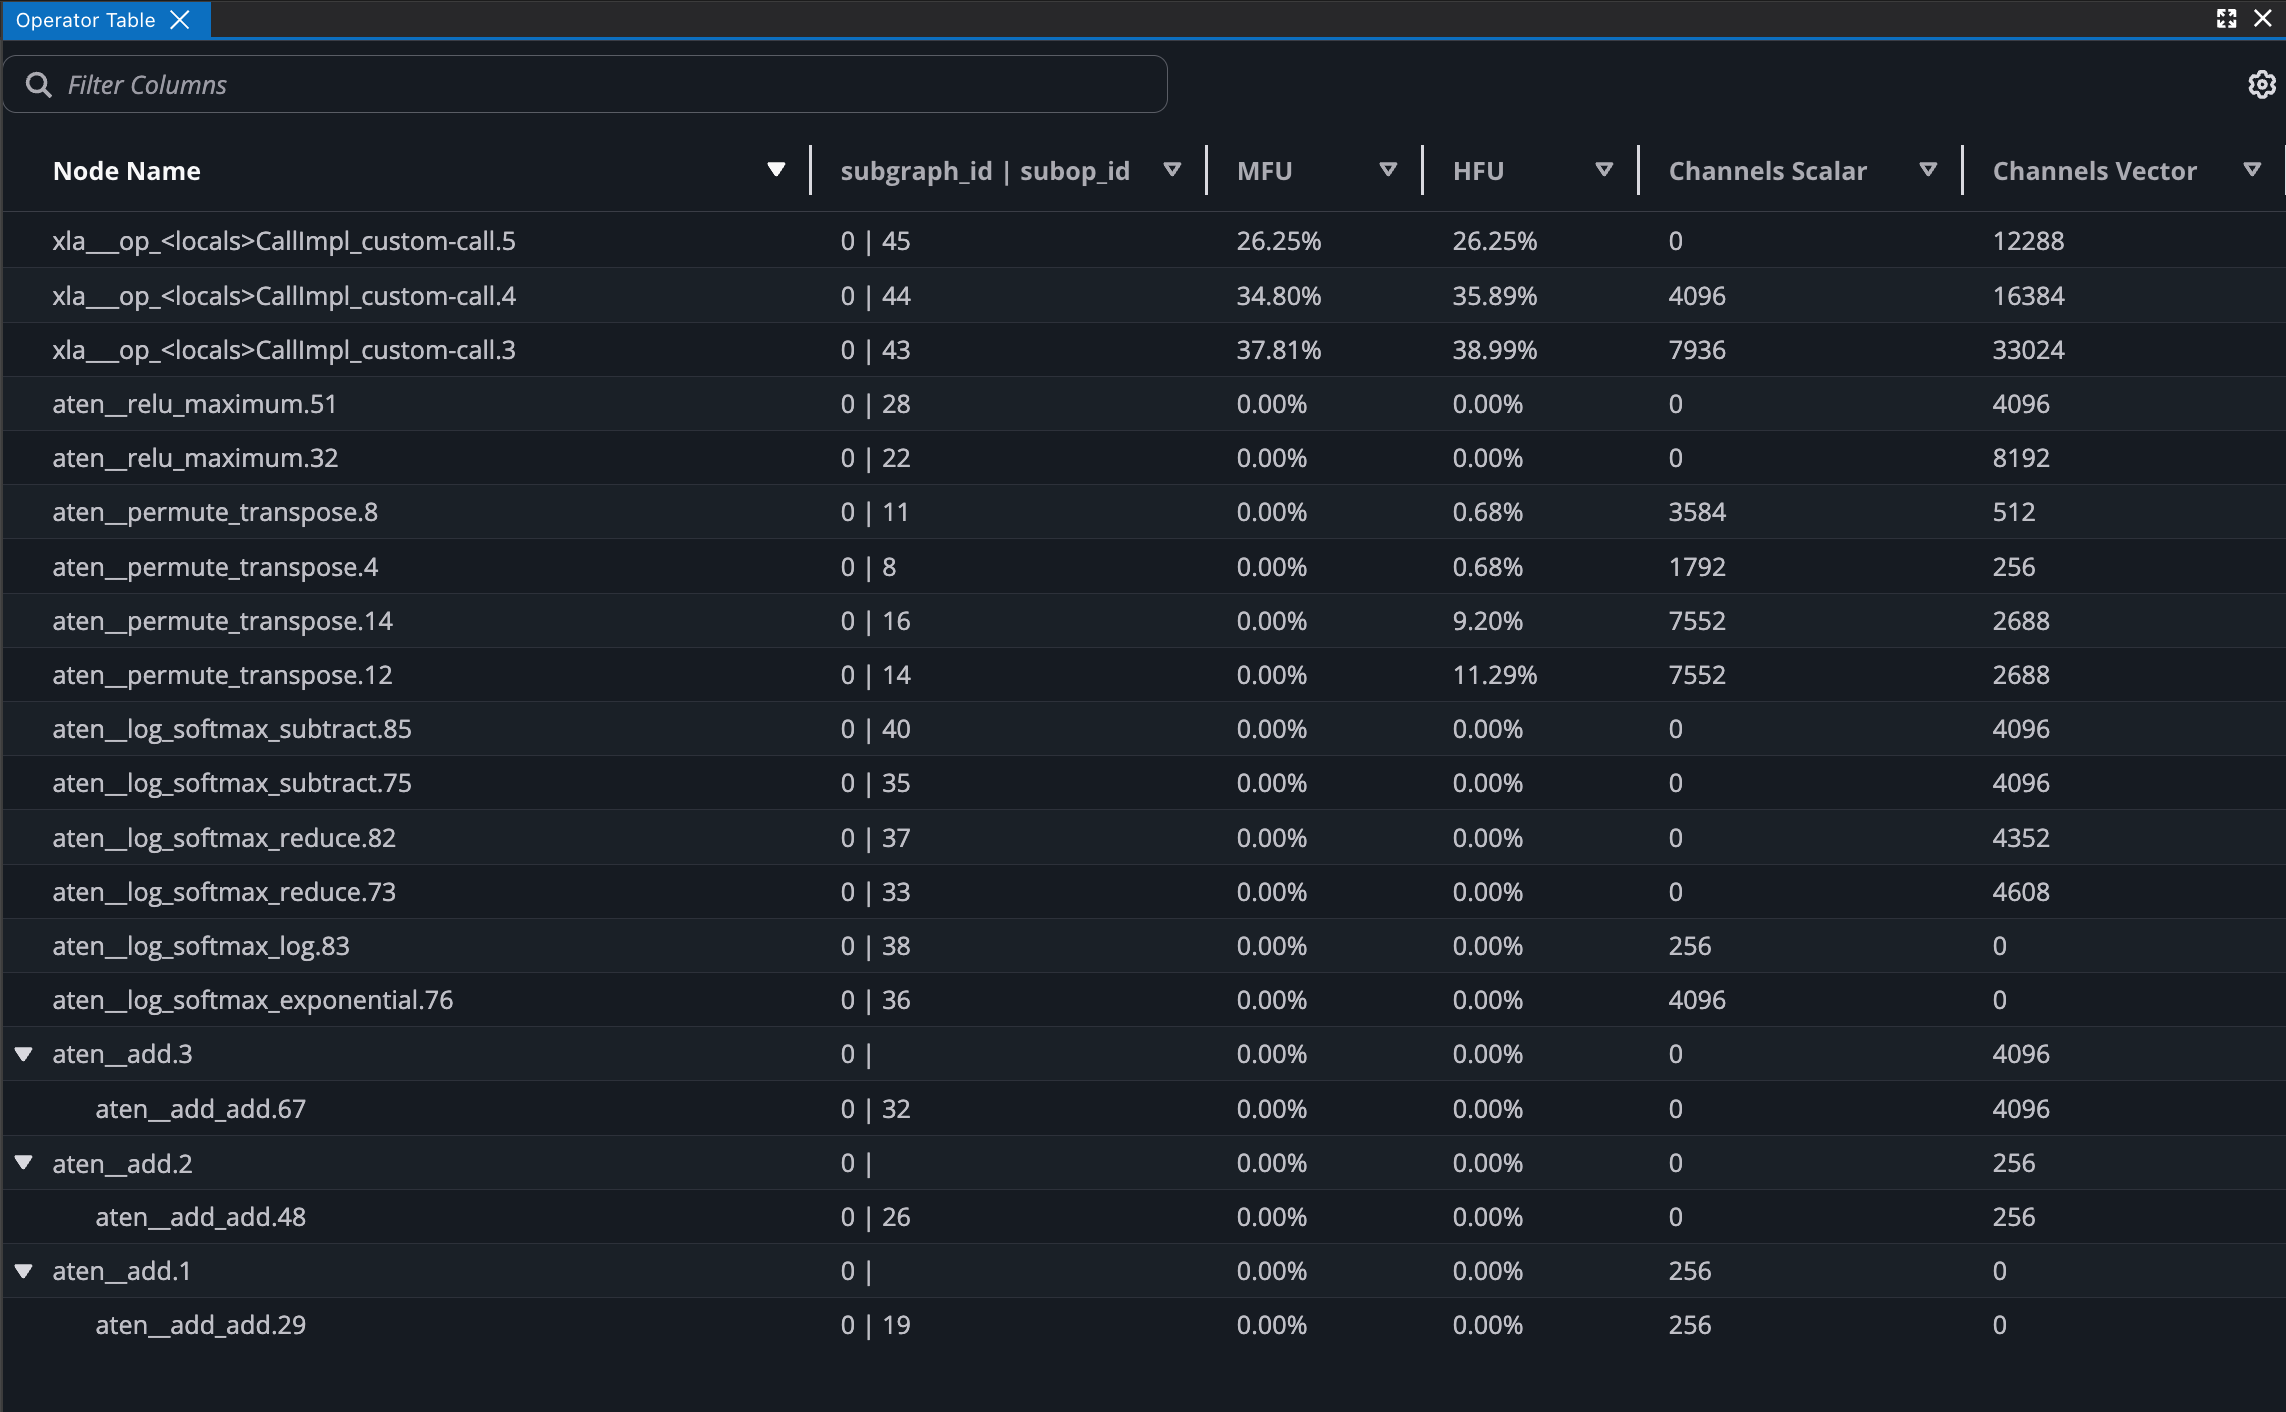
Operator Table#
The Operator Table aggregates the hardware level metrics into framework layers and operations, such as the MFU and amount of data being moved. Users can progressively expand each row to get a further breakdown of each nested operator.
Filters can be applied and columns can be sorted for more streamlined viewing.
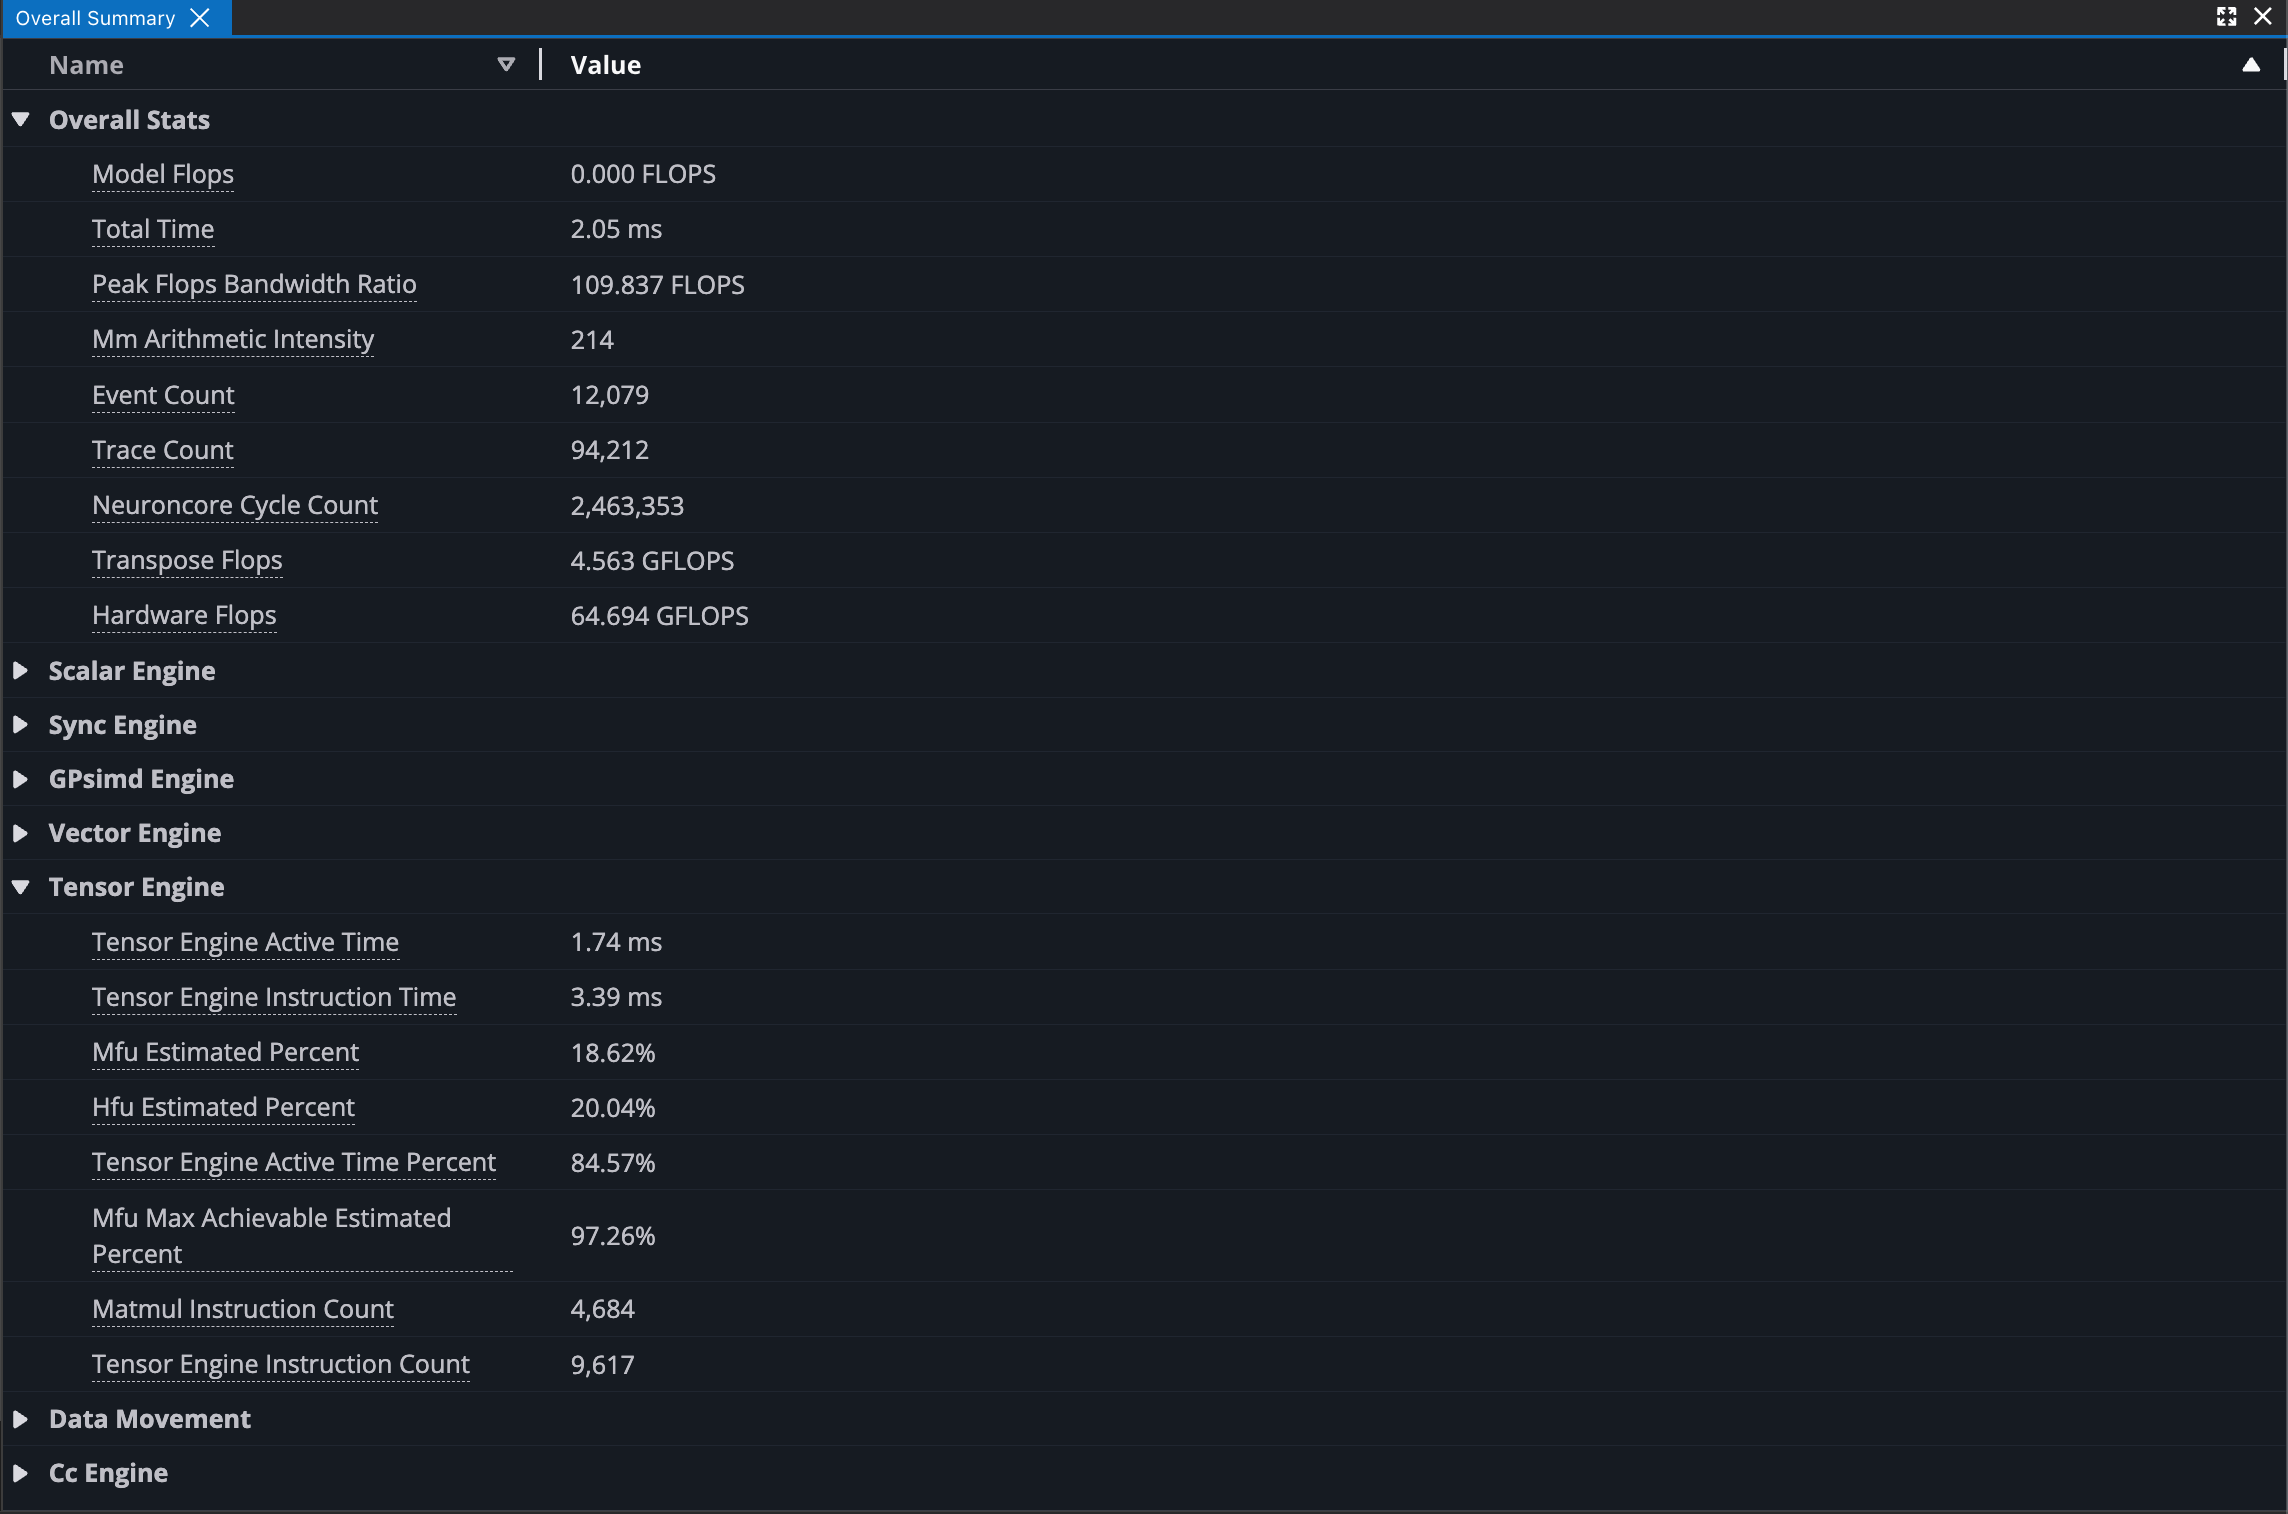
Overall Summary#
The Overall Summary displays performance metrics across the entire profile run, with metrics broken down into different categories such as by the NeuronCore engines. These can be used for quick insights into how well the model performed.
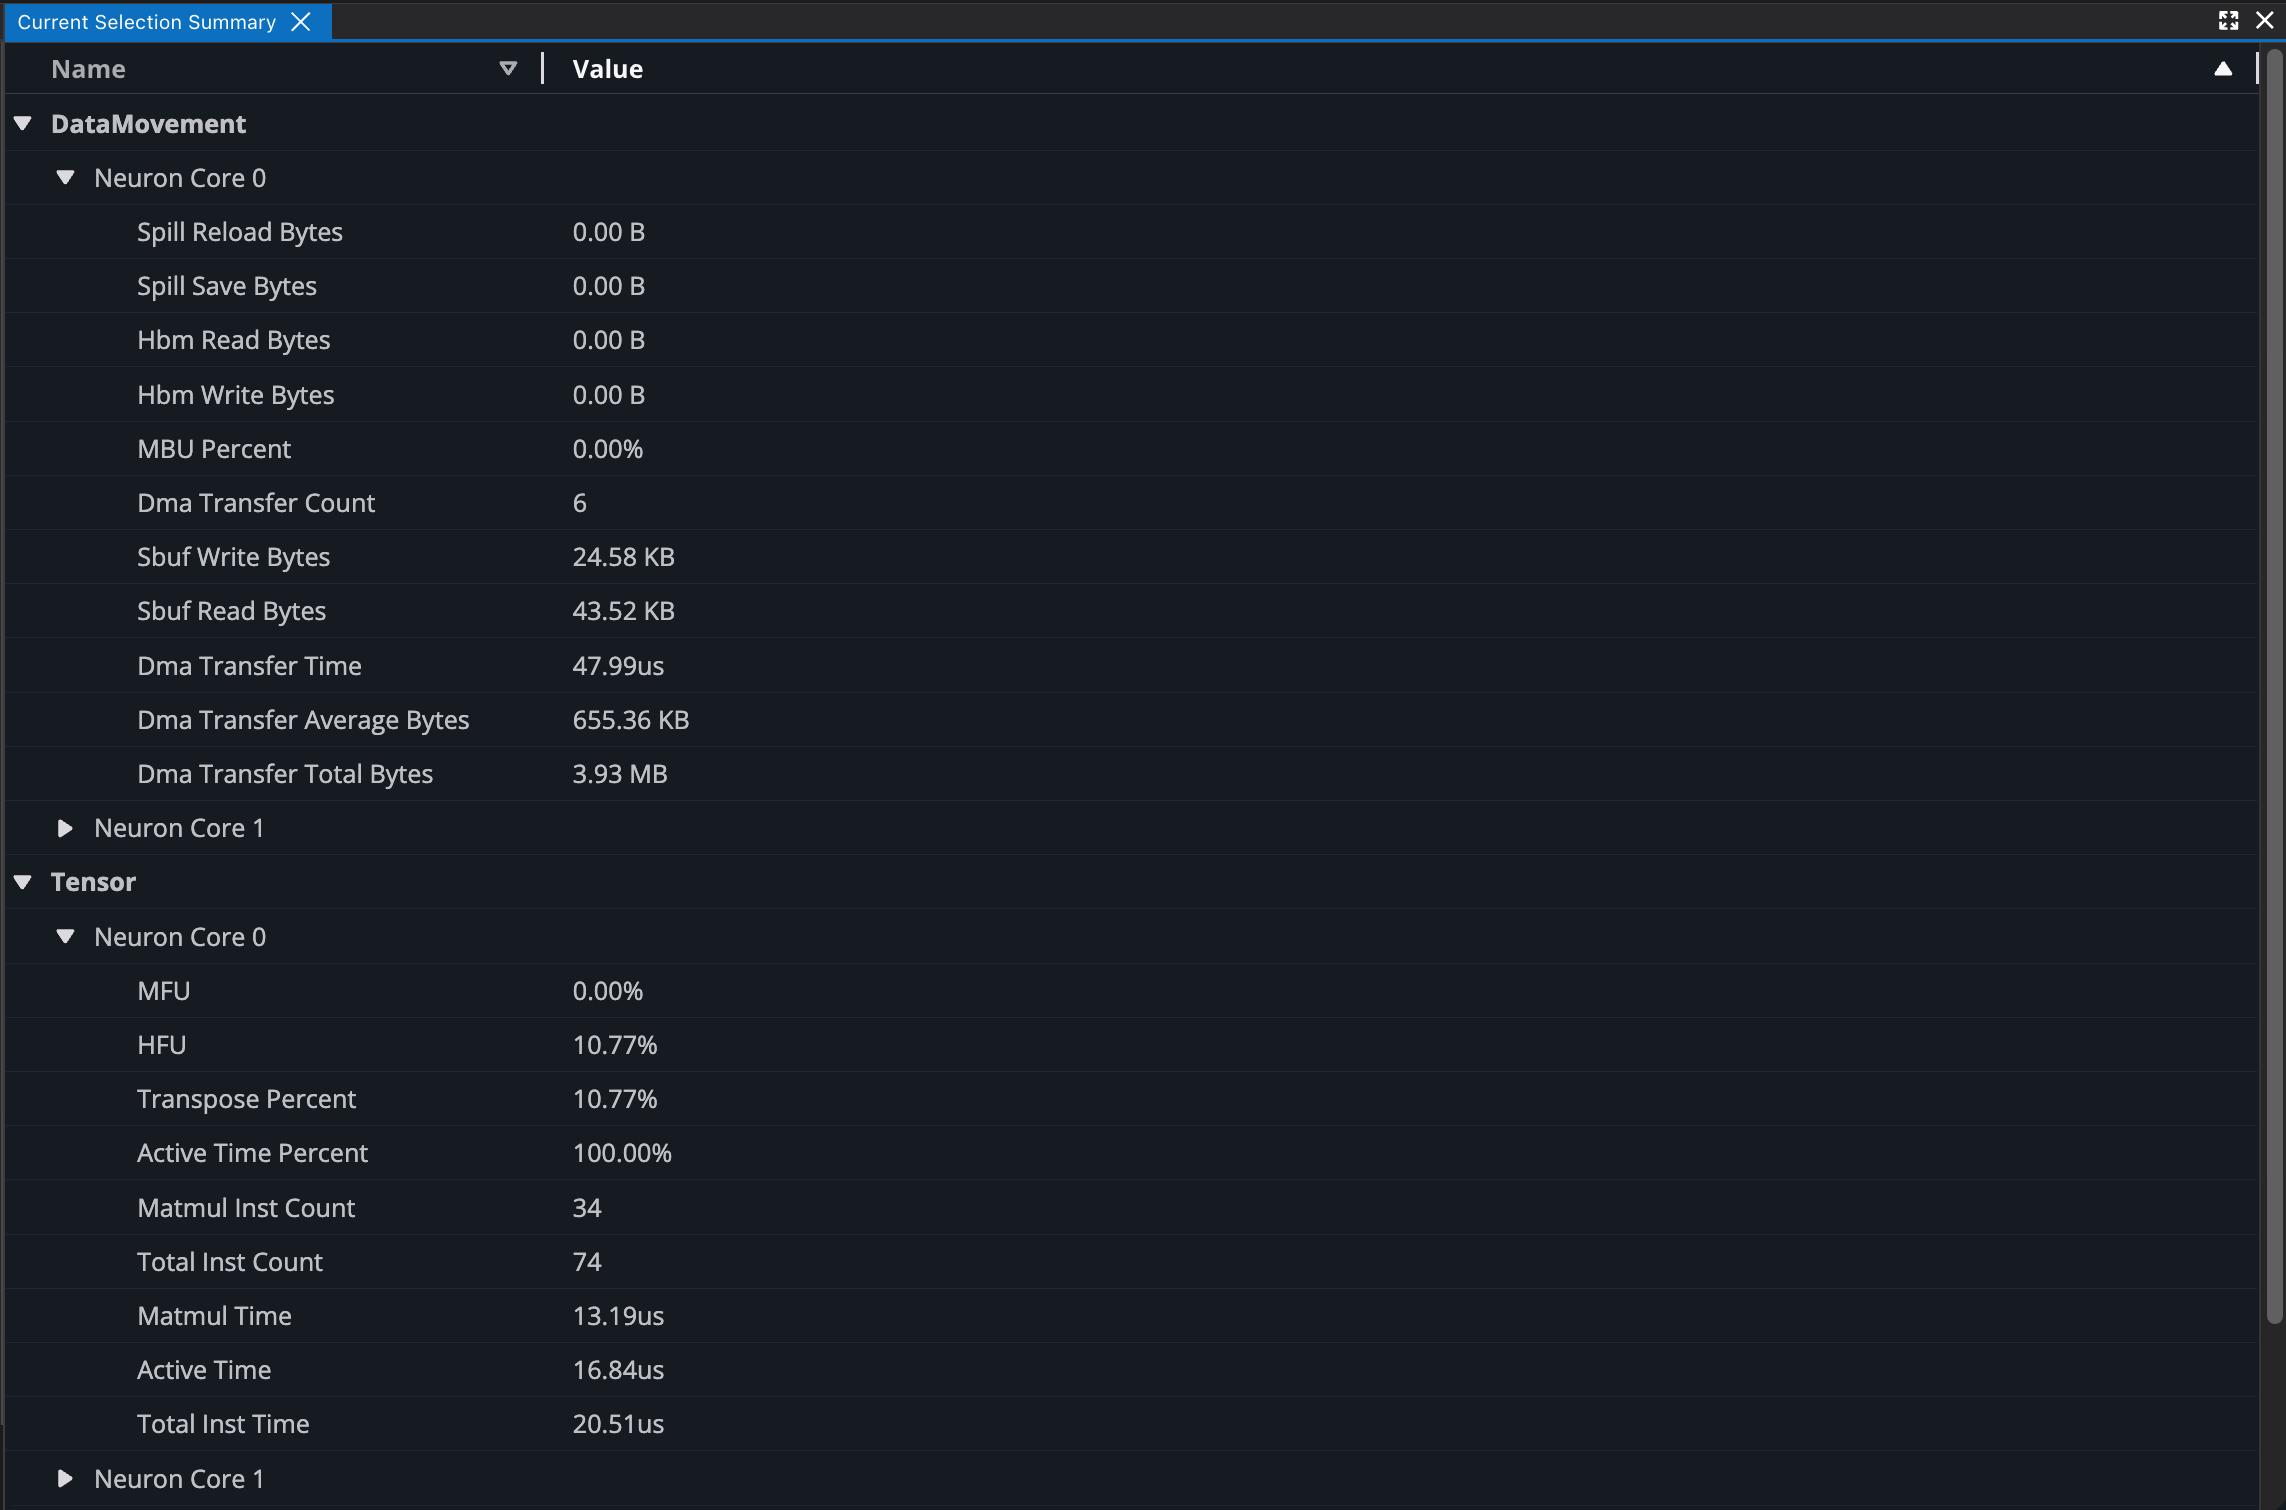
Current Selection Summary#
The Current Selection Summary provides metrics for the current time window. Zooming in and out in the Device Trace Viewer will update the summary. This can be used in conjunction with the zoom feature of Annotations for easy access to a region of interest.
Box Selection Summary#
The Box Selection Summary provides metrics within a bounding box region. Select and drag regions within the timeline widget to update the summary.
Box selection is supported in a couple of ways:
Toggling the box selection button within the timeline widget
Clear selection with esc key
Corresponding summary information of the selected region is displayed within the box selection widget.
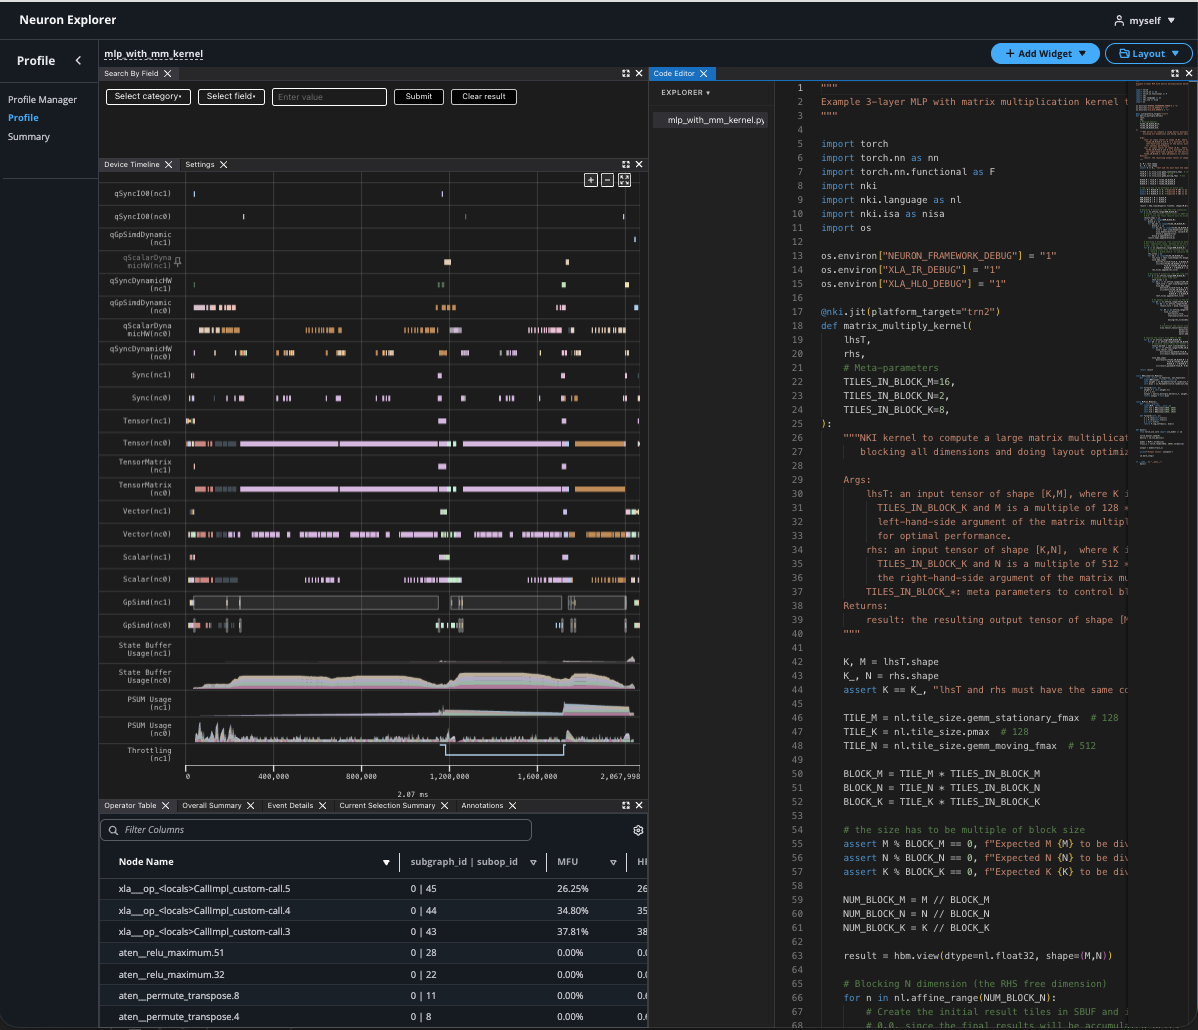
Code Viewer#
Profiles that are uploaded with source code files enable users to quickly navigate between NKI and application level source code and the corresponding hardware level instructions.
In the Device Trace Viewer, we can click on an event to highlight the source code line in the Code Viewer. A (Ctrl/Cmd) + click on the event will scroll to the corresponding source code line.
In the Code Viewer, clicking on a line in the source code will automatically highlight all associated events in the Device Trace Viewer. Similarly, highlighting multiple lines of the source code will also highlight all events in the timeline.
See Source Code Viewer for instructions on how to enable source code viewing.
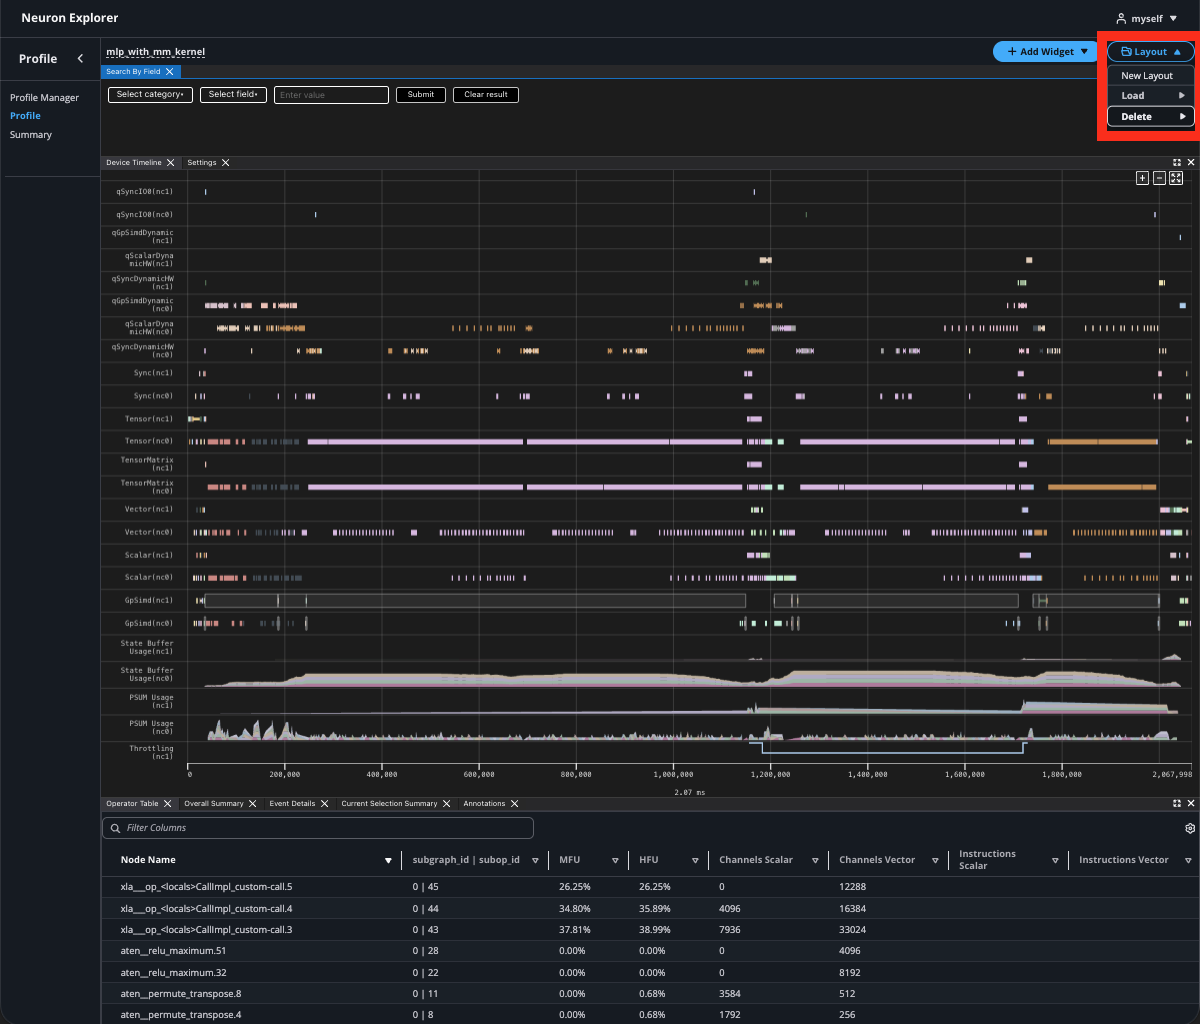
Layout Customization#
Understanding and optimizing performance with the profiler can be overwhelming given the amount of information being processed and displayed. As part of preparing for optimization work, you can cross-reference different information, such as the Device Trace Viewer with the application source code. With the widget-based UI, you can customize the layout to best fit a specific workflow. Each widget can be added, removed, dragged around, and resized. Once you are happy with the layout, you can save it through the Layout dropdown at the top right. The layouts are not tied to a specific profile, so they can be loaded and re-used for future profiles as well.
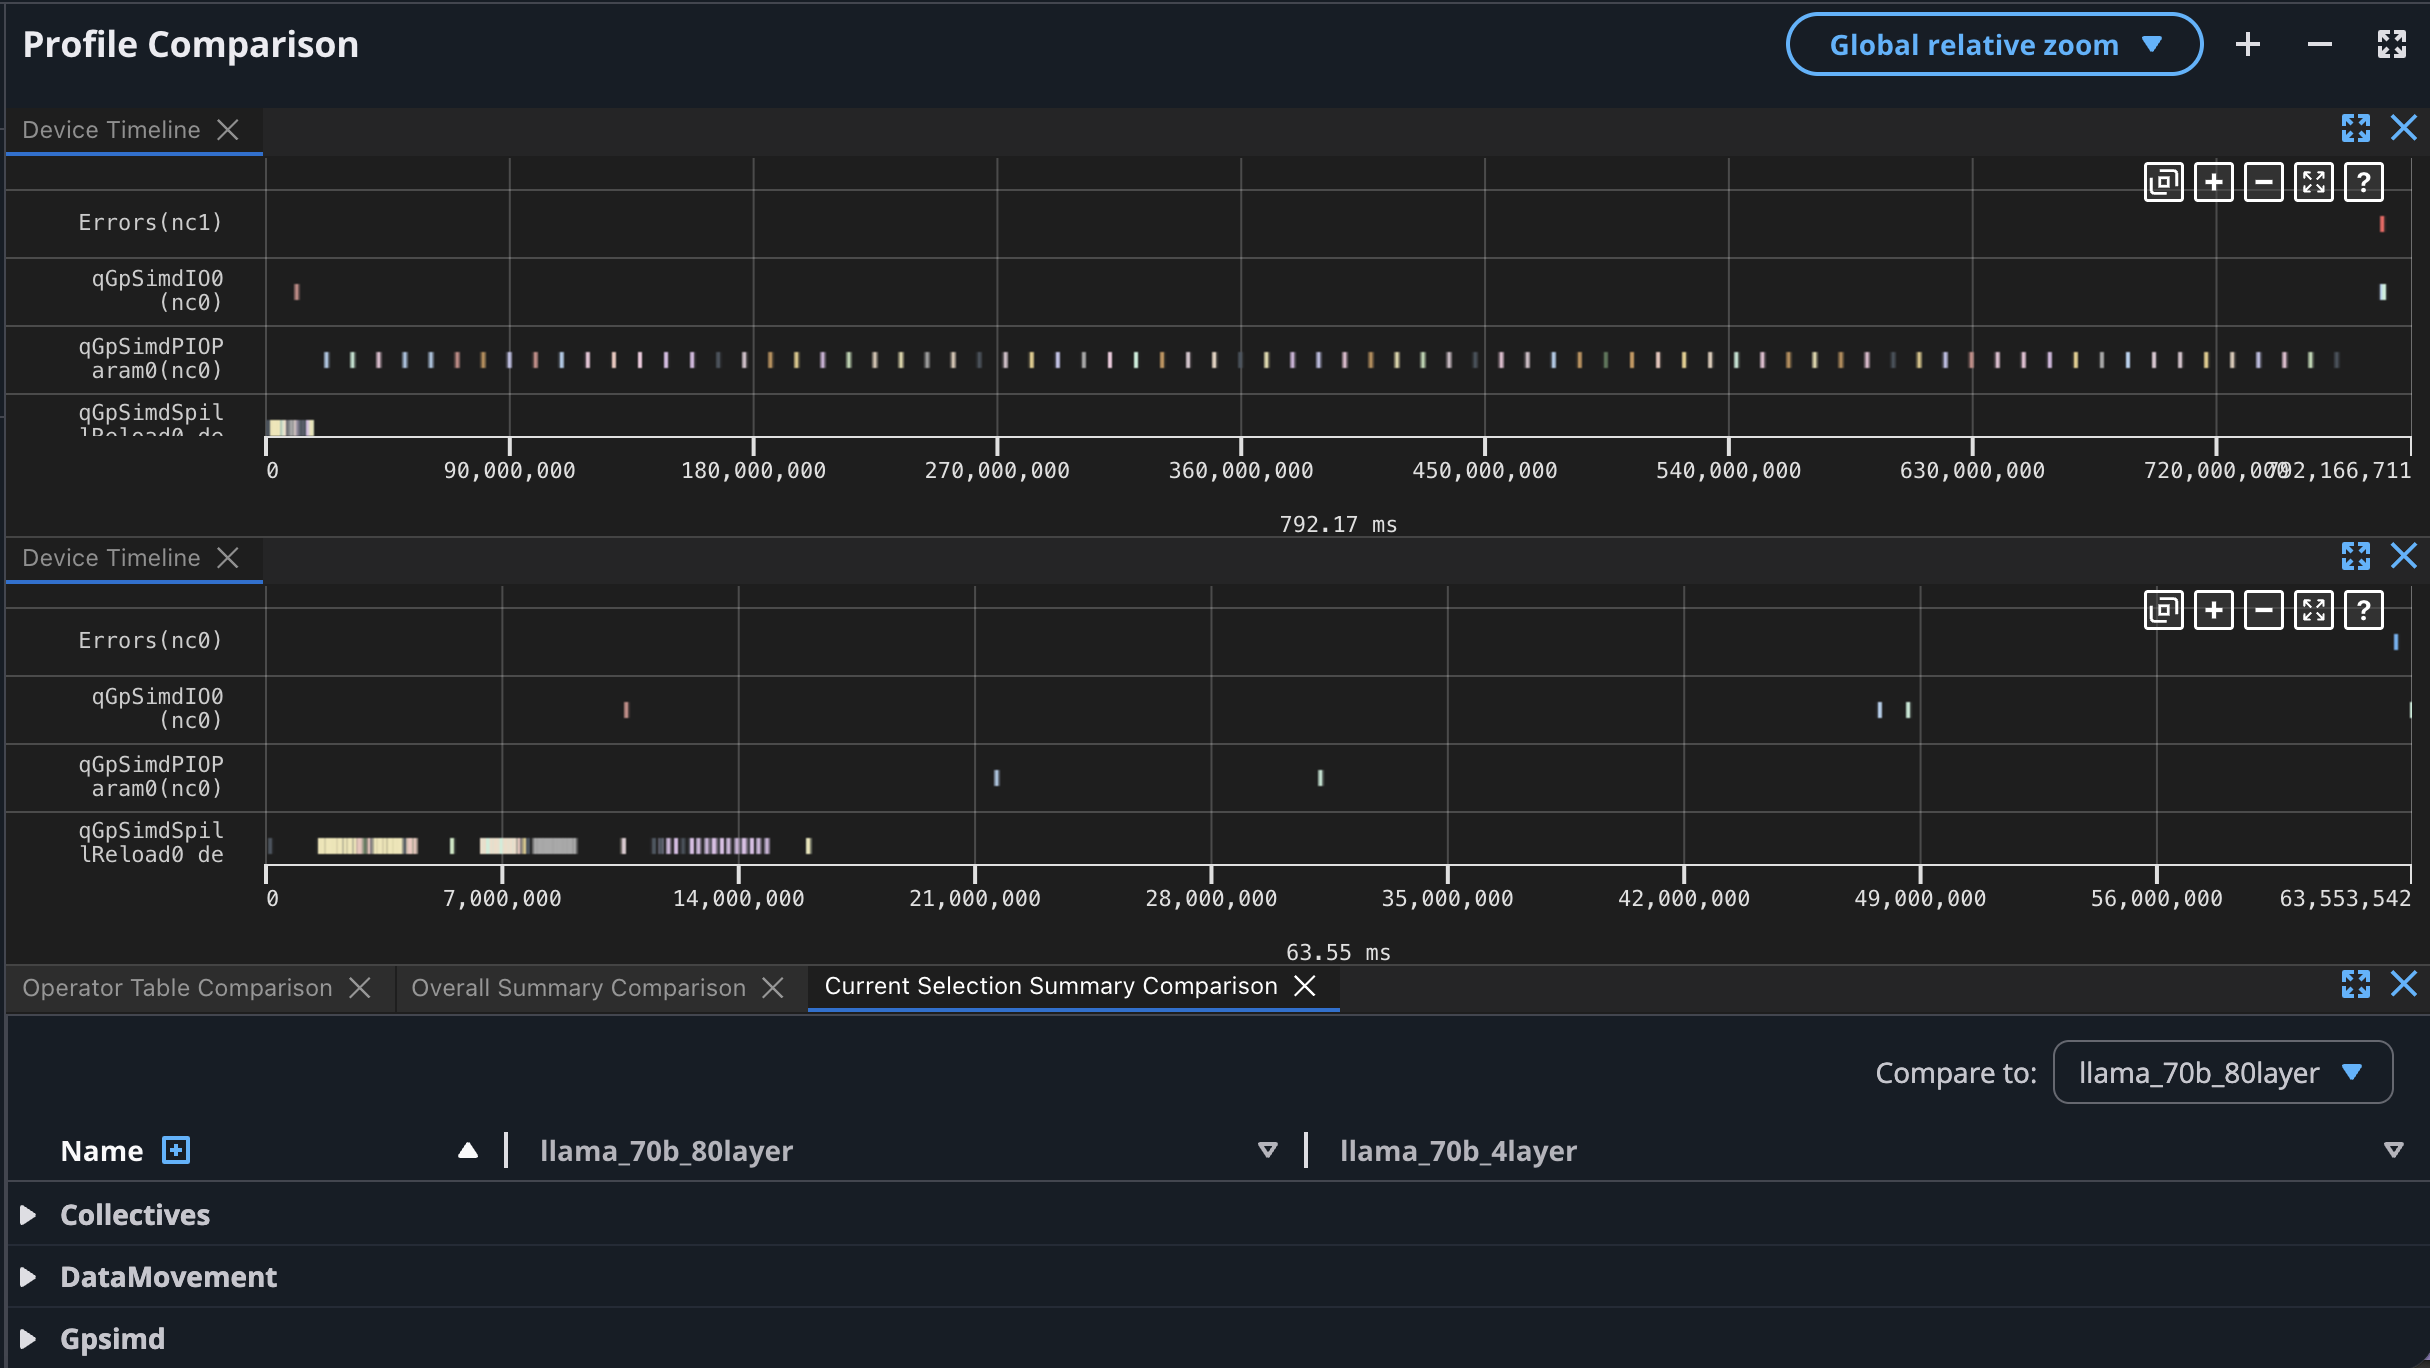
Profile Comparison#
Profile Comparison lets you view two or more device profiles side by side to identify performance differences between runs — for example, before and after an optimization, across different compiler flags, or between model variants.
How to compare profiles#
Ensure you have two or more processed device profiles in the Profile Manager before starting.
In the Profile Manager, select two or more device profiles using the checkboxes.
Click Actions → Compare profiles. Neuron Explorer opens the comparison view with each profile’s device timeline stacked vertically and comparison widgets below.
To return to single-profile view, navigate back to the Profile Manager.
Comparison view layout#
The comparison view contains:
Stacked timelines — One device timeline per profile, arranged vertically for visual comparison of execution patterns.
Compare Operator Table — Aggregates operator-level metrics (execution time, FLOPs) across profiles with inline deltas showing improvement or regression.
Compare Overall Summary — Compares high-level metrics such as engine utilization, throttle counts, and opcode breakdown.
Compare Current Selection Summary — Compares metrics for the currently zoomed time range across all profiles.
In comparison tables, select a base profile using the dropdown. All other profiles display delta values relative to the base, so you can see which operations improved or regressed.
Global zoom modes keep timelines aligned:
Global relative zoom — Zoom in and out proportionally to all timelines.
Global absolute zoom — Zoom to an exact nanosecond range across all timelines.
Synchronized time range — Set a specific start and end time (absolute or percentage) to all timelines simultaneously.
This document is relevant for: Inf1, Inf2, Trn1, Trn2, Trn3