
This document is relevant for: Inf1, Inf2, Trn1, Trn2, Trn3
Memory Viewer#
The Memory Viewer in Neuron Explorer offers deep, low-level insight into memory allocation, usage patterns, and potential inefficiencies — going well beyond surface-level metrics. With comprehensive visibility into how memory is consumed across the device, it enables kernel and performance engineers to make informed optimization decisions, reduce debugging time, and improve overall system performance.
Enable Memory Viewer during Profile Upload#
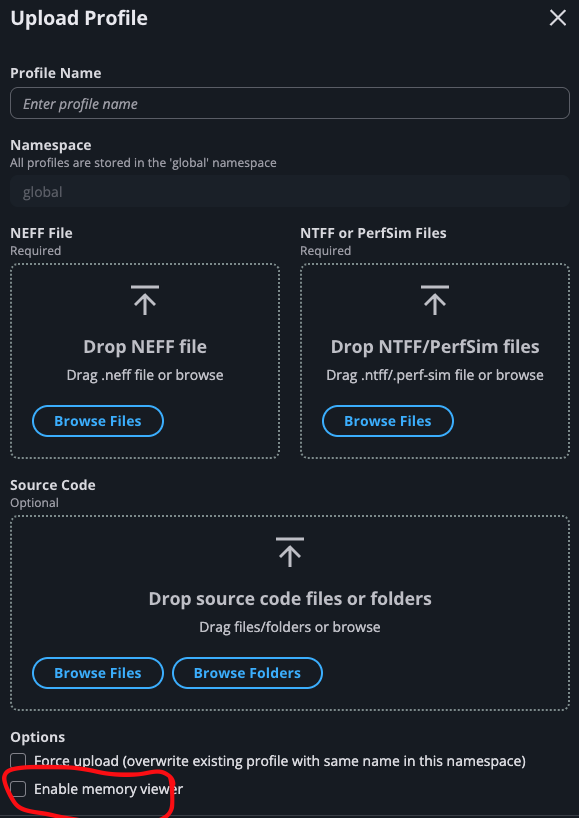
To enable the Memory Viewer feature, check the option ‘Enable Memory Viewer’ when you upload your profile:
View the Memory Viewer Widget#
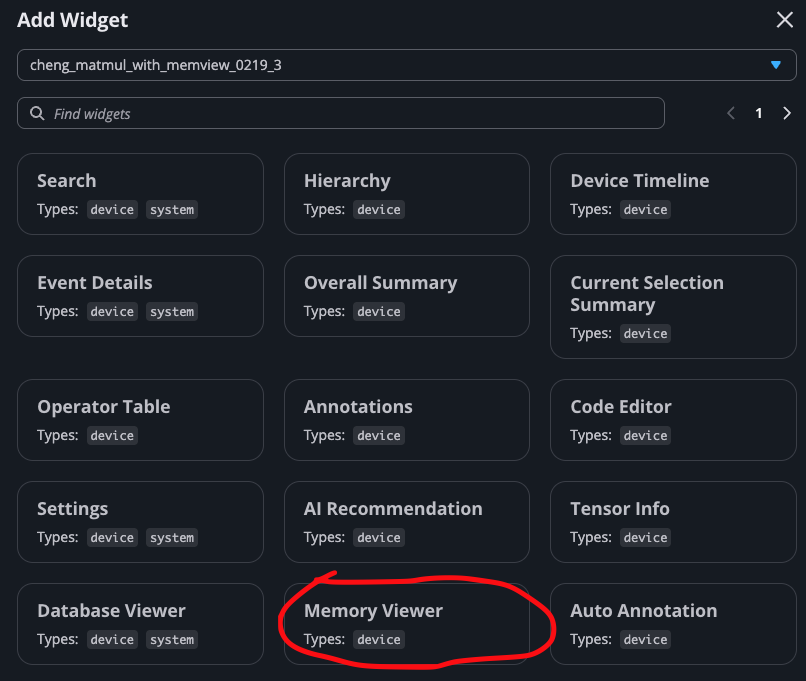
Once your profile finishes processing and is ready to view, click the Add Widget button and select ‘Memory Viewer’:
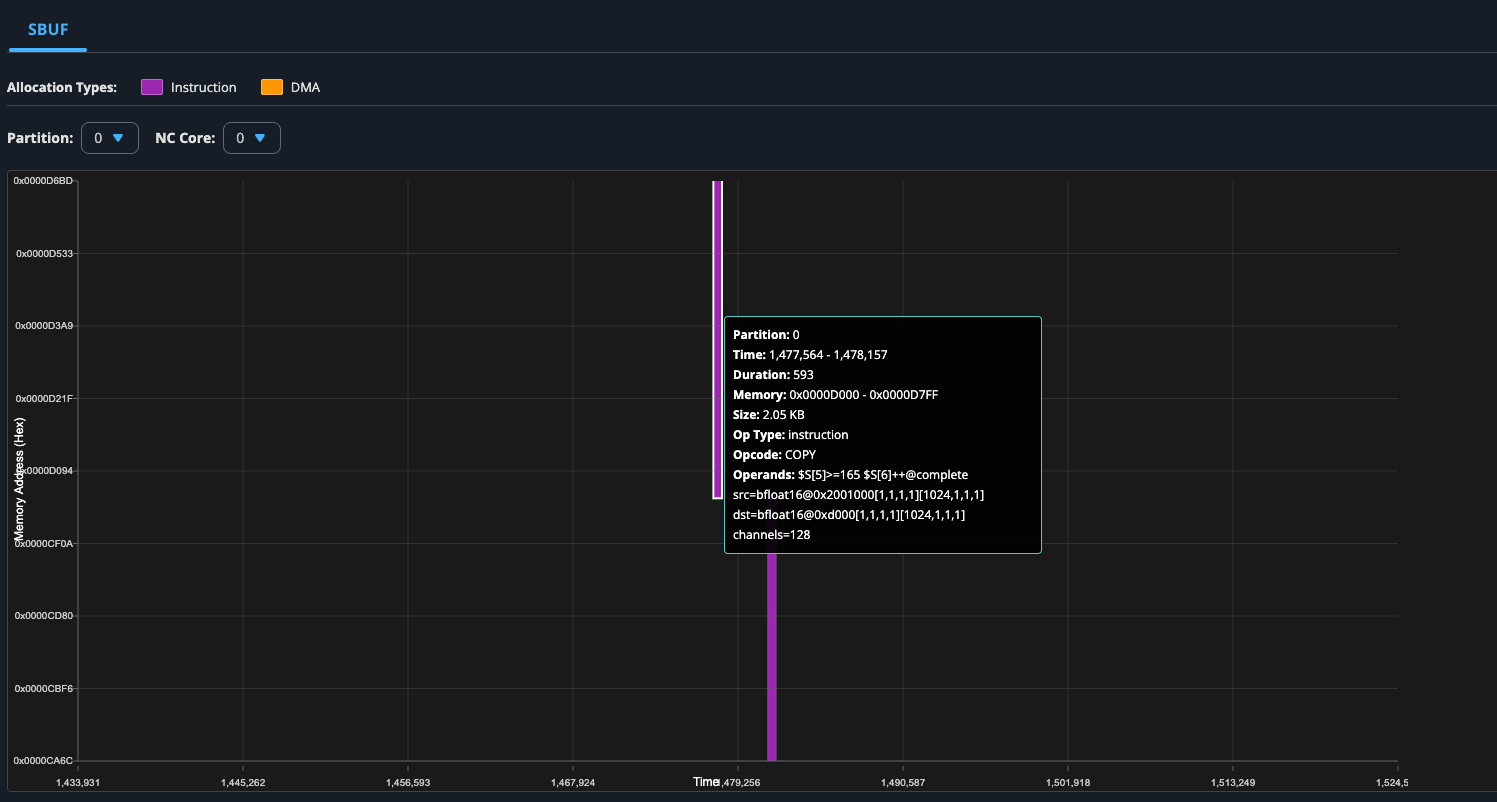
By hovering your mouse over each allocation, you can see the detailed information about this allocation. For allocations triggered by instructions, hover information includes: * Start time and end time * Duration * Start address and end address * Opcode * Operands
For allocations triggered by DMAs, hover information includes: * Partition number * Start time and end time * Duration * Start address and end address * DMA queue name * Block ID
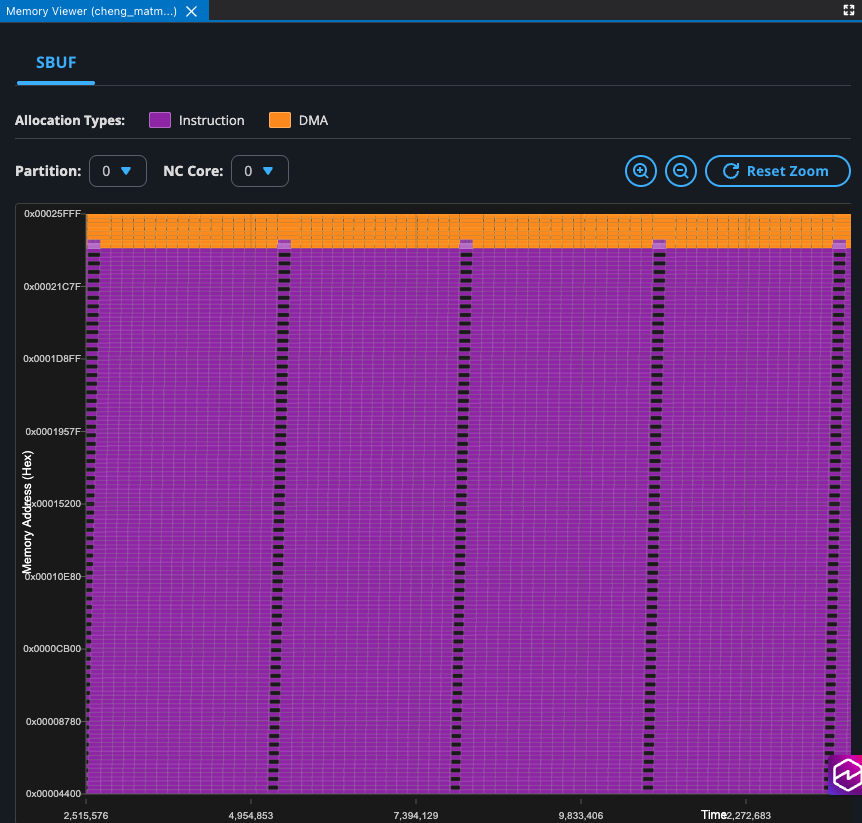
By analyzing memory allocations, you can address memory fragmentation by identifying sparse allocation patterns and potentially rescheduling instructions or DMAs to different addresses to maintain memory compactness. Additionally, you can perform spill/reload analysis to identify opportunities for reducing spills by relocating allocations to available space at alternative addresses.
You can also use the dropdown menu to inspect the memory allocations on different partitions and NC cores:
This document is relevant for: Inf1, Inf2, Trn1, Trn2, Trn3