
This document is relevant for: Inf1, Inf2, Trn1, Trn2, Trn3
Hierarchy Viewer#
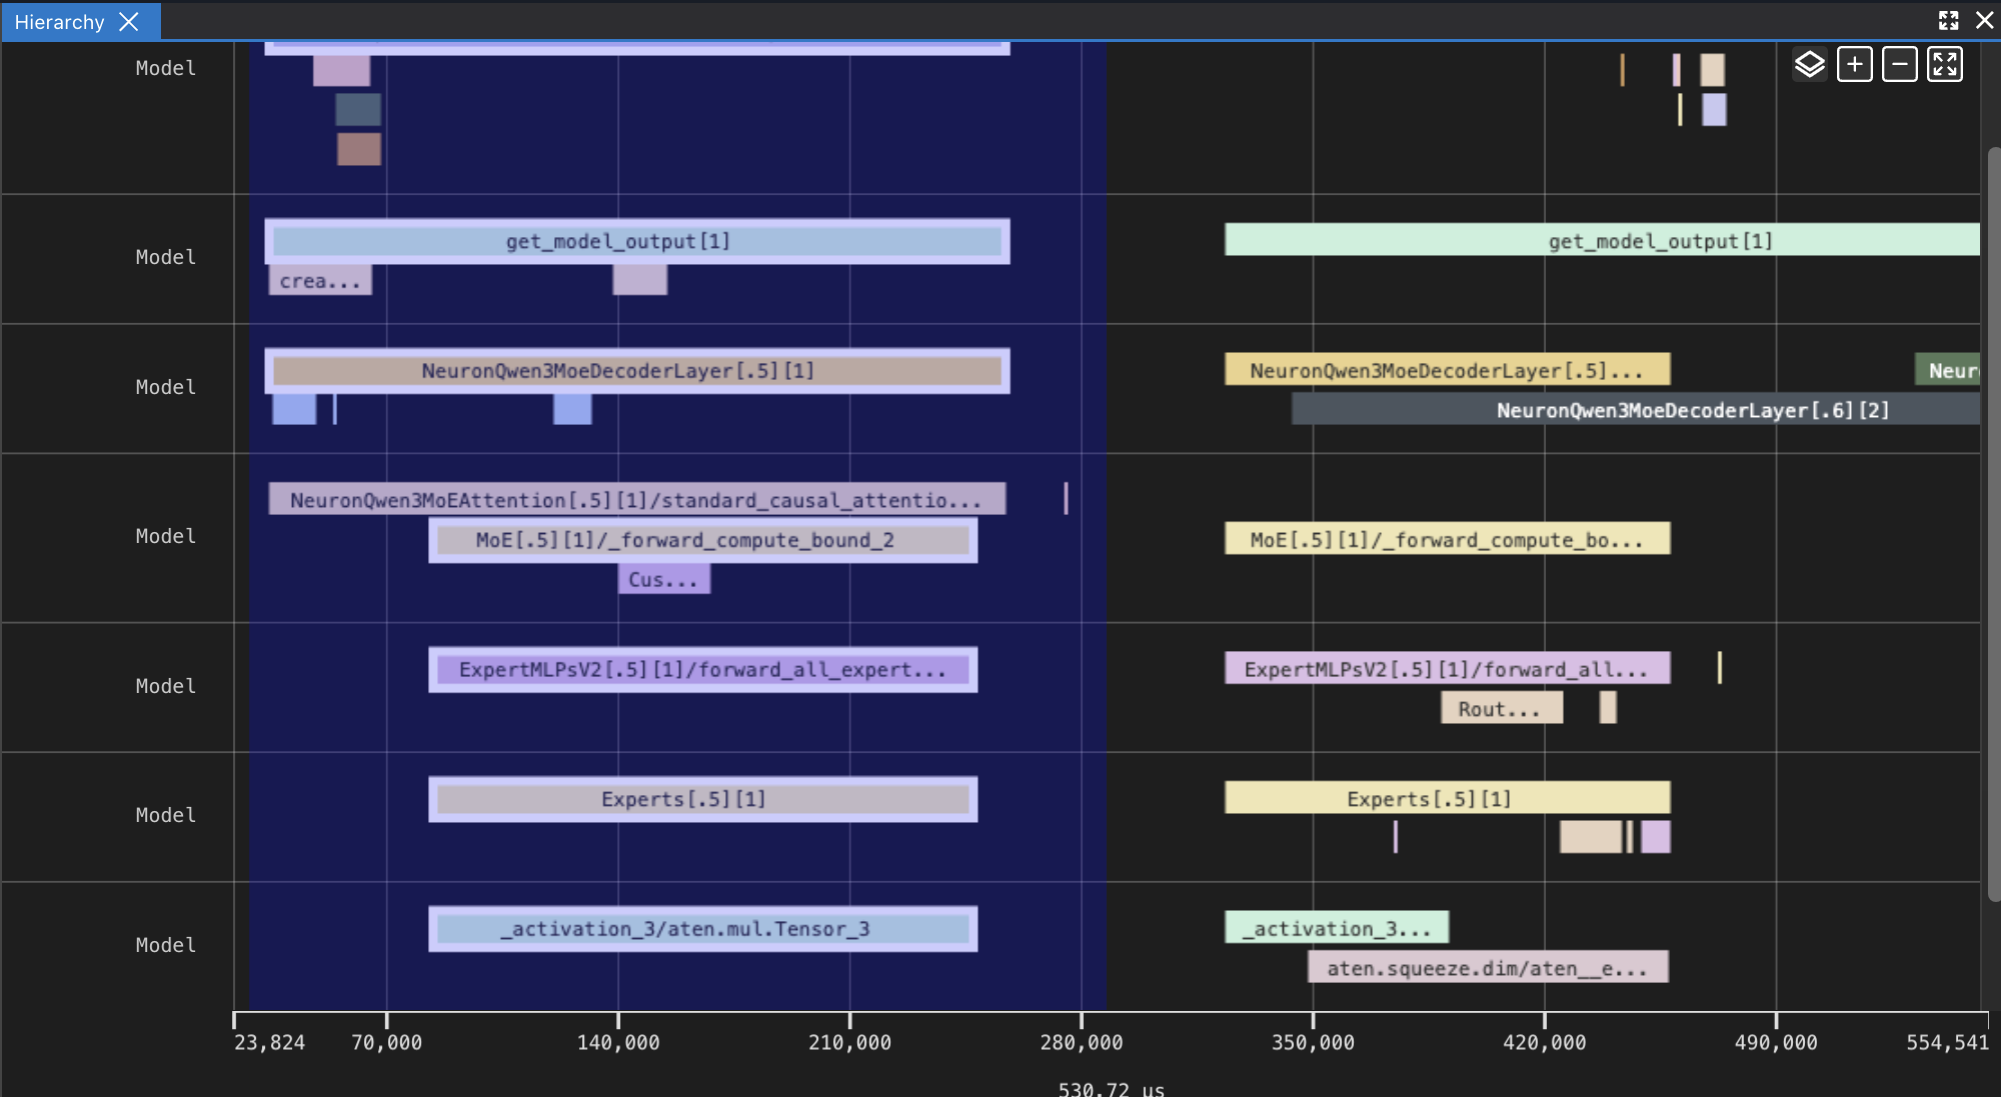
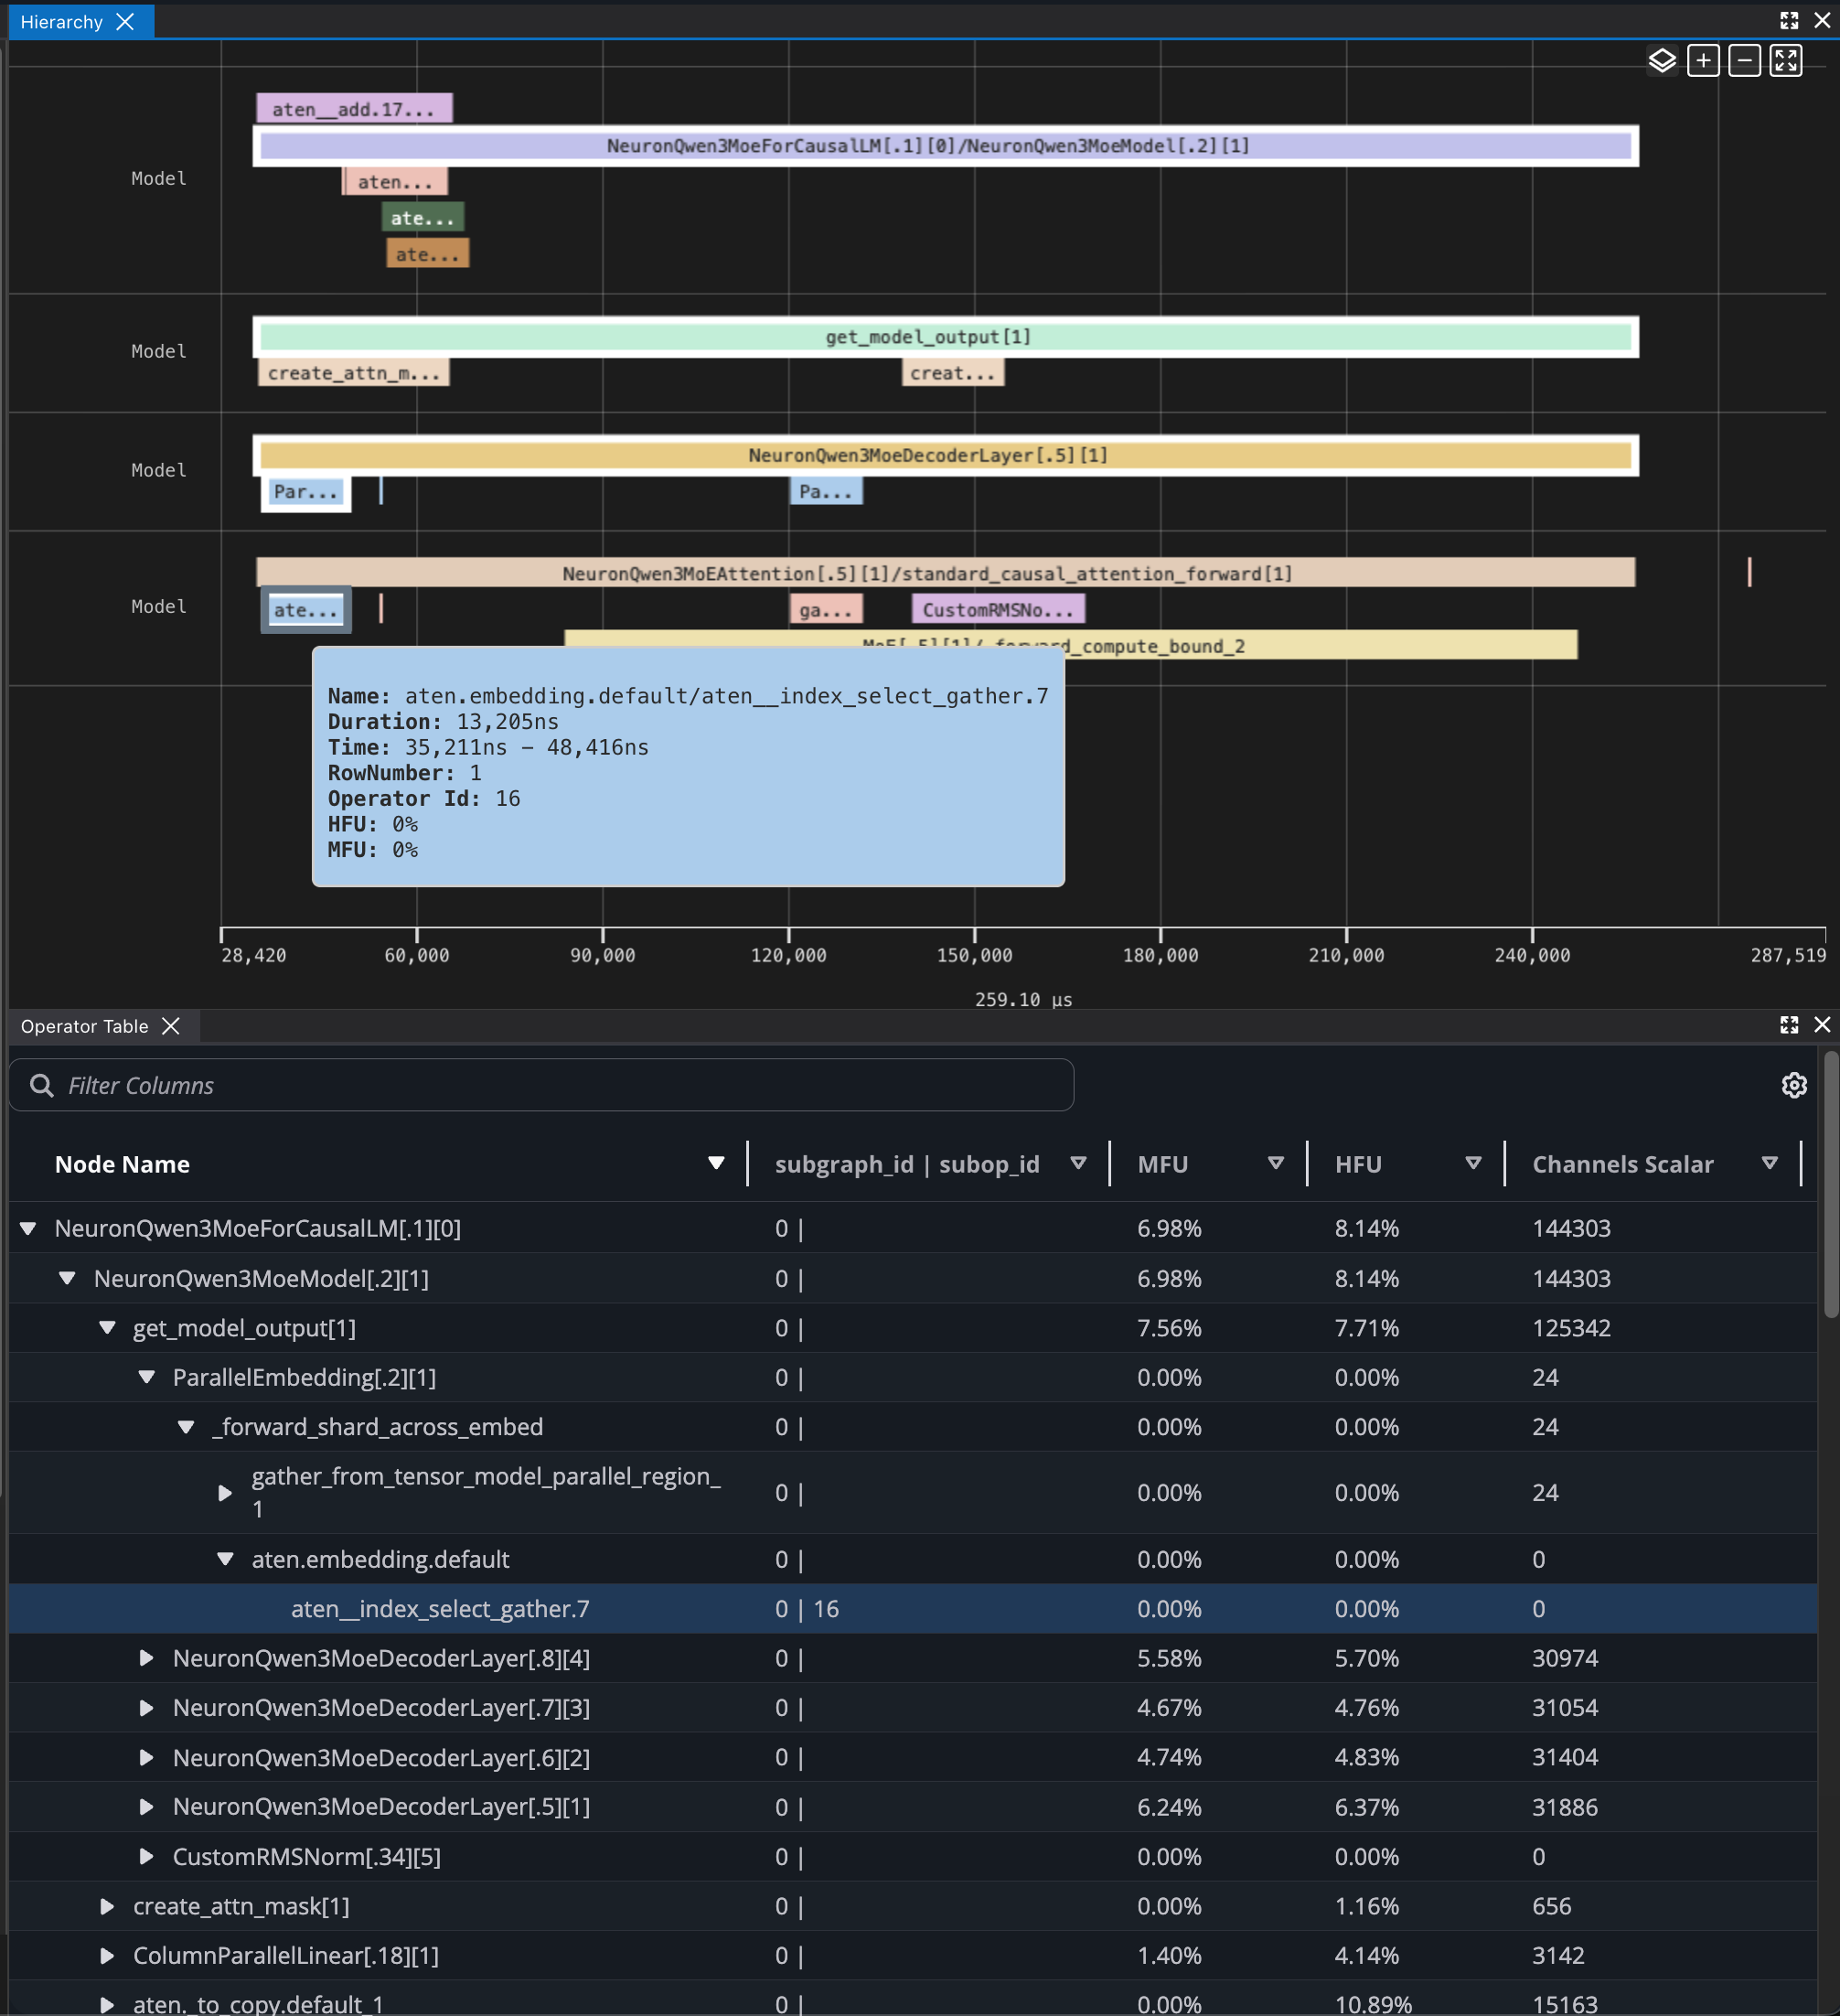
The Hierarchy Viewer shows an up-leveled representation of the hardware execution organized by the framework layers and HLO operations. It enables you to progressively drill down into nested layers or operators and map the execution of application level constructs to the Neuron device. This view interacts with other tools such as the Device Trace Viewer.
Zooming#
You can zoom in on the Hierarchy Viewer in a couple of ways:
Click-drag your mouse across the graph (support in both directions)
Scroll down using your mouse wheel, with the mouse cursor on the x-axis
Zoom in and out buttons in the top-right corner
With the keyboard:
W and S for zooming in and out, respectively
Up and down arrow keys for zooming in and out, respectively
To zoom out, simply scroll up with your mouse wheel when you place your mouse cursor on the x-axis.
Highlighting#
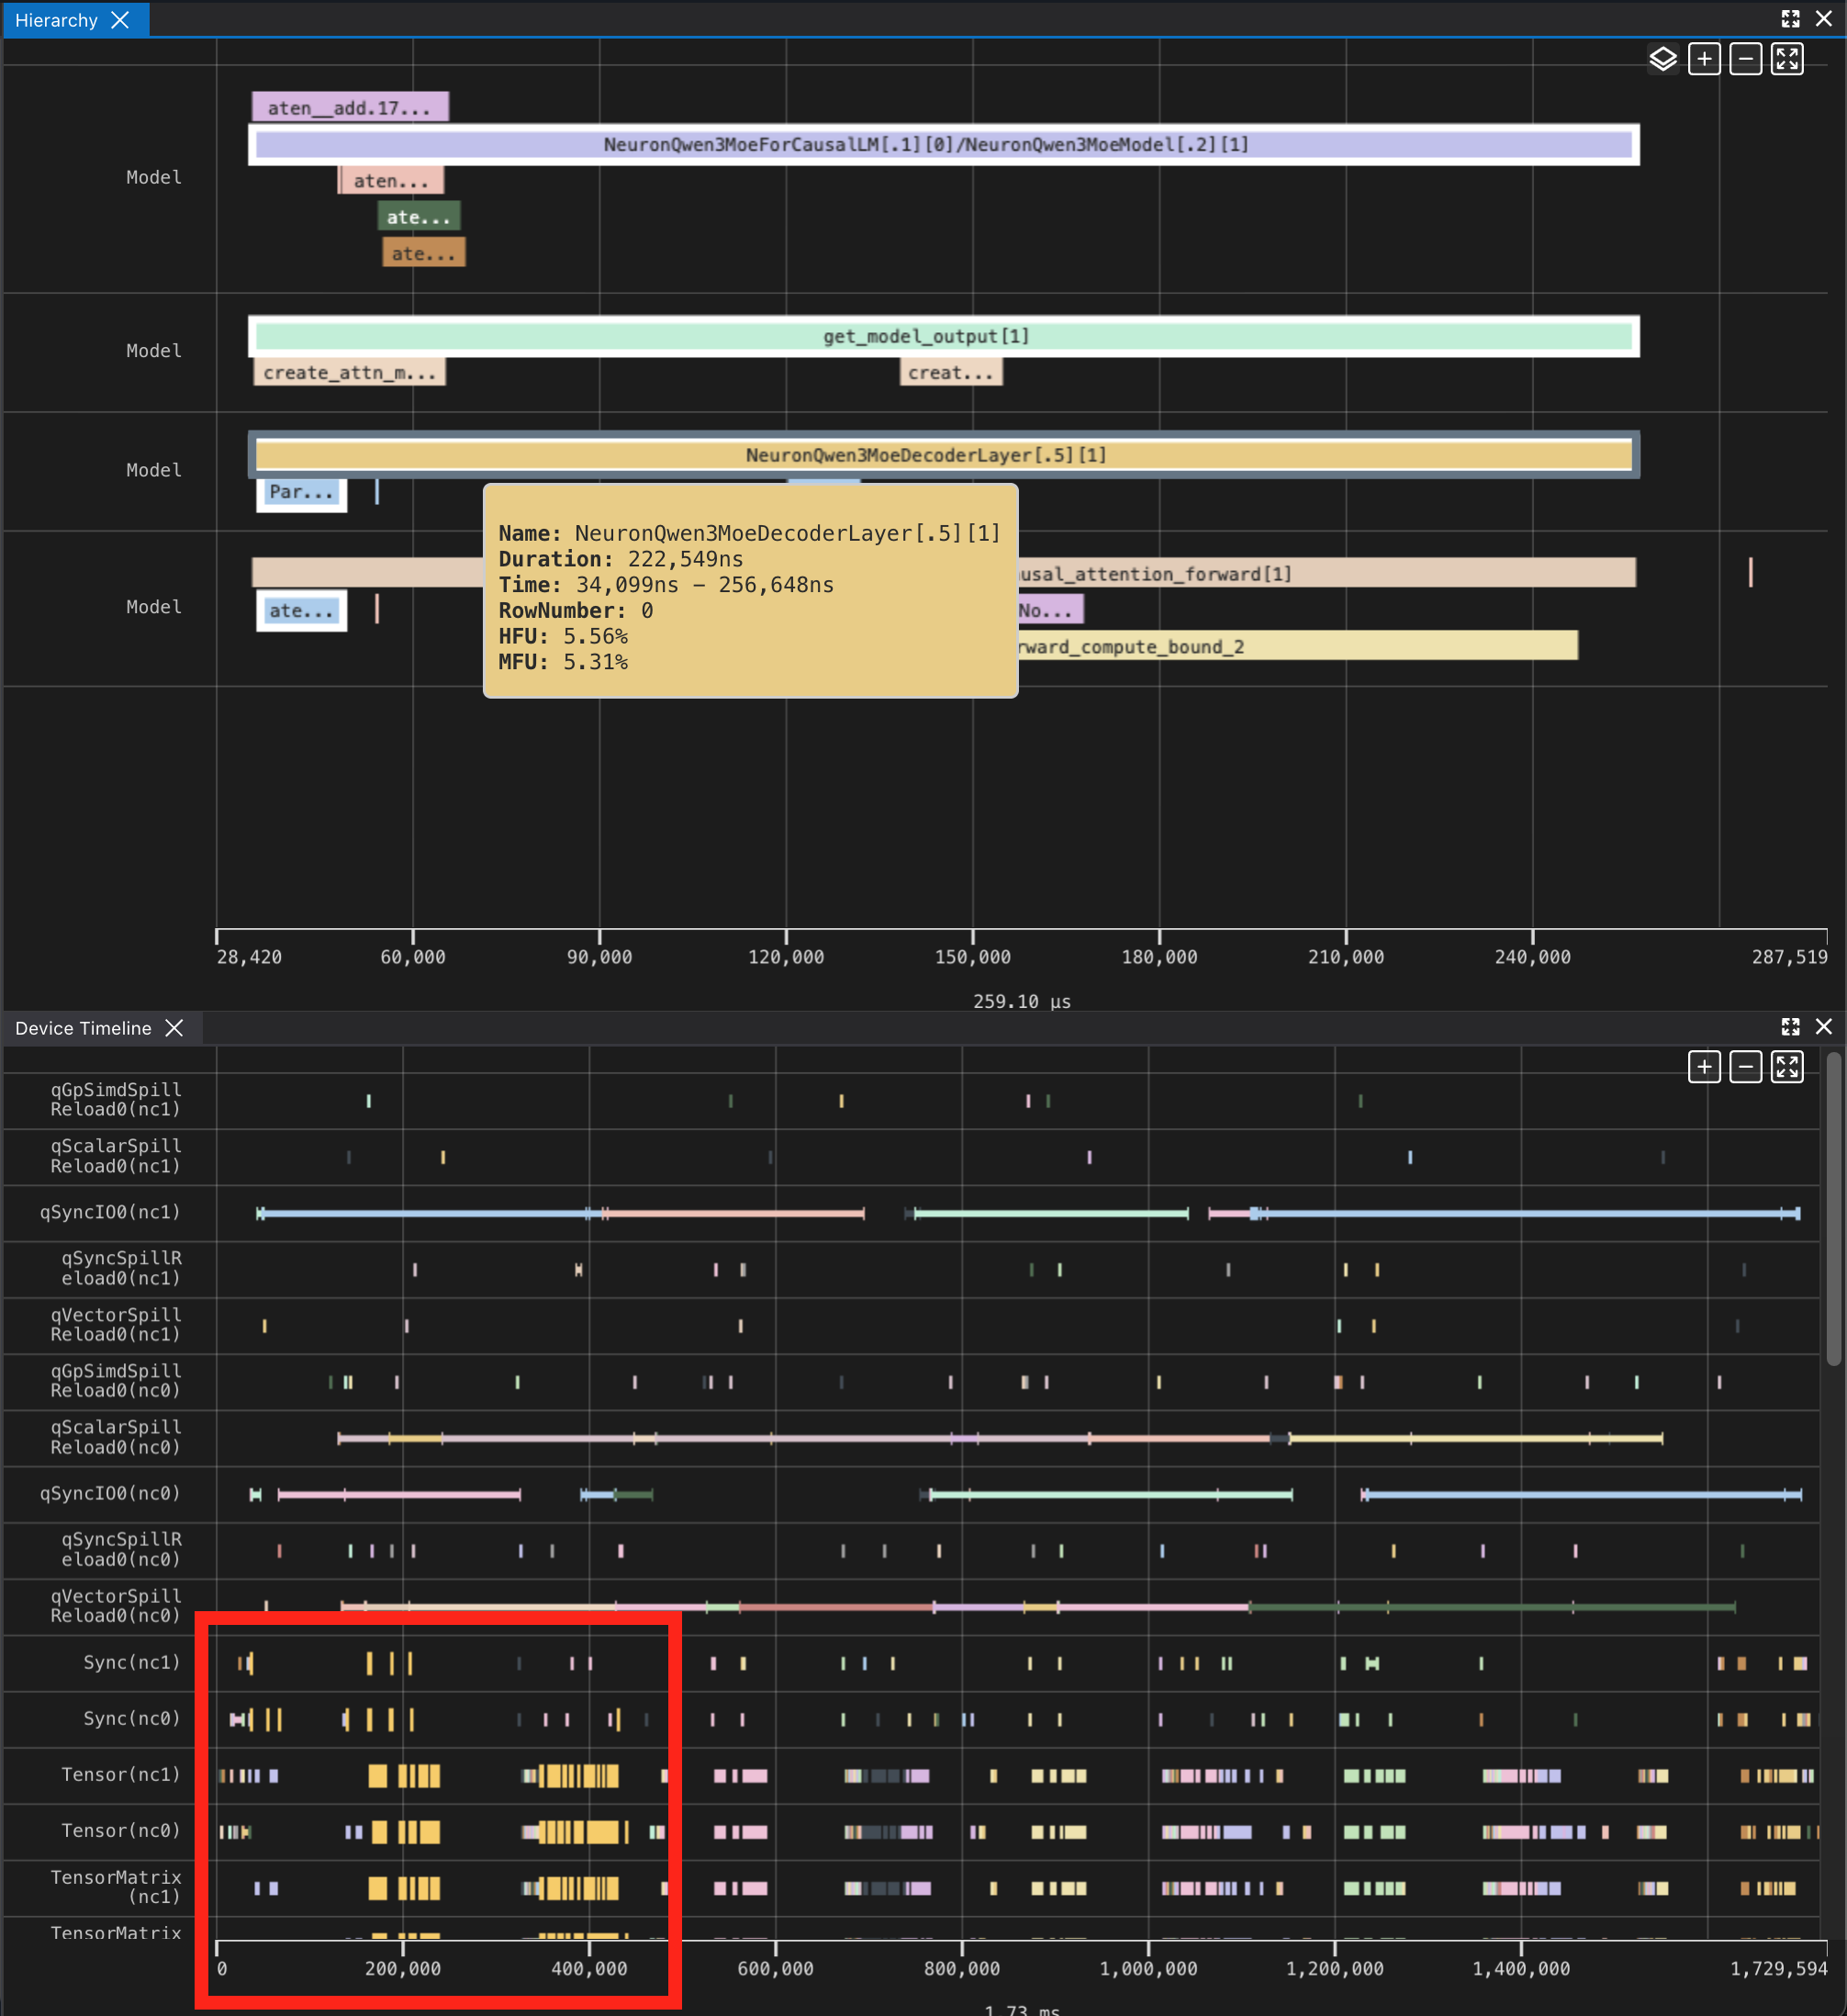
Right-clicking on an operator in Hierarchy Viewer will highlight all the corresponding instructions in the Device Trace Viewer for the operator using the same color. Multiple operators can be highlighted at once.
This document is relevant for: Inf1, Inf2, Trn1, Trn2, Trn3