
This document is relevant for: Inf1, Inf2, Trn1, Trn2, Trn3
Source Code Viewer#
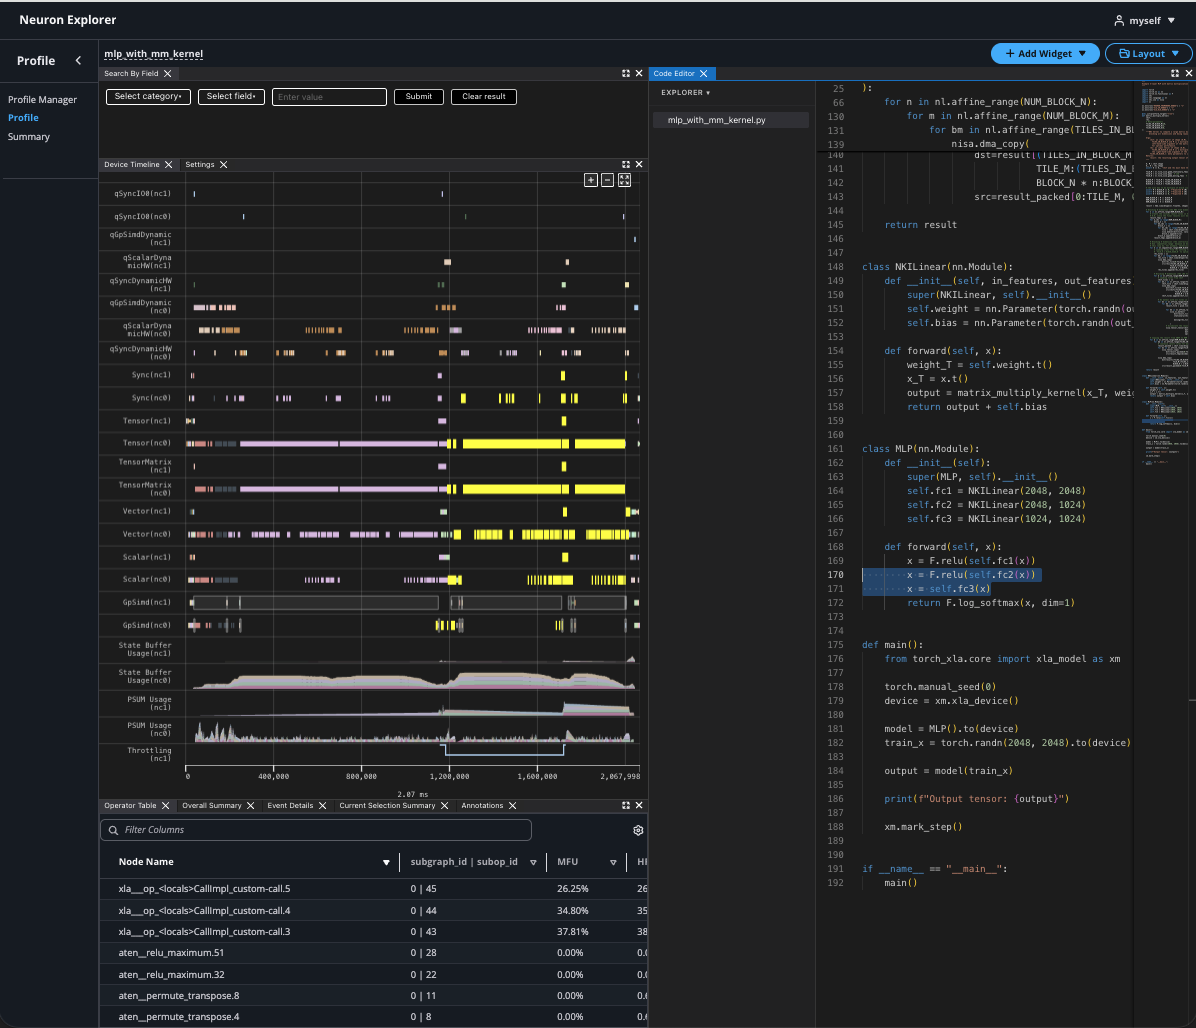
In this guide, you’ll learn how to use Neuron Explorer’s source code linking feature to visualize connections between your application code and device performance. Discover how to navigate between source code and device instructions, highlight performance-critical sections, view framework stack traces, and leverage interactive code decorations to optimize your AWS Neuron applications for maximum efficiency.
Overview#
Source code linking helps you understand how your code changes affect device performance and identify ways to optimize it. This feature creates interactive connections between source code files and other Neuron Explorer widgets. You can zoom to device instructions from selected code lines, navigate between instructions and source code, and highlight instructions for specific loop iterations. You can use source code linking in both the VS Code extension and standalone web application. This gives you flexibility for different developer workflows.
The Framework Stack Trace feature shows up in the Event Details when an instruction on the device profile is clicked. This feature is used to map the device instructions back to framework level code in JAX or PyTorch to better understand what part of the application code resulted in a particular device instruction.
Instructions#
To enable the addition of the “NKI Source Location” field to a profile enable set this environment variable: NEURON_FRAMEWORK_DEBUG=1
To enable tracking of the stack trace information, you set these environment variables before compiling your NEFF:
export XLA_IR_DEBUG=1
export XLA_HLO_DEBUG=1
Once you have the NEFF, you can simply capture the profile as usual. To view your source code while viewing the profile, use the --framework-source-root flag to pass the path to framework source files. This is optional and is only needed if you want to view your code alongside the displayedprofile.
neuron-explorer view -n file.neff -s profile.ntff --framework-source-root /path/to/framework/source/files

# Link to NKI source code only
neuron-explorer view -n file.neff -s profile.ntff --nki-source-root /path/to/nki/source/files

# Link to both framework and NKI source code
neuron-explorer view -n file.neff -s profile.ntff --framework-source-root /path/to/framework/source/files --nki-source-root /path/to/nki/source/files
Source Code Viewer#
Highlighting Instructions#
Select source code lines to highlight their corresponding instructions in the profiler view. You can select individual lines or multiple lines through block selection or multiple cursors.
Navigating to Source Code#
(Ctrl/Cmd)+Click any instruction to jump to it’s location in source code. If there are multiple matches, you will be prompted to select which file to navigate to.
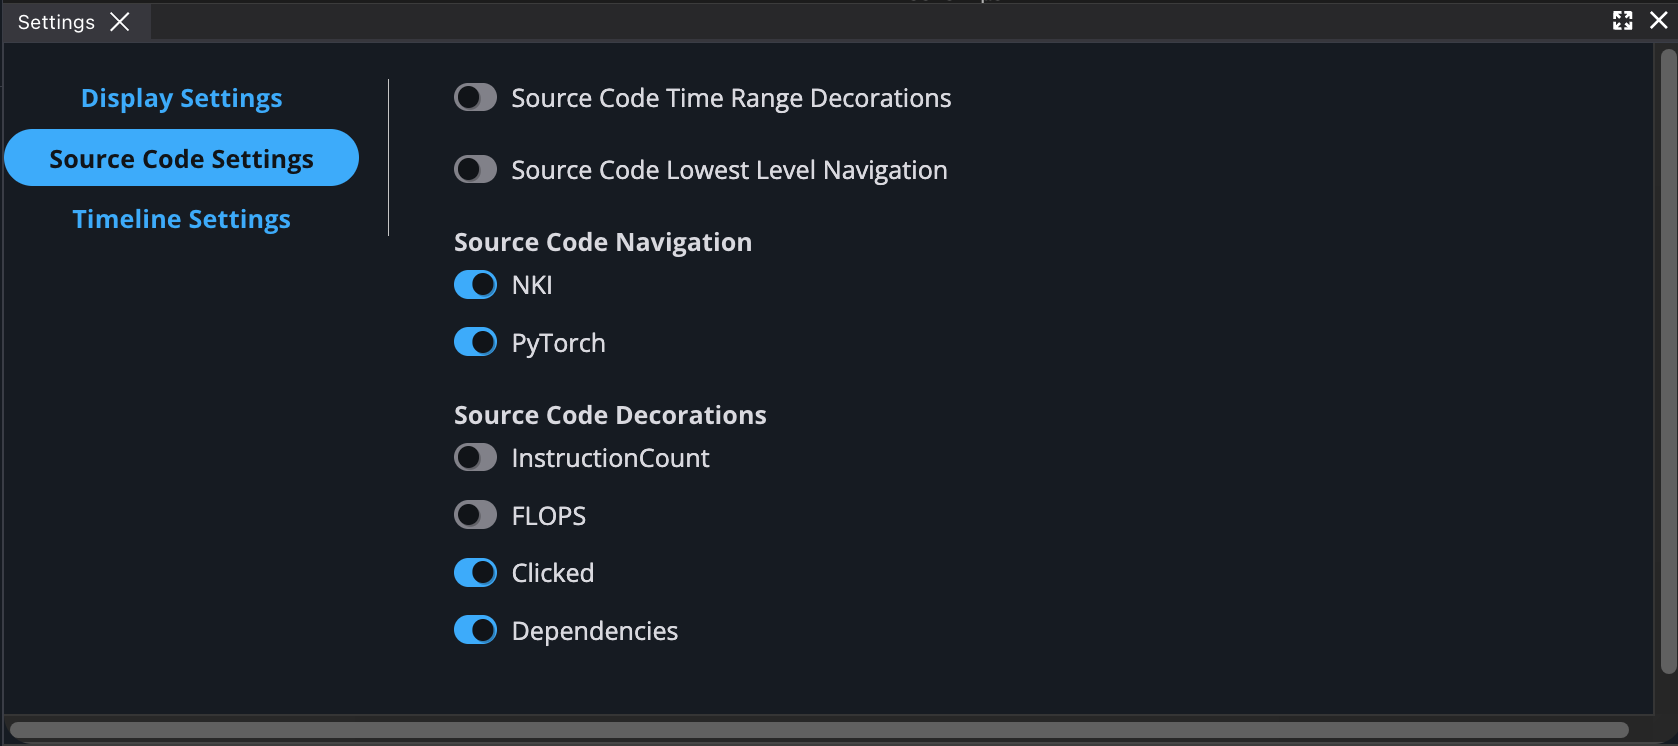
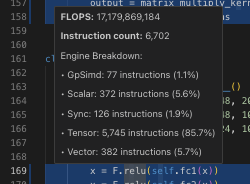
Source Code Decorations#
Performance metrics appear as decorations directly in your source code, updating automatically with the instruction profiler’s time range.
Configure which metrics to display and in the settings panel. Currently only instruction count and PE element count are supported.
Navigating to Instructions#
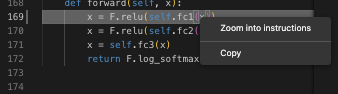
Select lines in your source code and navigate to their corresponding instructions using Ctrl+Shift+G, the context menu, or the “Zoom into Instructions” command from the command palette.
The Device Trace Viewer will then zoom to show all instructions associated with your selection.
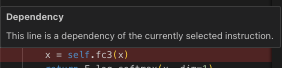
Dependency Annotations#
When enabled, selecting an instruction will highlight its dependent source code lines. The selected instruction’s line will be highlighted in one color, with its dependencies shown in a different color.
This document is relevant for: Inf1, Inf2, Trn1, Trn2, Trn3