
This document is relevant for: Inf2, Trn1, Trn2, Trn3
Track System Resource Utilization during Training with neuron-monitor using PyTorch Neuron#
This tutorial explains how to monitor resource utilization using neuron-monitor, Prometheus and Grafana while running a multi-layer perceptron MNIST model on Trainium using PyTorch Neuron.
Multi-layer Perceptron MNIST Model#
This tutorial is based on the MNIST example for PyTorch Neuron on Trainium. For the full tutorial, please see Multi-Layer Perceptron Training Tutorial.
The Training Job#
For this tutorial, we will make the original script do more work thus giving us more system utilization data to observe. The training loop is simply repeated 1000 times:
for run in range(0, 1000):
    print(f'Run {run}')
    model.train()
    ...
Save the following code as train_monitor.py and you can run it as
python3 train_monitor.py on a Trn1 instance.
import os
import time
import torch
import torch.nn as nn
import torch.nn.functional as F

from torchvision.datasets import mnist
from torch.optim import SGD
from torch.utils.data import DataLoader
from torchvision.transforms import ToTensor

# XLA imports
import torch_xla.core.xla_model as xm

# Declare 3-layer MLP for MNIST dataset
class MLP(nn.Module):
    def __init__(self, input_size = 28 * 28, output_size = 10, layers = [120, 84]):
        super(MLP, self).__init__()
        self.fc1 = nn.Linear(input_size, layers[0])
        self.fc2 = nn.Linear(layers[0], layers[1])
        self.fc3 = nn.Linear(layers[1], output_size)

    def forward(self, x):
        x = F.relu(self.fc1(x))
        x = F.relu(self.fc2(x))
        x = self.fc3(x)
        return F.log_softmax(x, dim=1)

# Load MNIST train dataset
train_dataset = mnist.MNIST(root='./MNIST_DATA_train', \
                            train=True, download=True, transform=ToTensor())

def main():
    # Prepare data loader
    train_loader = DataLoader(train_dataset, batch_size=32)

    # Fix the random number generator seeds for reproducibility
    torch.manual_seed(0)

    # XLA: Specify XLA device (defaults to a NeuronCore on Trn1 instance)
    device = 'xla'

    # Move model to device and declare optimizer and loss function
    model = MLP().to(device)
    optimizer = torch.optim.SGD(model.parameters(), lr=0.01)
    loss_fn = torch.nn.NLLLoss()

    # Run the training loop
    print('----------Training ---------------')
    for run in range(0, 1000):
        print(f'Run {run}')
        model.train()
        for idx, (train_x, train_label) in enumerate(train_loader):
            optimizer.zero_grad()
            train_x = train_x.view(train_x.size(0), -1)
            train_x = train_x.to(device)
            train_label = train_label.to(device)
            output = model(train_x)
            loss = loss_fn(output, train_label)
            loss.backward()
            optimizer.step()
            xm.mark_step() # XLA: collect ops and run them in XLA runtime
            if idx < 2: # skip warmup iterations
                start = time.time()

    # Save checkpoint for evaluation
    os.makedirs("checkpoints", exist_ok=True)
    checkpoint = {'state_dict': model.state_dict()}
    # XLA: use xm.save instead of torch.save to ensure states are moved back to cpu
    # This can prevent "XRT memory handle not found" at end of test.py execution
    xm.save(checkpoint,'checkpoints/checkpoint.pt')

    print('----------End Training ---------------')
Setting up Prometheus and Grafana#
Note
The setup presented in the following paragraphs can be extended to monitor any number of instances running training jobs or inference workloads. For this tutorial, we will set everything up on a single Trn1 instance running Amazon Linux 2.
Setting up Prometheus#
For a more detailed guide on how to install Prometheus visit their official guide at https://prometheus.io/docs/prometheus/latest/getting_started/.
Download and unzip a prebuilt Prometheus binary on your Trn1 instance:
wget https://github.com/prometheus/prometheus/releases/download/v2.38.0/prometheus-2.38.0.linux-amd64.tar.gz
tar -xzvf prometheus-2.38.0.linux-amd64.tar.gz
cd prometheus-2.38.0.linux-amd64/
Create a config and add a scrape target:
vim prometheus.yml
scrape_configs:
- job_name:       'neuron'

# Scrape target every 5 seconds.
scrape_interval: 5s

  static_configs:
    - targets: ['localhost:8000']
Finally, start Prometheus:
./prometheus --config.file=prometheus.yml
Setting up Grafana#
For a more detailed guide on how to install Grafana visit their official guide at https://grafana.com/grafana/download.
Add the Grafana repo to dnf:
sudo vim /etc/yum.repos.d/grafana.repo

[grafana]
name=grafana
baseurl=https://packages.grafana.com/oss/rpm
repo_gpgcheck=1
enabled=1
gpgcheck=1
gpgkey=https://packages.grafana.com/gpg.key
sslverify=1
sslcacert=/etc/pki/tls/certs/ca-bundle.crt
Install and start Grafana:
sudo dnf install -y grafana
sudo /bin/systemctl start grafana-server.service
By default, Grafana will run a HTTP server on port 3000. If you need to change that, update its config and restart the service:
sudo vim /etc/grafana/grafana.ini
...
sudo /bin/systemctl start grafana-server.service
Using your favorite web browser, access the Grafana webpage and add a new dashboard.
The default user and password are both ‘admin’:
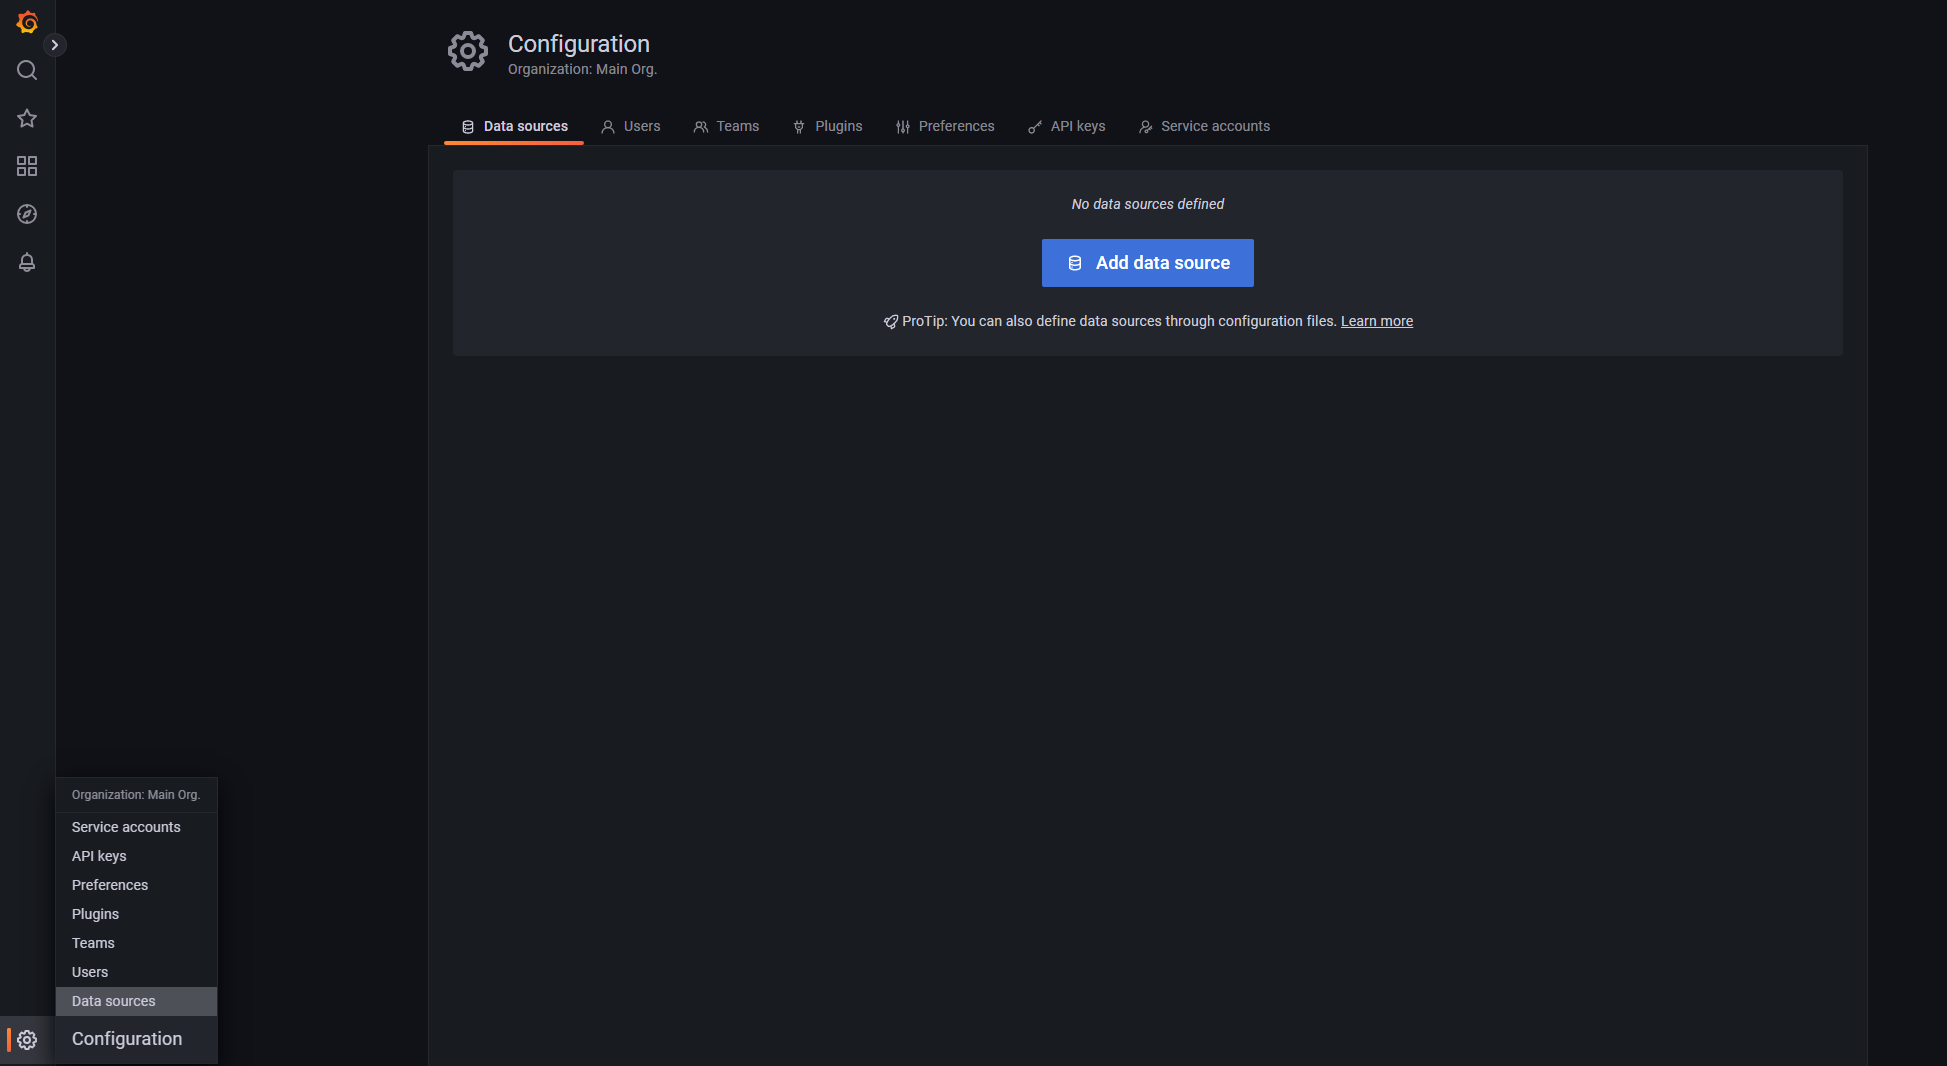
Next, you’ll add a Prometheus data source by going to Configuration -> Data Sources:
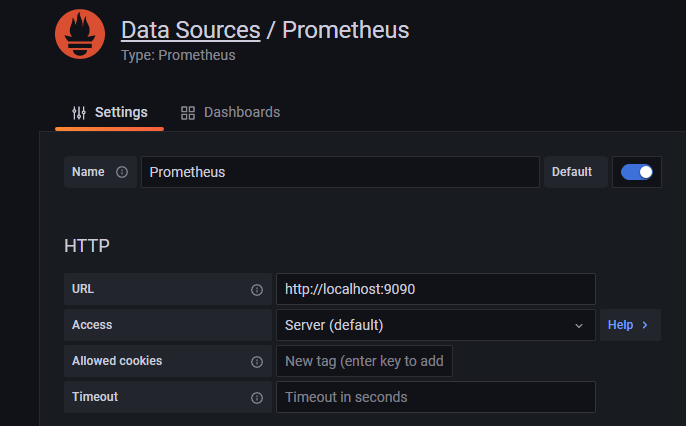
… and adding the local Prometheus server as a data source:
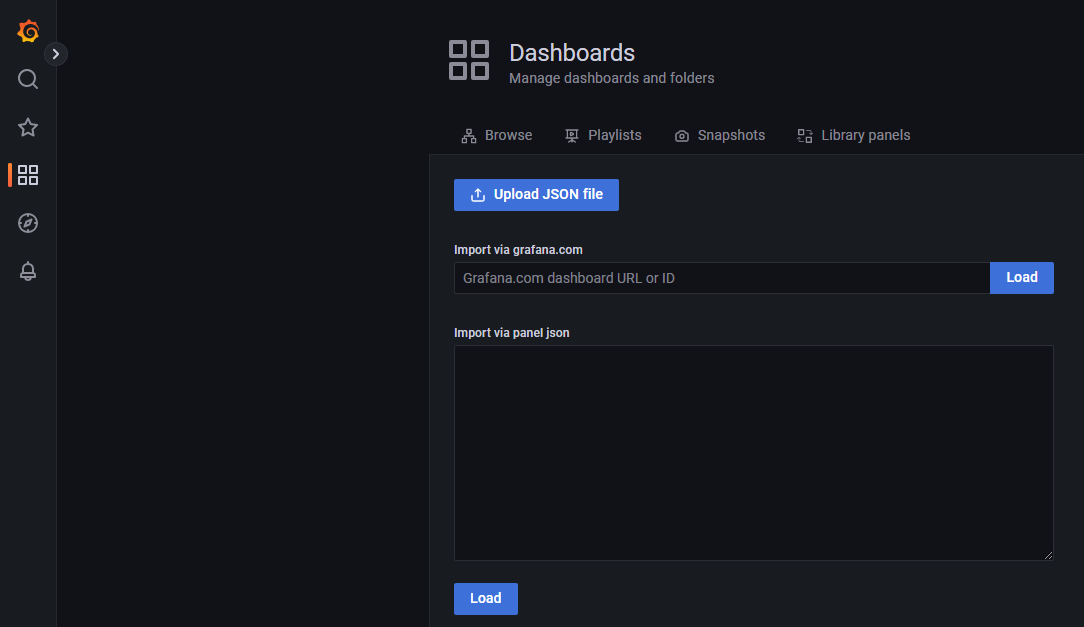
Finally, upload the sample dashboard neuron-monitor-grafana.json
to Grafana:
Monitoring the Training Workload#
Start the training job which, due to the artificially added complexity, will take more than 15 minutes:
python train_monitor.py
On the same instance, start neuron-monitor and its companion script, neuron-monitor-prometheus.py:
neuron-monitor | neuron-monitor-prometheus.py
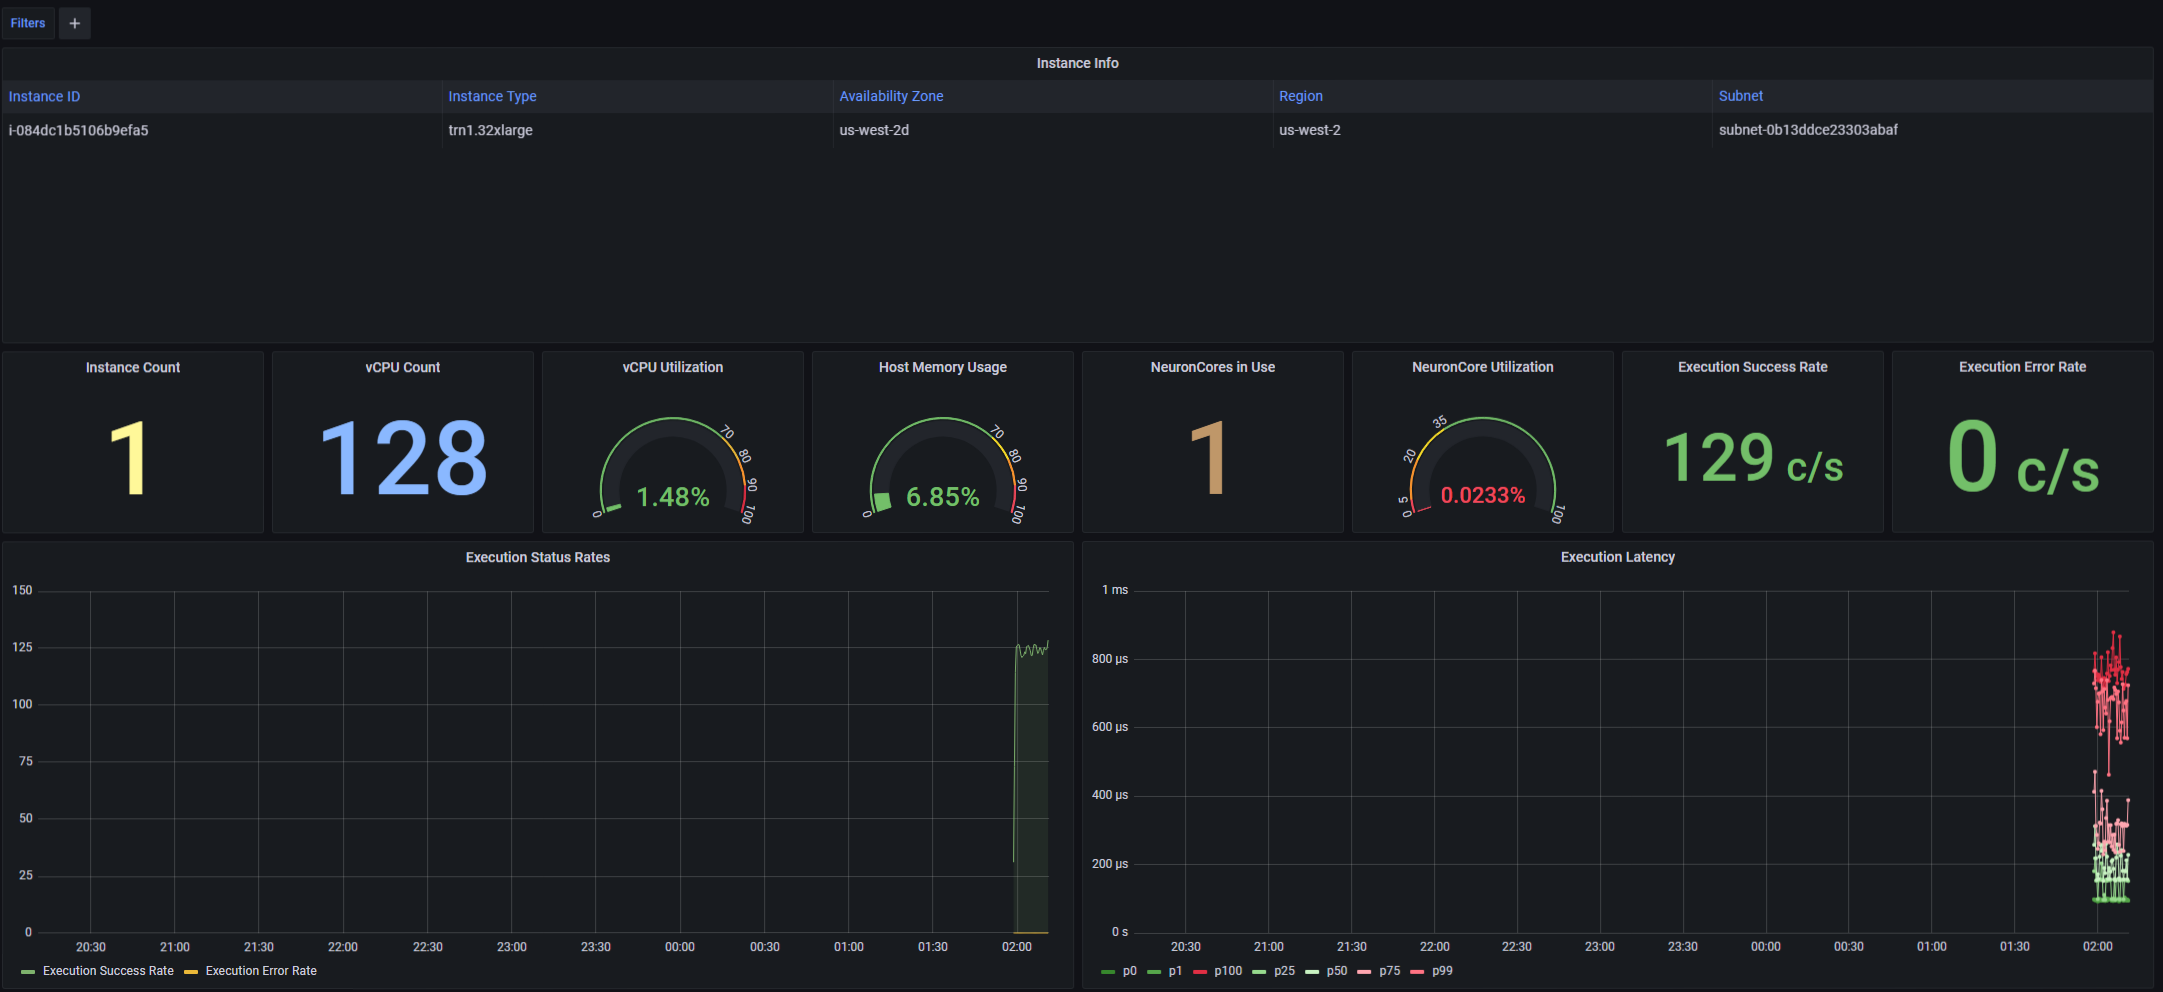
Once they are running, you can use your web browser, access the Grafana server running on your Trn1 instance and view a timeline of the system utilization.
- The upper part of the dashboard contains:
a list of the currently monitored instances (for this tutorial there is a single Trn1 instance)
aggregated metrics for stats such as NeuronCore utilization, NeuronCores in use, iteration success rates, error rates etc.
a timeline of execution status rates and execution latencies
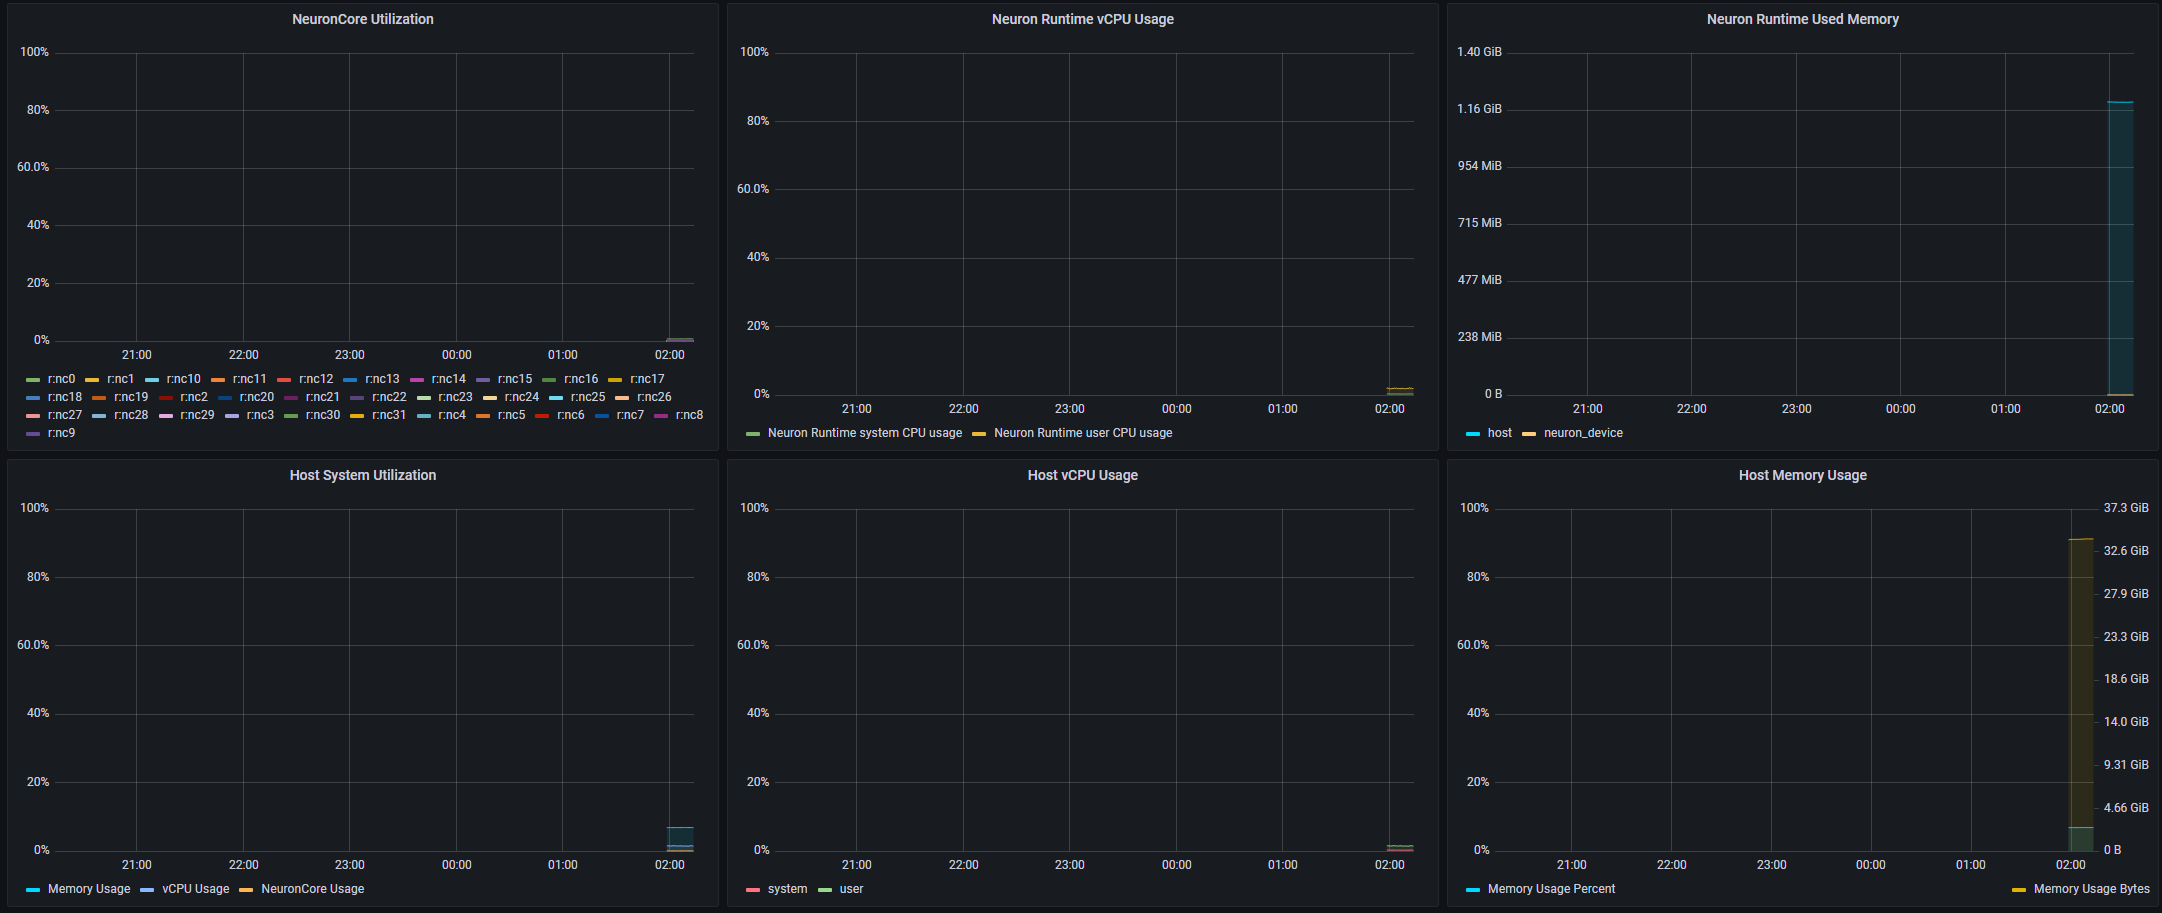
The lower part of the dashboard contains: - one line of charts containing a timeline of Neuron resource utilization (NeuronCore, vCPU and memory utilization) - one line of charts containing a timeline of host resource utilization (vCPU and memory utilization)
This document is relevant for: Inf2, Trn1, Trn2, Trn3