
This document is relevant for: Inf2, Trn1
NeuronX Plugin for TensorBoard (Trn1)#
Overview#
This guide is for developers who want to better understand how their model is executed using Neuron SDK through TensorBoard.
The Neuron plugin for TensorBoard provides metrics to the performance of machine learning tasks accelerated using the Neuron SDK. It is compatible with TensorBoard versions 1.15 and higher. It provides visualizations and profiling results for graphs executed on NeuronCores.
Note
The following information is compatible with Neuron SDK for Trn1. For a walkthrough on Inf1, please check out the guide Neuron Plugin for TensorBoard (Inf1).
Enable profiling on Trn1#
Note
Profiling is currently only supported with PyTorch Neuron (torch-neuronx).
Please refer to the following guides:
- PyTorch-Neuron
Launch TensorBoard#
In this step, we will process the Neuron profile data and launch TensorBoard.
Install the Neuron plugin for Tensorboard on your EC2 instance.
pip install tensorboard-plugin-neuronx --extra-index-url https://pip.repos.neuron.amazonaws.com
Note
If using TensorBoard >= 2.5, please use the --load_fast=false option when launching.
tensorboard --logdir results --load_fast=false
2. After you see the following message, TensorBoard is ready to use. By default,
TensorBoard will be launched at localhost:6006.
...
Serving TensorBoard on localhost; to expose to the network, use a proxy or pass --bind_all
TensorBoard 2.4.1 at http://localhost:6006/ (Press CTRL+C to quit)
View results in TensorBoard#
In this step, we will view the Neuron plugin for TensorBoard from a browser on your local development machine.
1. Connect to the EC2 instance where TensorBoard is running while enabling port forwarding.
In this example, we assume TensorBoard has been launched using the default address localhost:6006.
# if Ubuntu-based AMI
ssh -i <PEM key file> ubuntu@<instance DNS> -L 6006:localhost:6006

# if AL2-based AMI
ssh -i <PEM key file> ec2-user@<instance DNS> -L 6006:localhost:6006
In a browser, visit localhost:6006.
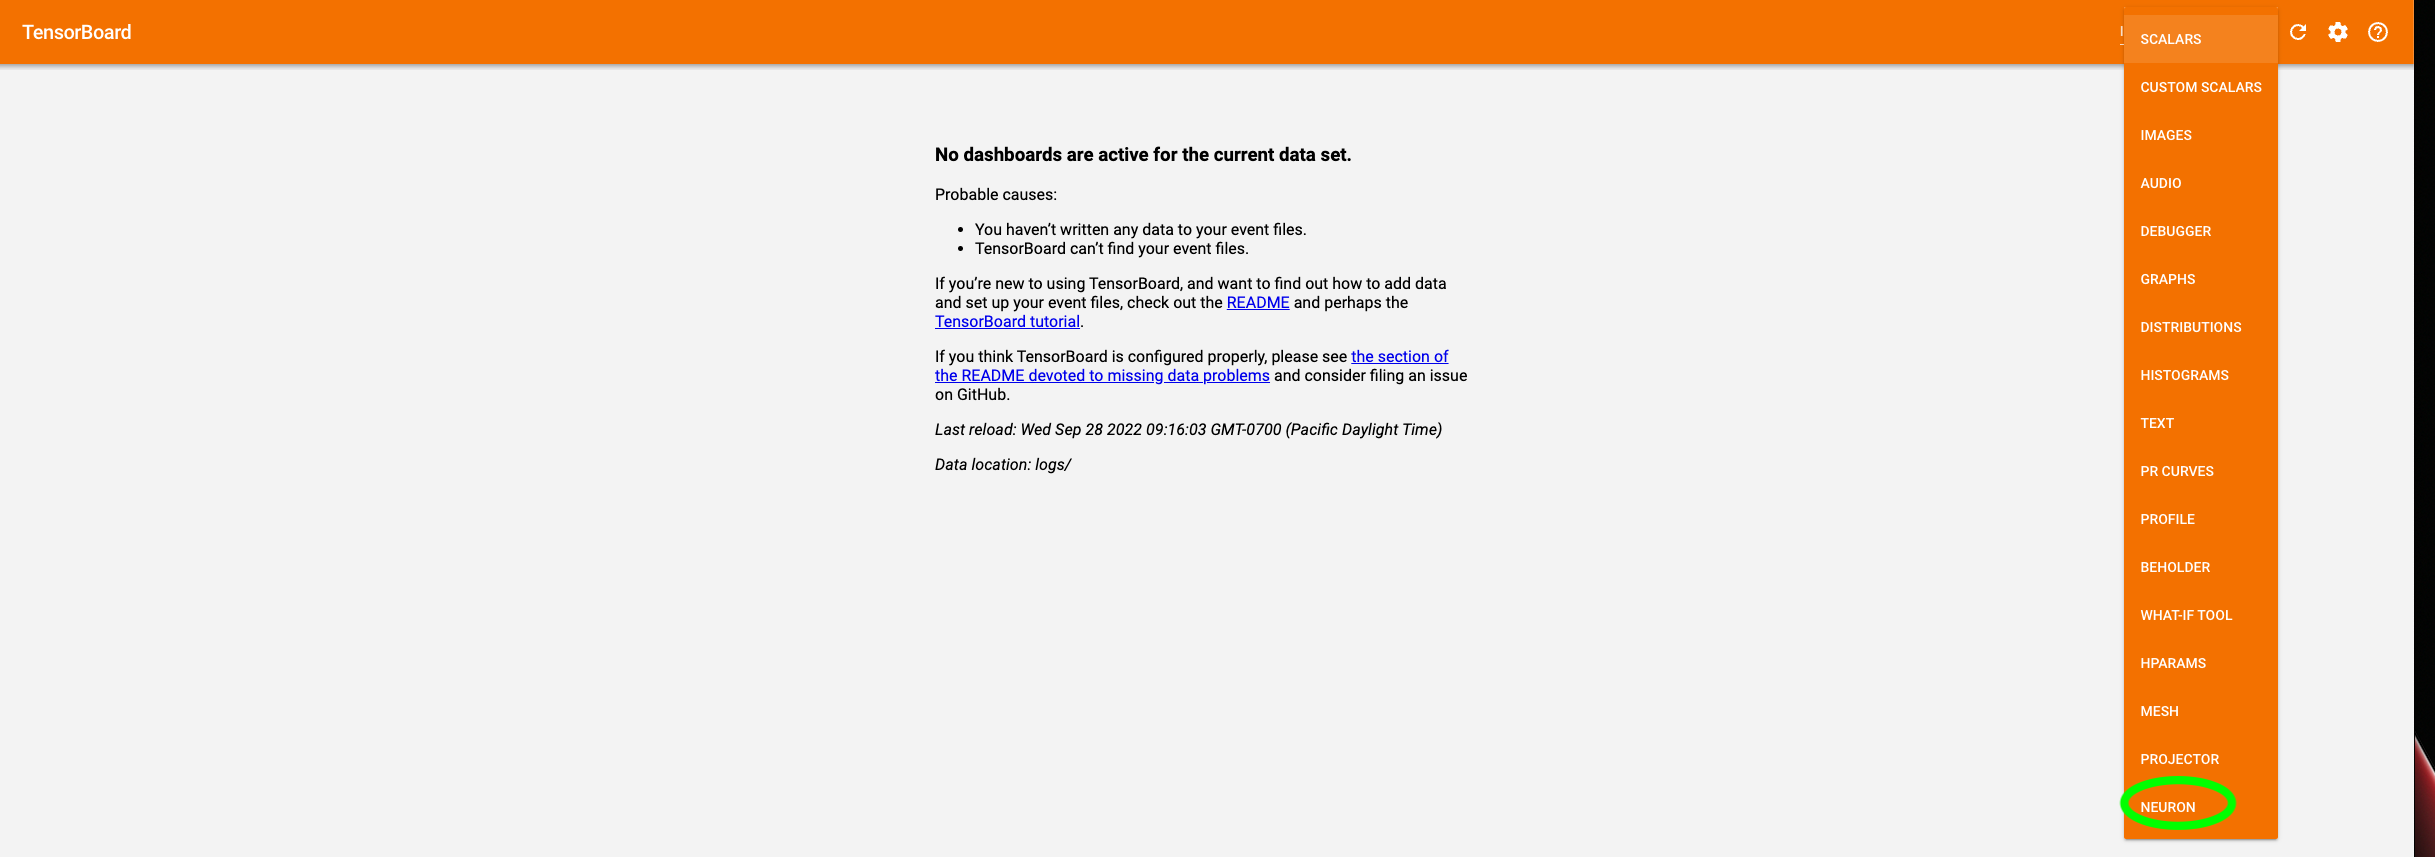
3. In the top navigation bar, switch from Graphs to Neuron. If it does not show up,
please wait a while and refresh the page while the plugin loads. If the issue persists, check
the Inactive dropdown list on the right and check for Neuron.
If TensorBoard failed to find the generated logs, you will see the following message:
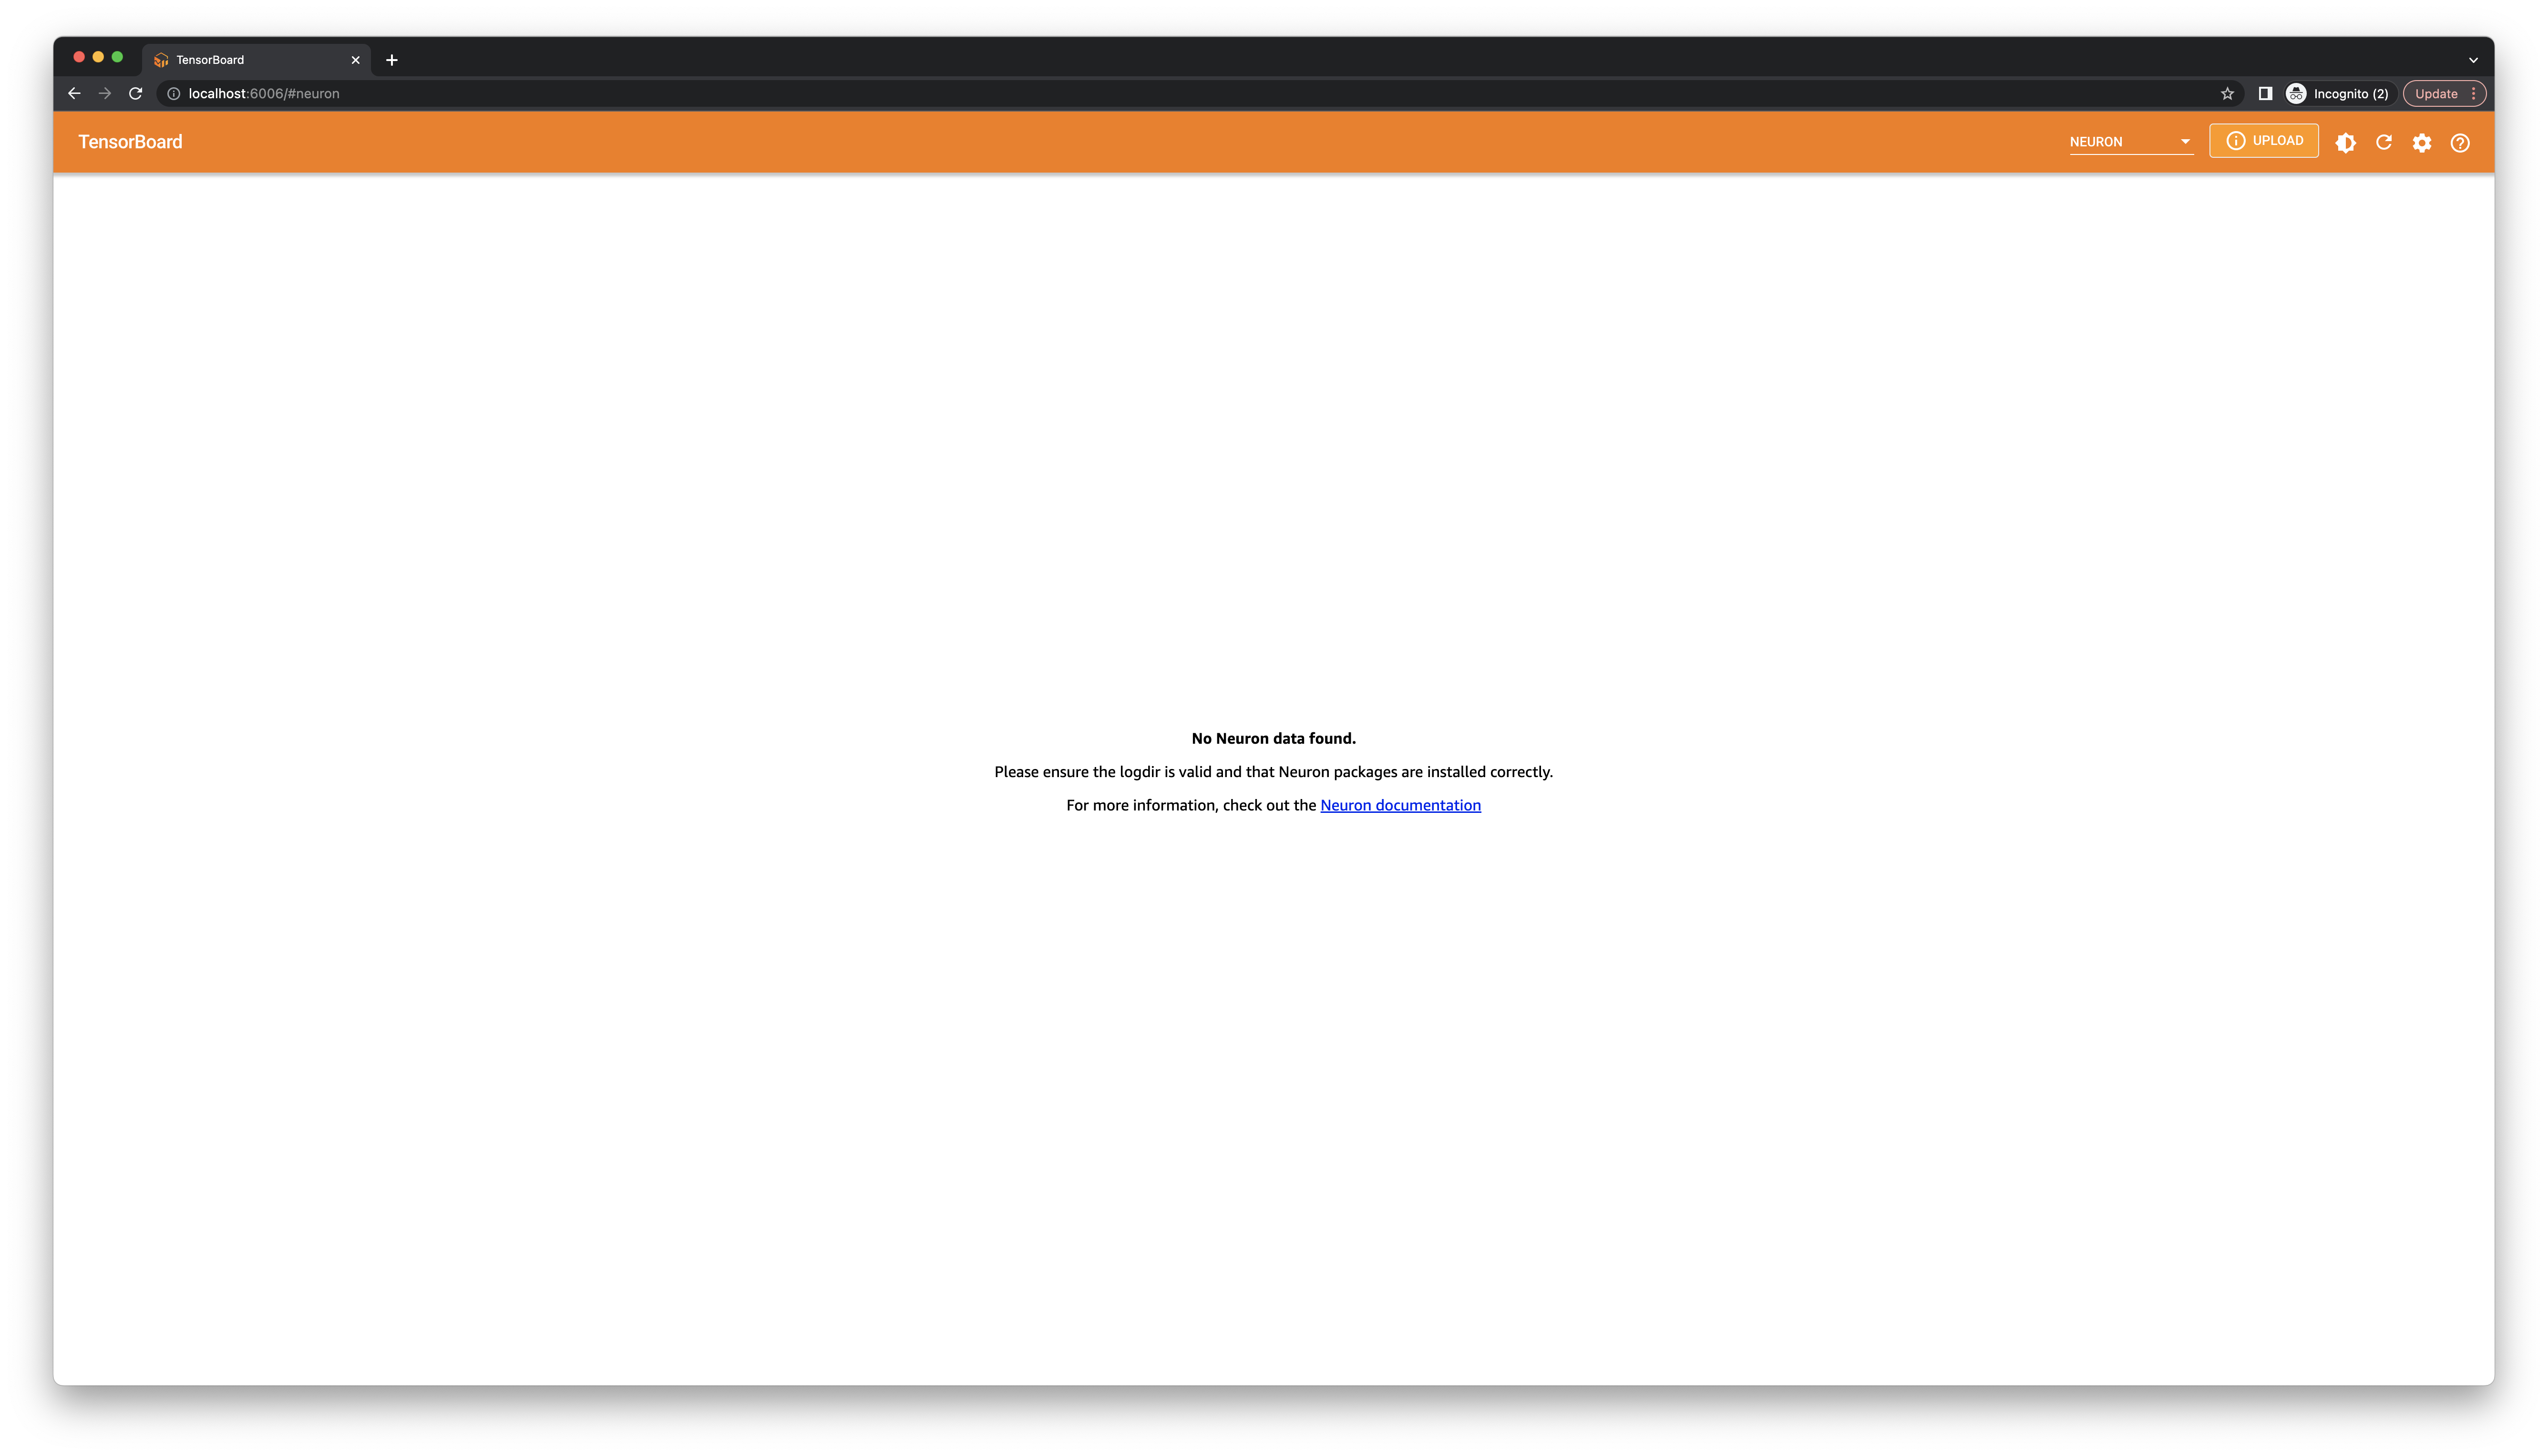
In this case, please make sure the version of the aws-neuronx-tools
package and the Neuron framework package is from Neuron release 2.6 or newer.
Neuron Trace View#
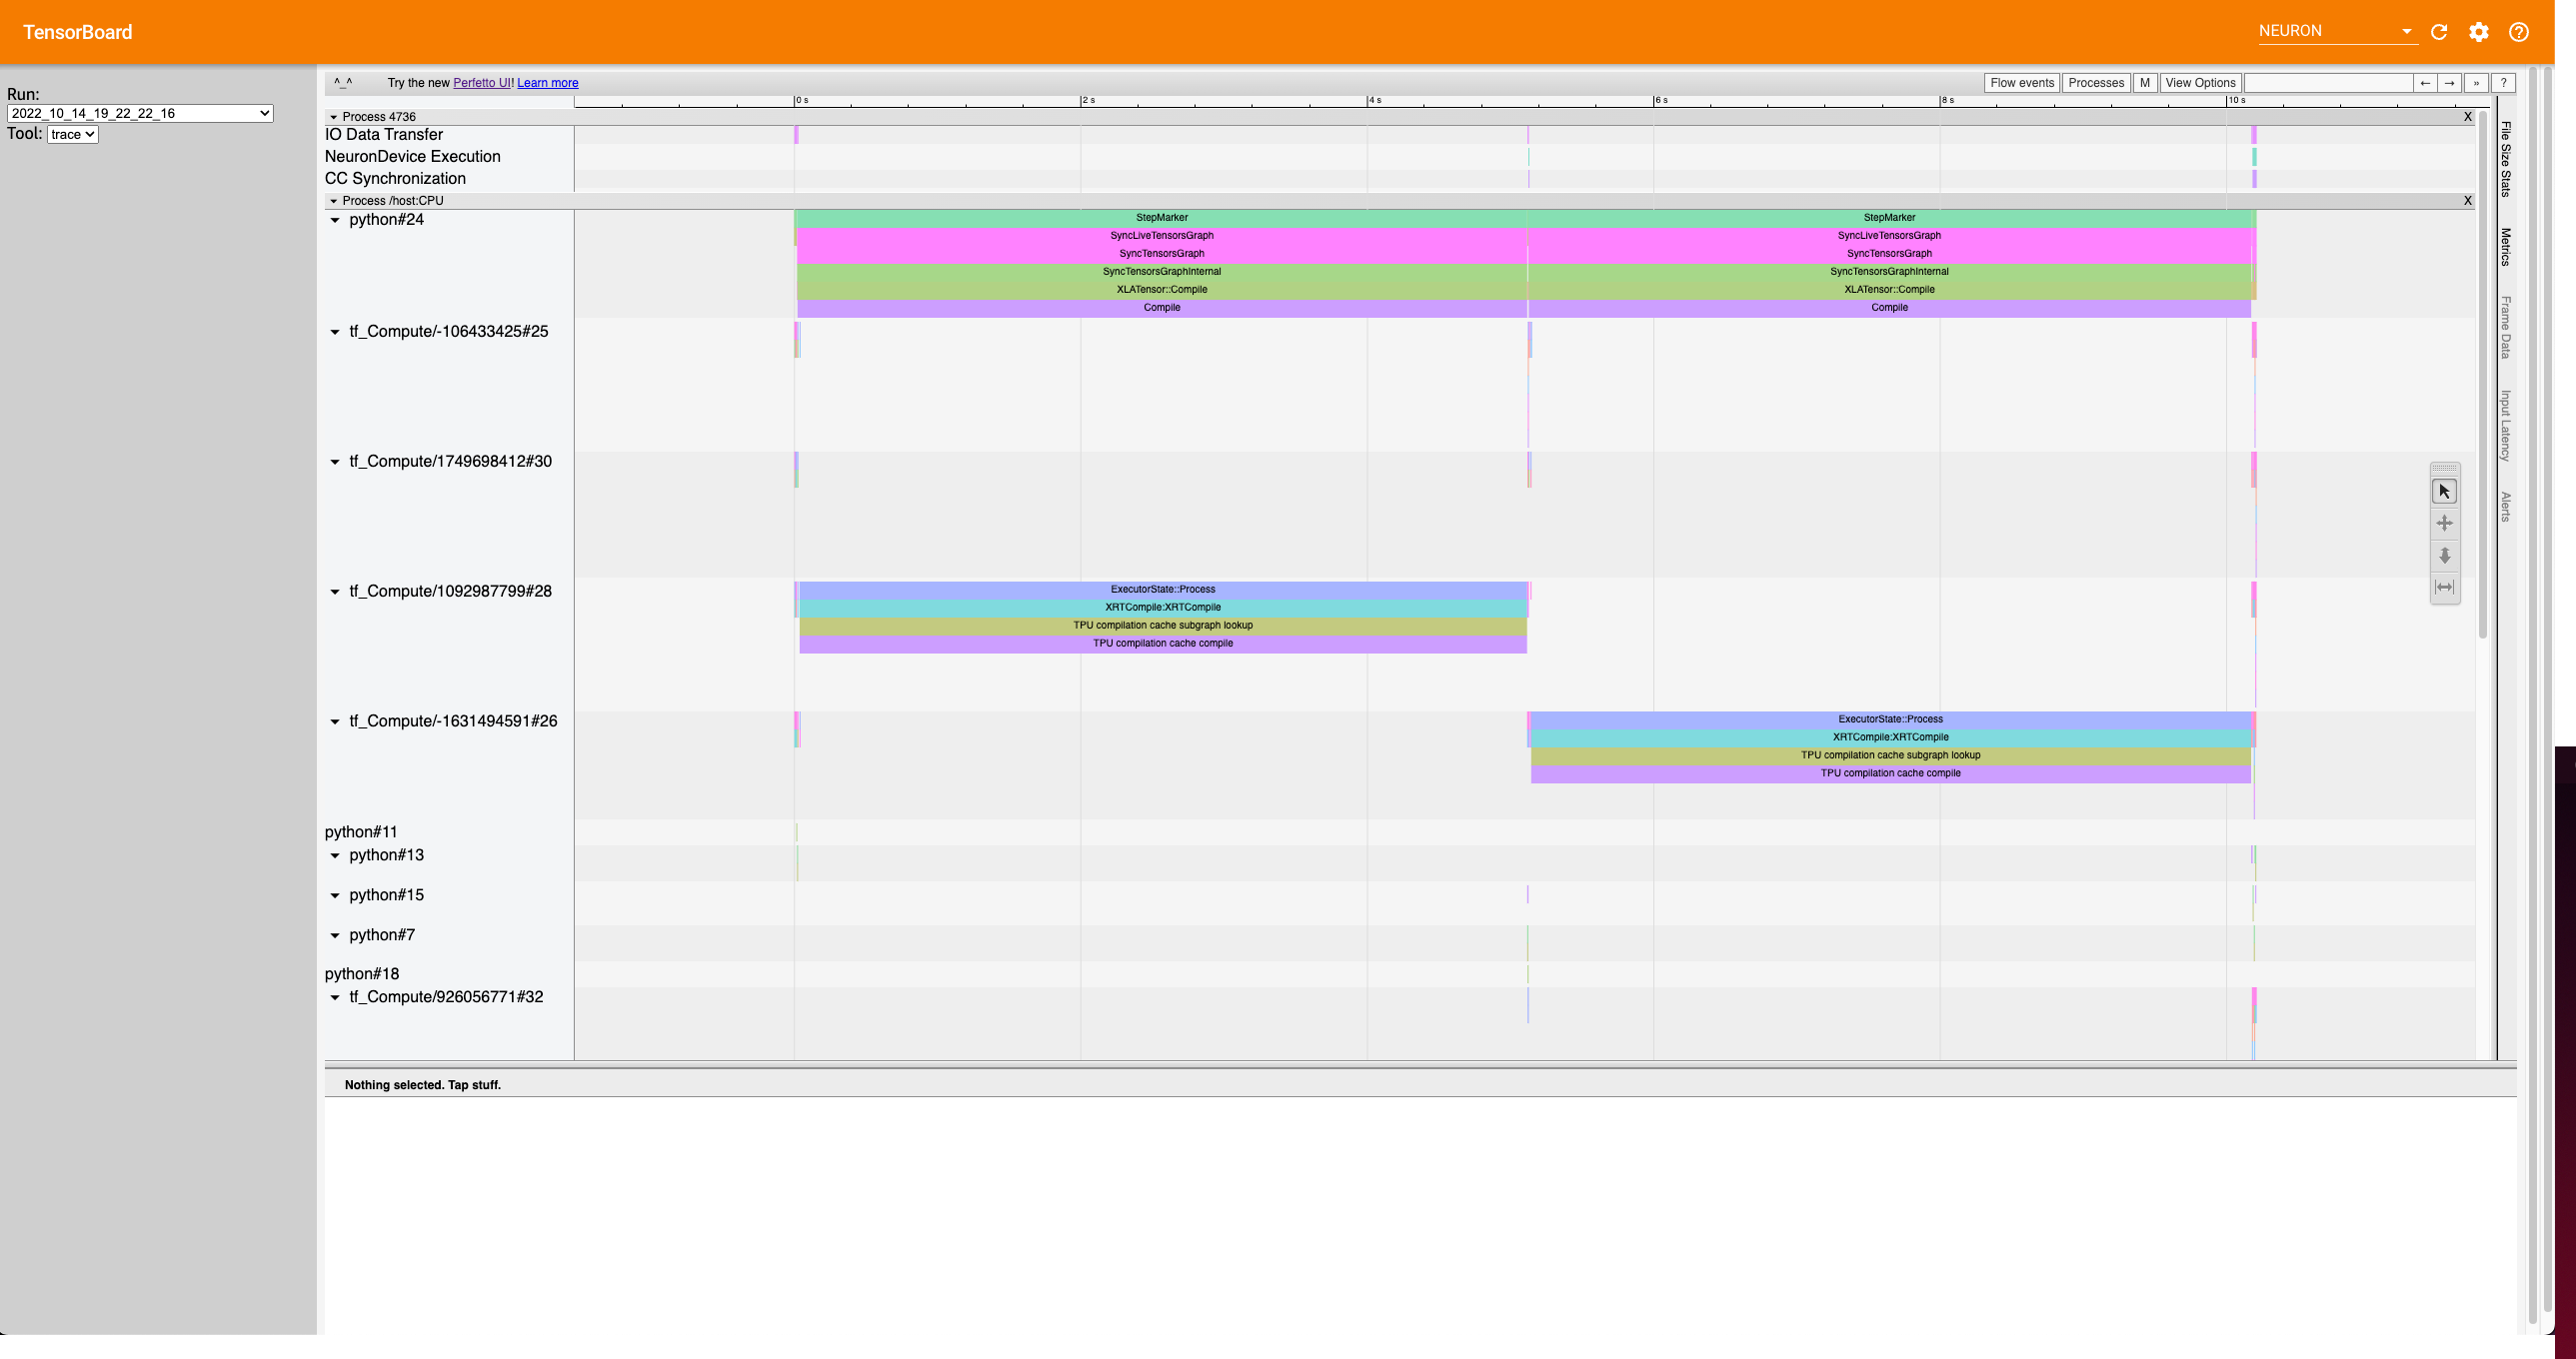
The trace view gives a high level timeline of execution by aligning Neuron events, such as Neuron Device execution, data transfers, and Collective Compute synchronization (if applicable), with other events from the XLA profiler.
Use this view to better understand bottlenecks during the run, and potentially experiment with how execution changes
by moving the mark_step() call which will execute the graph.
Neuron Operator View#
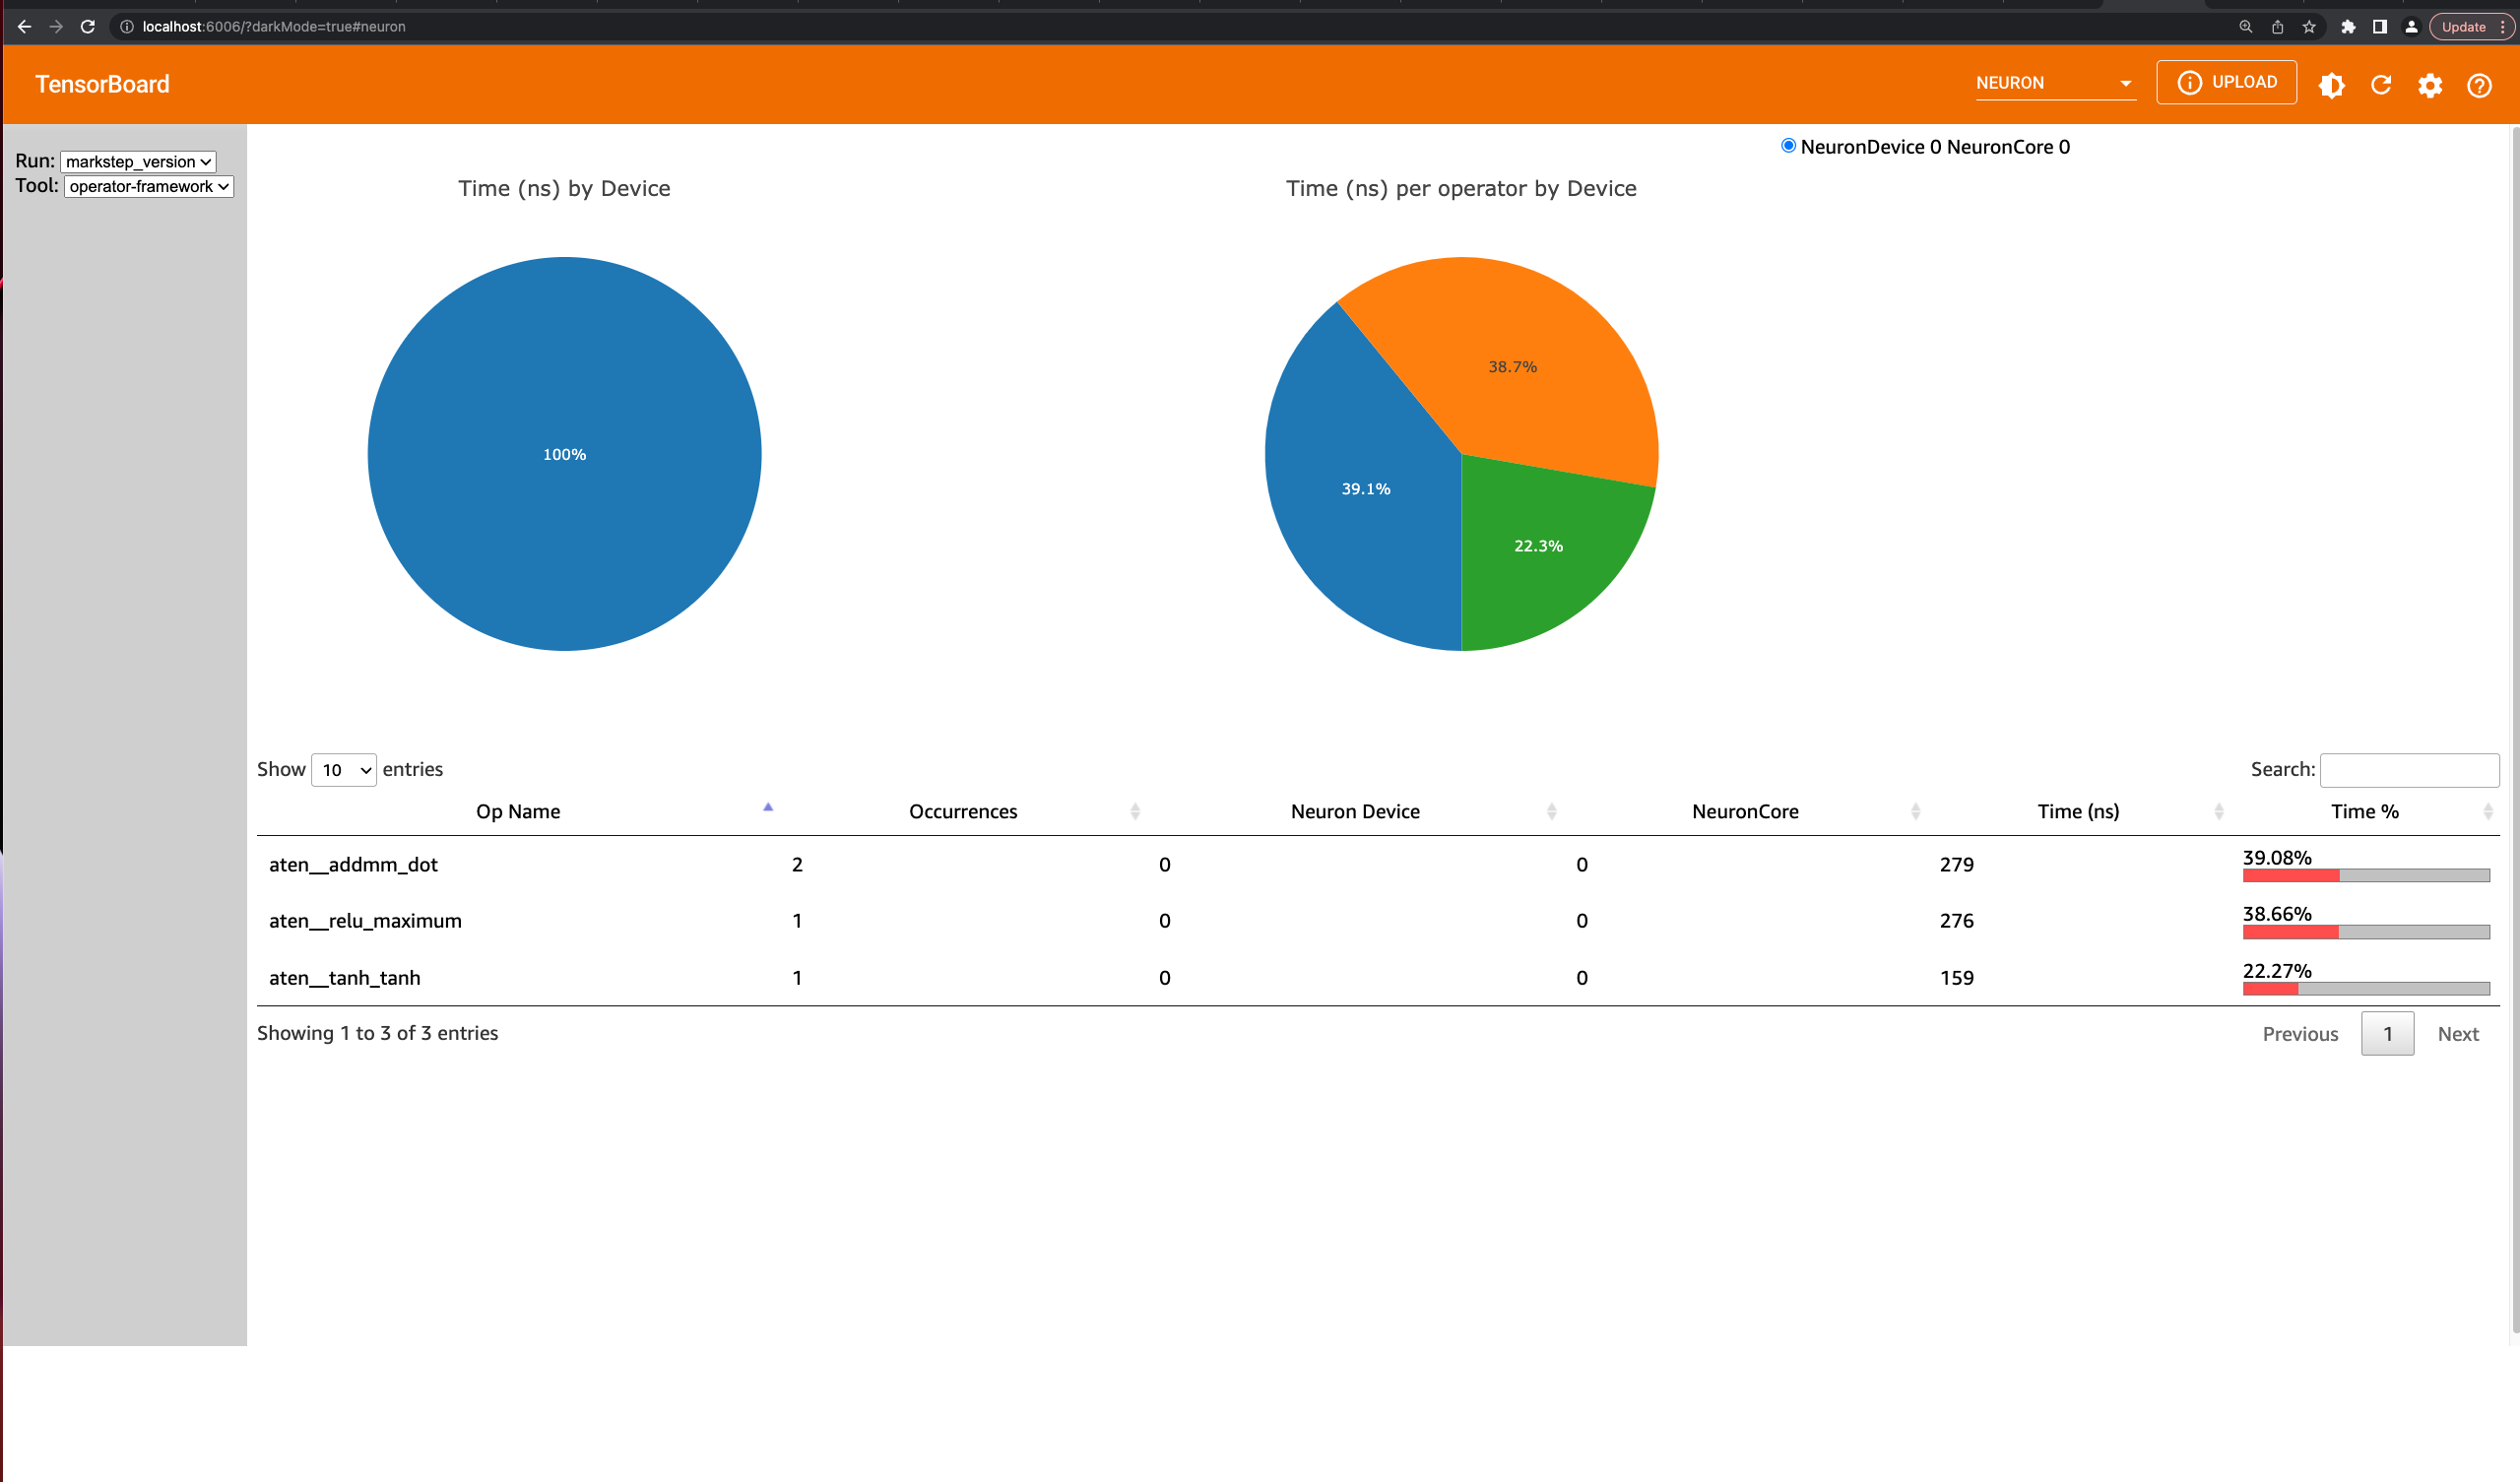
The operator view can show timing information for both the framework operators and HLO operators by selecting
the operator-framework and operator-hlo tools respectively. The pie charts show breakdowns of the time taken
by device, as well as per operator on a single device. The table below lists out the operators and can be sorted by clicking
on the columnn headers. For fused operations, hover over the ? to see which operators are being executed.
For a quick glance at the most time consuming operators, click the Time % column in the table to sort by the relative
time spent on this type of operation compared to the rest of the model.
Neuron Operator Timeline View#
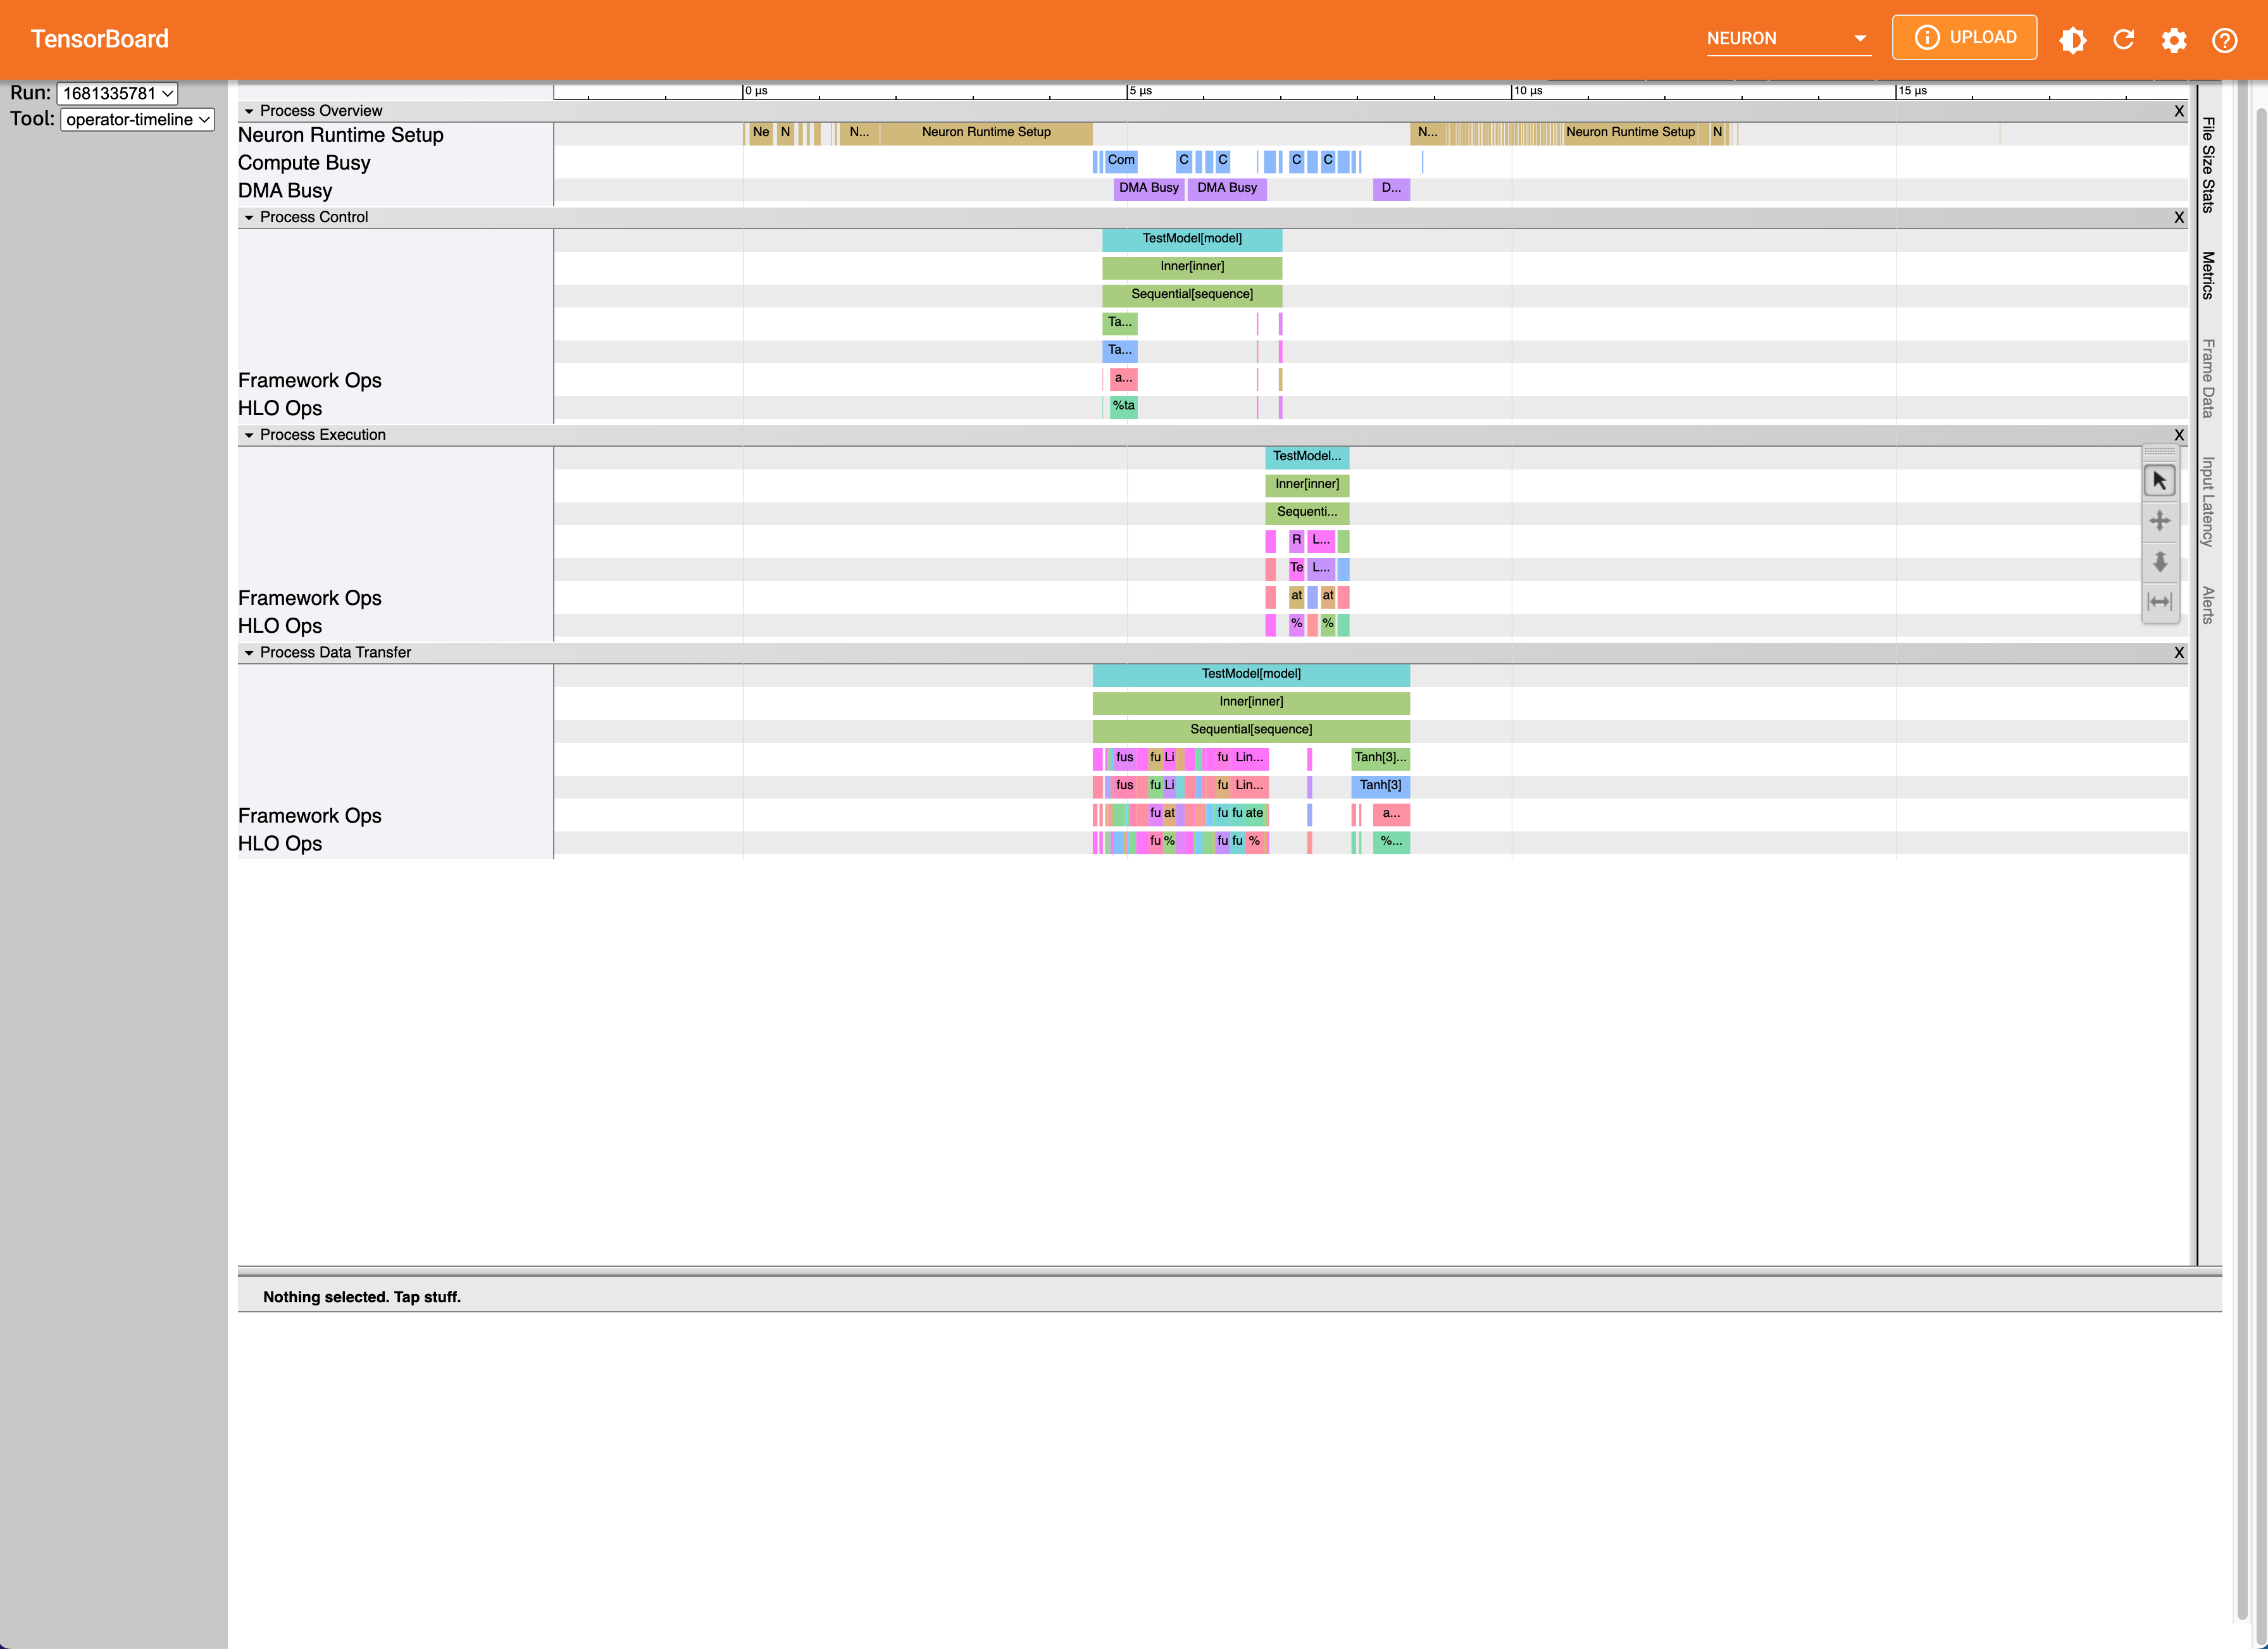
The operator timeline view is a detailed look into a single execution with Neuron. A high level overview at the top breaks down the execution into categories, including Neuron Runtime setup time, as well as NeuronCore compute engine and DMA engine busyness. Activity on the compute and DMA engines are further categorized as compute, control, and data transfer intervals which are shown as separate processes, with each showing a hierarchical view of the framework operators and their corresponding HLO operation. The fused operations can be a result of compiler optimizations or are operations that are running in parallel on the device. Each bar can be clicked to show information regarding which operators are overlapped.
This view can give better insight into how operators translate to Neuron, as well as how certain Neuron compiler options may improve performance.
Troubleshooting#
TensorBoard launch fails#
ImportError: cannot import name 'Mapping' from 'collections'
This is an issue with Python 3.10 and a dependency of an old tensorboard version. To workaround this error, please run
pip install --upgrade tensorboard. For more information, see tensorflow/tensorboard#5490.
This document is relevant for: Inf2, Trn1