
This document is relevant for: Inf1, Inf2, Trn1, Trn2, Trn3
Profiling Multi-Node Training Jobs with Neuron Explorer#
This tutorial demonstrates how to use Neuron Explorer to analyze performance during multi-node training on AWS Trainium instances. We will run a scaled-down version of the NxD Training Llama3 8B tutorial across 2 nodes, capture performance traces, and visualize them using Perfetto. we will run training across 2 nodes with reduced steps and layers so that compilation and profiling complete quickly.
Prerequisites#
Access to a multi-node Trainium cluster (4 nodes in this example)
Neuron SDK installed and configured along with NxD Training library installation
Review of the NxD Training Llama3 8B tutorial
Familiarity with SLURM job scheduling
Setup and Configuration#
Step 1: Initial Setup#
Download the dataset script:
# Download get_dataset.py
wget https://raw.githubusercontent.com/aws-neuron/neuronx-distributed/master/examples/training/llama/get_dataset.py
Create a directory for dataset and get the corresponding config file -
mkdir ~/examples_datasets/ && cd ~/examples_datasets/

# Download config.json
wget https://raw.githubusercontent.com/aws-neuron/neuronx-distributed/master/examples/training/llama/tp_zero1_llama_hf_pretrain/8B_config_llama3/config.json ~/
Get the tokenizer using the following code snippet -
# tokenizer.py
from huggingface_hub import login
from transformers import AutoTokenizer

login(token='YourHuggingFaceToken')

tokenizer = AutoTokenizer.from_pretrained('meta-llama/Meta-Llama-3-8B')

tokenizer.save_pretrained(".")
python3 tokenizer.py
Run the get_dataset.py -
python3 ~/get_dataset.py --llama-version 3
Clone neuronx-distributed-training git repo
cd ~
git clone https://github.com/aws-neuron/neuronx-distributed-training.git
cd ~/neuronx-distributed-training/examples
Step 2: Modify the Configuration Files#
Update the training configuration to minimize runtime while still generating useful profiling data:
In
hf_llama3_8B_config.yaml, make the following changes:
max_steps: 5             # Run only 5 steps for faster turnaround
num_layers: 2            # Reduce model depth to 2 layers
num_nodes: 2             # Run only 2 nodes
global_batch_size: 32    # Set a relatively smaller GBS to avoid large trace volume
These changes ensure the job compiles and runs quickly while still exercising the profiler.
In
train.sh, set the configuration file name:
CONF_FILE=hf_llama3_8B_config
This ensures the job runs with your modified config.
Step 3: Compile the Model#
Before training, the model must be compiled into Neuron Executable Files (NEFFs). To do this:
export COMPILE=1
export CONF_FILE=hf_llama3_8B_config

sbatch --exclusive \
    --nodes=2 \
    --cpus-per-task=128 \
    --wrap="srun ./train.sh"
COMPILE=1tells the script to run in compile-only mode.--nodes=2requests 2 Trainium nodes for compilation.srun ./train.shlaunches the job via Slurm across the allocated nodes.
Note
The first compilation may take some time depending on the model size. Once compiled, NEFFs are cached for reuse in later training runs.
Step 4: Run the Training Job with Profiling Enabled#
Now that compilation is done, we can run the training job while enabling Neuron Explorer:
export COMPILE=0
export CONF_FILE=hf_llama3_8B_config

NEURON_RT_INSPECT_DEVICE_PROFILE=1 NEURON_RT_INSPECT_ENABLE=1 \
NEURON_RT_INSPECT_OUTPUT_DIR=./output \
sbatch --exclusive \
    --nodes=2 \
    --cpus-per-task=128 \
    --wrap="srun ./train.sh"
Here’s what’s happening:
COMPILE=0: Use precompiled NEFFs instead of recompiling.NEURON_RT_INSPECT_ENABLE=1: Turns on runtime inspection for profiling.NEURON_RT_INSPECT_OUTPUT_DIR=./output: All profiler logs will be saved into the./outputdirectory.Slurm runs the job across 2 nodes with 128 CPUs per task.
At the end of this step, you should see an output directory containing runtime inspection logs from each node.
Step 5: Generate a Perfetto Profile#
Neuron Explorer produces raw trace data. To visualize it, convert the logs into a Perfetto compatible trace file:
Run the Neuron Explorer CLI:
neuron-profile view -d ./output --output-format perfetto
This command consolidates the logs and generates a Perfetto compatible trace file.
Step 6: Visualize in Perfetto#
Download the generated trace file to your local machine.
Open the Perfetto UI.
Drag and drop the trace file into the browser window.
You’ll now see a timeline view of your training job, including kernel execution, operator scheduling, and activity across NeuronCores. This visualization helps you identify compute vs. memory bottlenecks, idle time, and overall efficiency of the training job.
Step 7: Understanding the System Level Profile#
Once the profile is loaded in Perfetto, you’ll see both nodes (2 in our case) along with their workers, listed on the left-hand side as process IDs (PIDs). Each worker captures the same trace, so expanding any one of them will give you the information you need. The key runtime event to focus on is the Neuron Runtime API call named nc_exec_running. This API is responsible for executing a Neuron Executable File (NEFF) on the NeuronCores.
If you hover over or click on one of these calls, Perfetto will display details about which NEFF is being executed. While you may see other runtime API calls, our primary interest is in nc_exec_running since it directly represents the model execution on Neuron hardware.
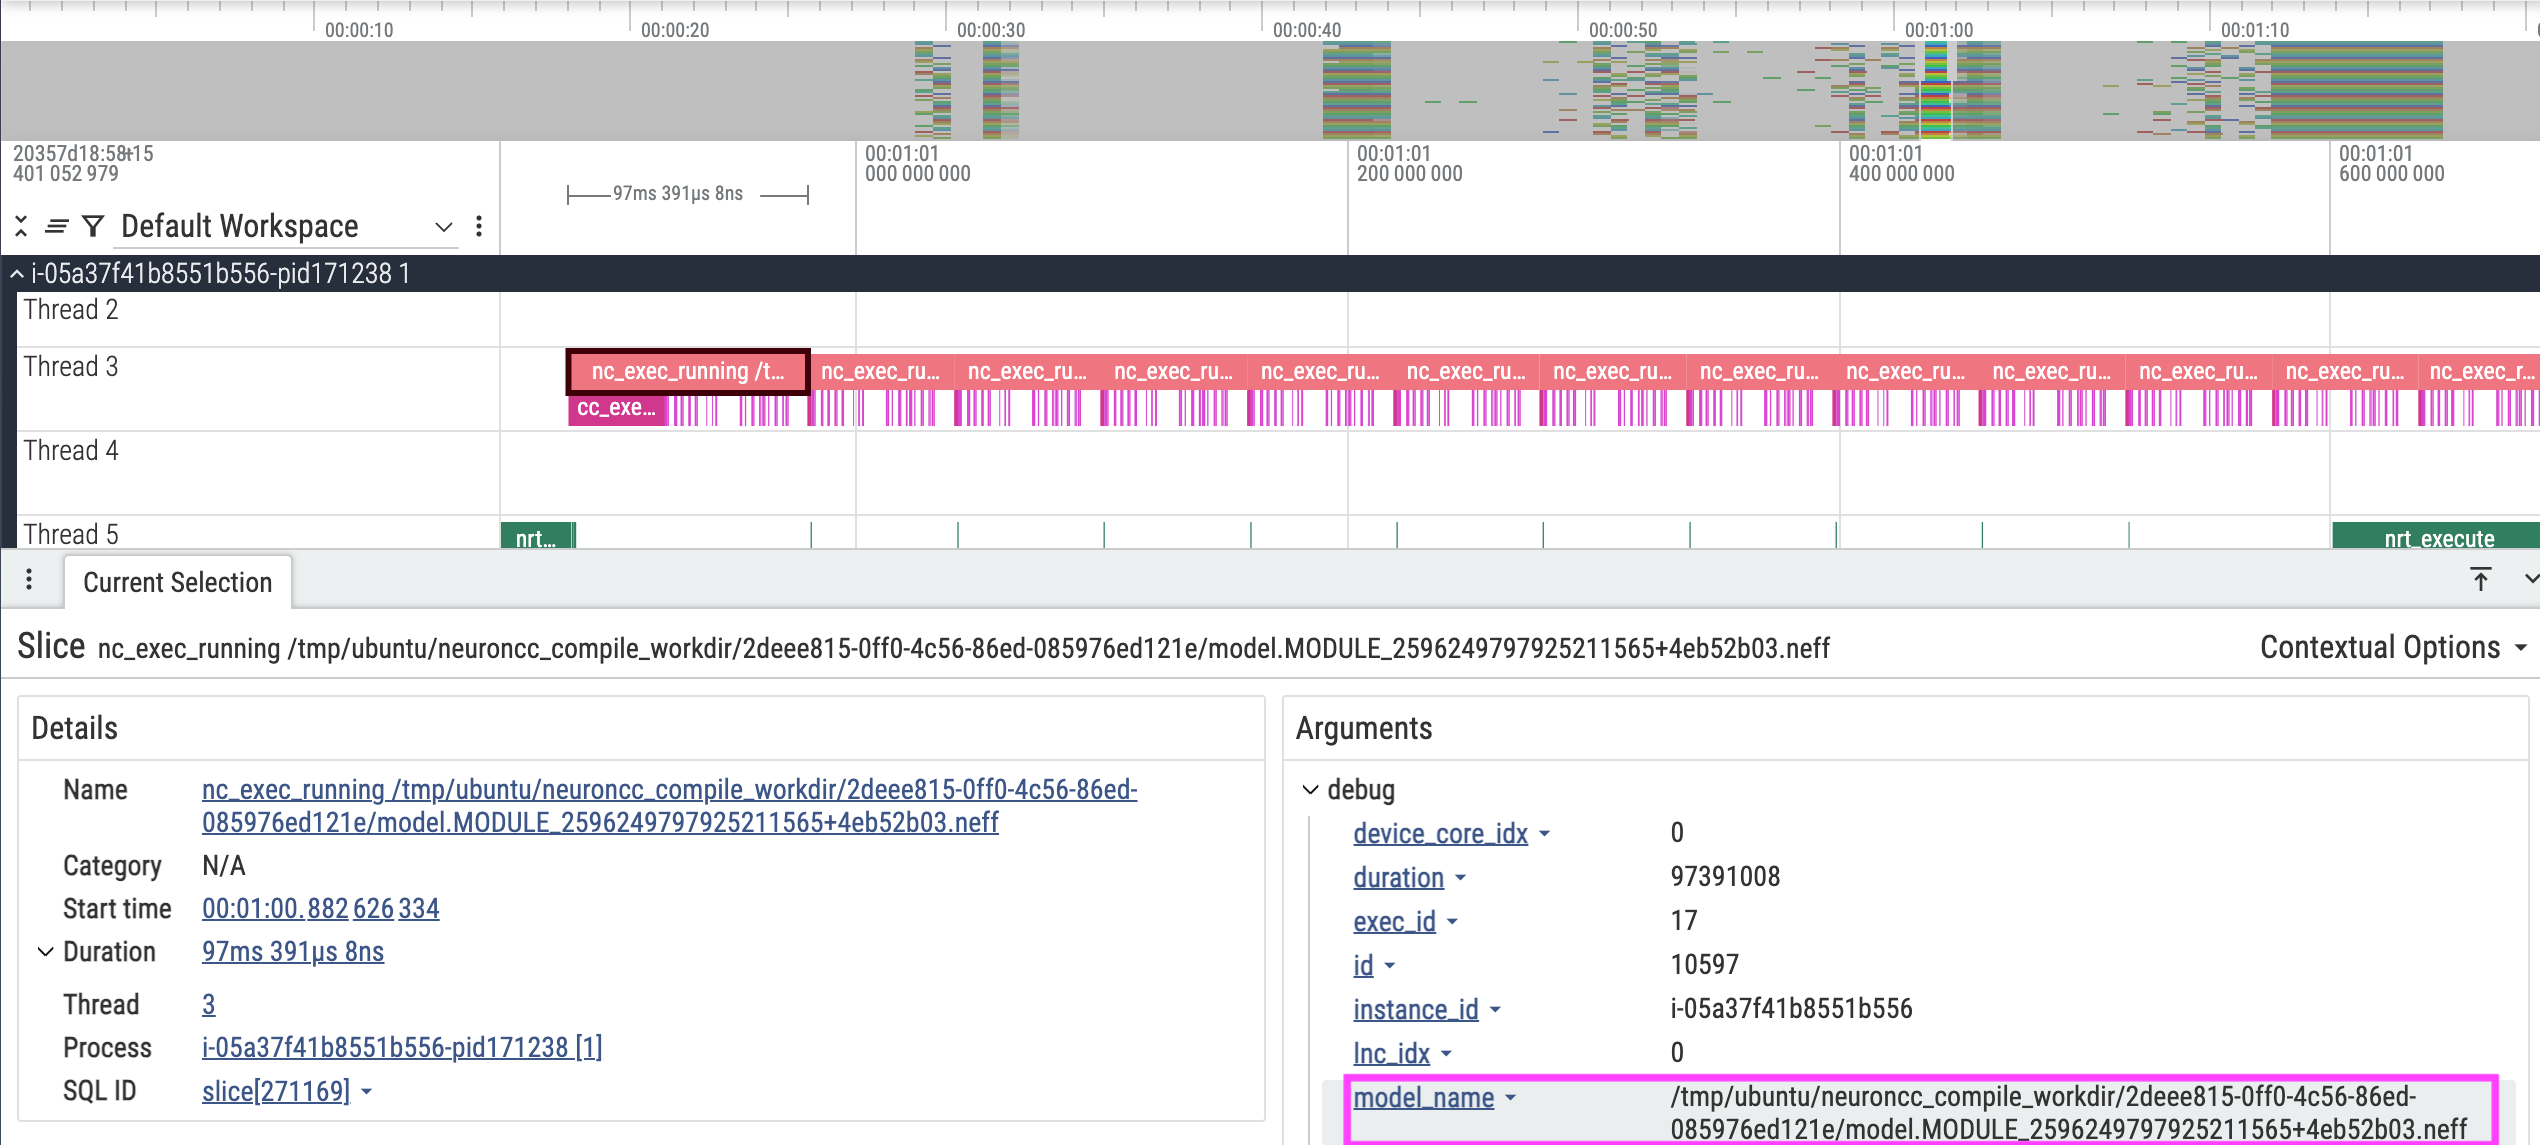
In the example trace shown, the calls to nc_exec_running appear back-to-back with no significant delays in between. This indicates that, at a system level, the runtime is efficiently dispatching work to NeuronCores. The model_name field in the arguments section will display the name of the NEFF which is being used in the corresponding nc_exec_running.
Step 8: Linking to device level profiles#
Since we are able to see the NEFF name from nc_exec_running api call, we will now see how to visualize the profile for that NEFF. This effectively means how the model performance on a given Neuron core looks like. For this, on your trainium cluster, navigate to your compile cache directory (If you are following this tutorial it could be set as compiler_cache_url in config.yaml file). Navigate to the directory and search for the respective module directory based on the name, and you will see artifacts in that directory as shown below -
├── compile_flags.json
├── model.done
├── model.hlo_module.pb
└── model.neff
This document is relevant for: Inf1, Inf2, Trn1, Trn2, Trn3