
This document is relevant for: Inf1
Neuron Plugin for TensorBoard (Inf1)#
Overview#
This guide is for developers who want to better understand how their model is executed using Neuron SDK through TensorBoard.
The Neuron plugin for TensorBoard provides metrics to the performance of machine learning tasks accelerated using the Neuron SDK. It is compatible with TensorBoard versions 1.15 and higher. It provides visualizations and profiling results for graphs executed on NeuronCores.
Note
The following information is compatible with Neuron SDK for Inf1. For a walkthrough on the latest version, please check out the guide Neuron Plugin for TensorBoard (Trn1).
Note
Graph visualization is currently only supported for TensorFlow-Neuron. Support for MXNet-Neuron and PyTorch-Neuron visualization will be added in a future release.
Compile the neural network#
Refer to the following guides on how to compile a graph using Neuron SDK.
- TensorFlow-Neuron
- PyTorch-Neuron:
“Compile model for Neuron” in PyTorch-Neuron Resnet50 Tutorial
- MXNet-Neuron:
Enable profiling#
In this step, we enable Neuron profile data collection and collect results from executing an inference.
4.1. To start profiling the neural network and collect inference traces, create a
directory where profile data will be dumped and set the NEURON_PROFILE environment
variable. In this example, we will assume this directory is $HOME/profile
mkdir -p $HOME/profile
export NEURON_PROFILE=$HOME/profile
4.2. Ensure Neuron Tools are executable by setting the PATH environment variable.
export PATH=/opt/aws/neuron/bin:$PATH
4.3. Execute inference!
Note
Please run the inference script outside of Jupyter notebook. Profiling in Jupyter notebook is not supported at this time.
Note
Please ensure the inference script executes only one inference, as profiling results are currently only supported for a single inference.
For more info on how to execute inference, refer to the following guides:
- TensorFlow-Neuron
- PyTorch-Neuron
“Run inference on Single Core” in ResNet50 model for Inferentia
- MXNet-Neuron
4.4. Check if profiling results were successfully saved. In the directory
pointed to by NEURON_PROFILE environment variable set in Step 4.1, there
should be at least two files, one with the .neff extension and one with the
.ntff extension. For TensorFlow-Neuron users, the graph file (.pb) will
also be in this directory.
ls $NEURON_PROFILE
Launch TensorBoard#
In this step, we will process the Neuron profile data and launch TensorBoard.
5.1. Install the Neuron plugin for Tensorboard.
If you are using the DLAMI TensorFlow-Neuron Conda environment, please run the following to update TensorBoard before installing the Neuron plugin.
pip install "tensorboard<=2.4.0" --force-reinstall
Modify Pip repository configurations to point to the Neuron repository:
tee $VIRTUAL_ENV/pip.conf > /dev/null <<EOF
[global]
extra-index-url = https://pip.repos.neuron.amazonaws.com
EOF
pip install tensorboard-plugin-neuron
5.2. After collecting the raw profile data, we need to post-process it to create the
log files used by the Neuron plugin. This can be done when launching TensorBoard
by passing an extra flag --run_neuron_profiler. Using this flag will create the
directory specified by --logdir and populate it with Neuron plugin data. Please
note that the NEURON_PROFILE environment variable set in Step 4.1 must still point
to the same directory as before.
tensorboard --logdir results --run_neuron_profiler
Note
If using TensorBoard >= 2.5, please use the --load_fast=false option when launching.
tensorboard --logdir results --run_neuron_profiler --load_fast=false
5.3. After you see the following message, TensorBoard is ready to use. By default,
TensorBoard will be launched at localhost:6006 on the Deployment Instance.
...
Running neuron-profile
Serving TensorBoard on localhost; to expose to the network, use a proxy or pass --bind_all
TensorBoard 2.4.1 at http://localhost:6006/ (Press CTRL+C to quit)
View results in TensorBoard#
In this step, we will view the Neuron plugin for TensorBoard from a browser on your local development machine.
6.1. Connect to the Deployment Instance while enabling port forwarding. In this example, we
assume TensorBoard has been launched using the default address localhost:6006 on the
Deployment Instance.
# if Ubuntu-based AMI
ssh -i <PEM key file> ubuntu@<instance DNS> -L 6006:localhost:6006

# if AL2-based AMI
ssh -i <PEM key file> ec2-user@<instance DNS> -L 6006:localhost:6006
6.2. In a browser, visit localhost:6006.
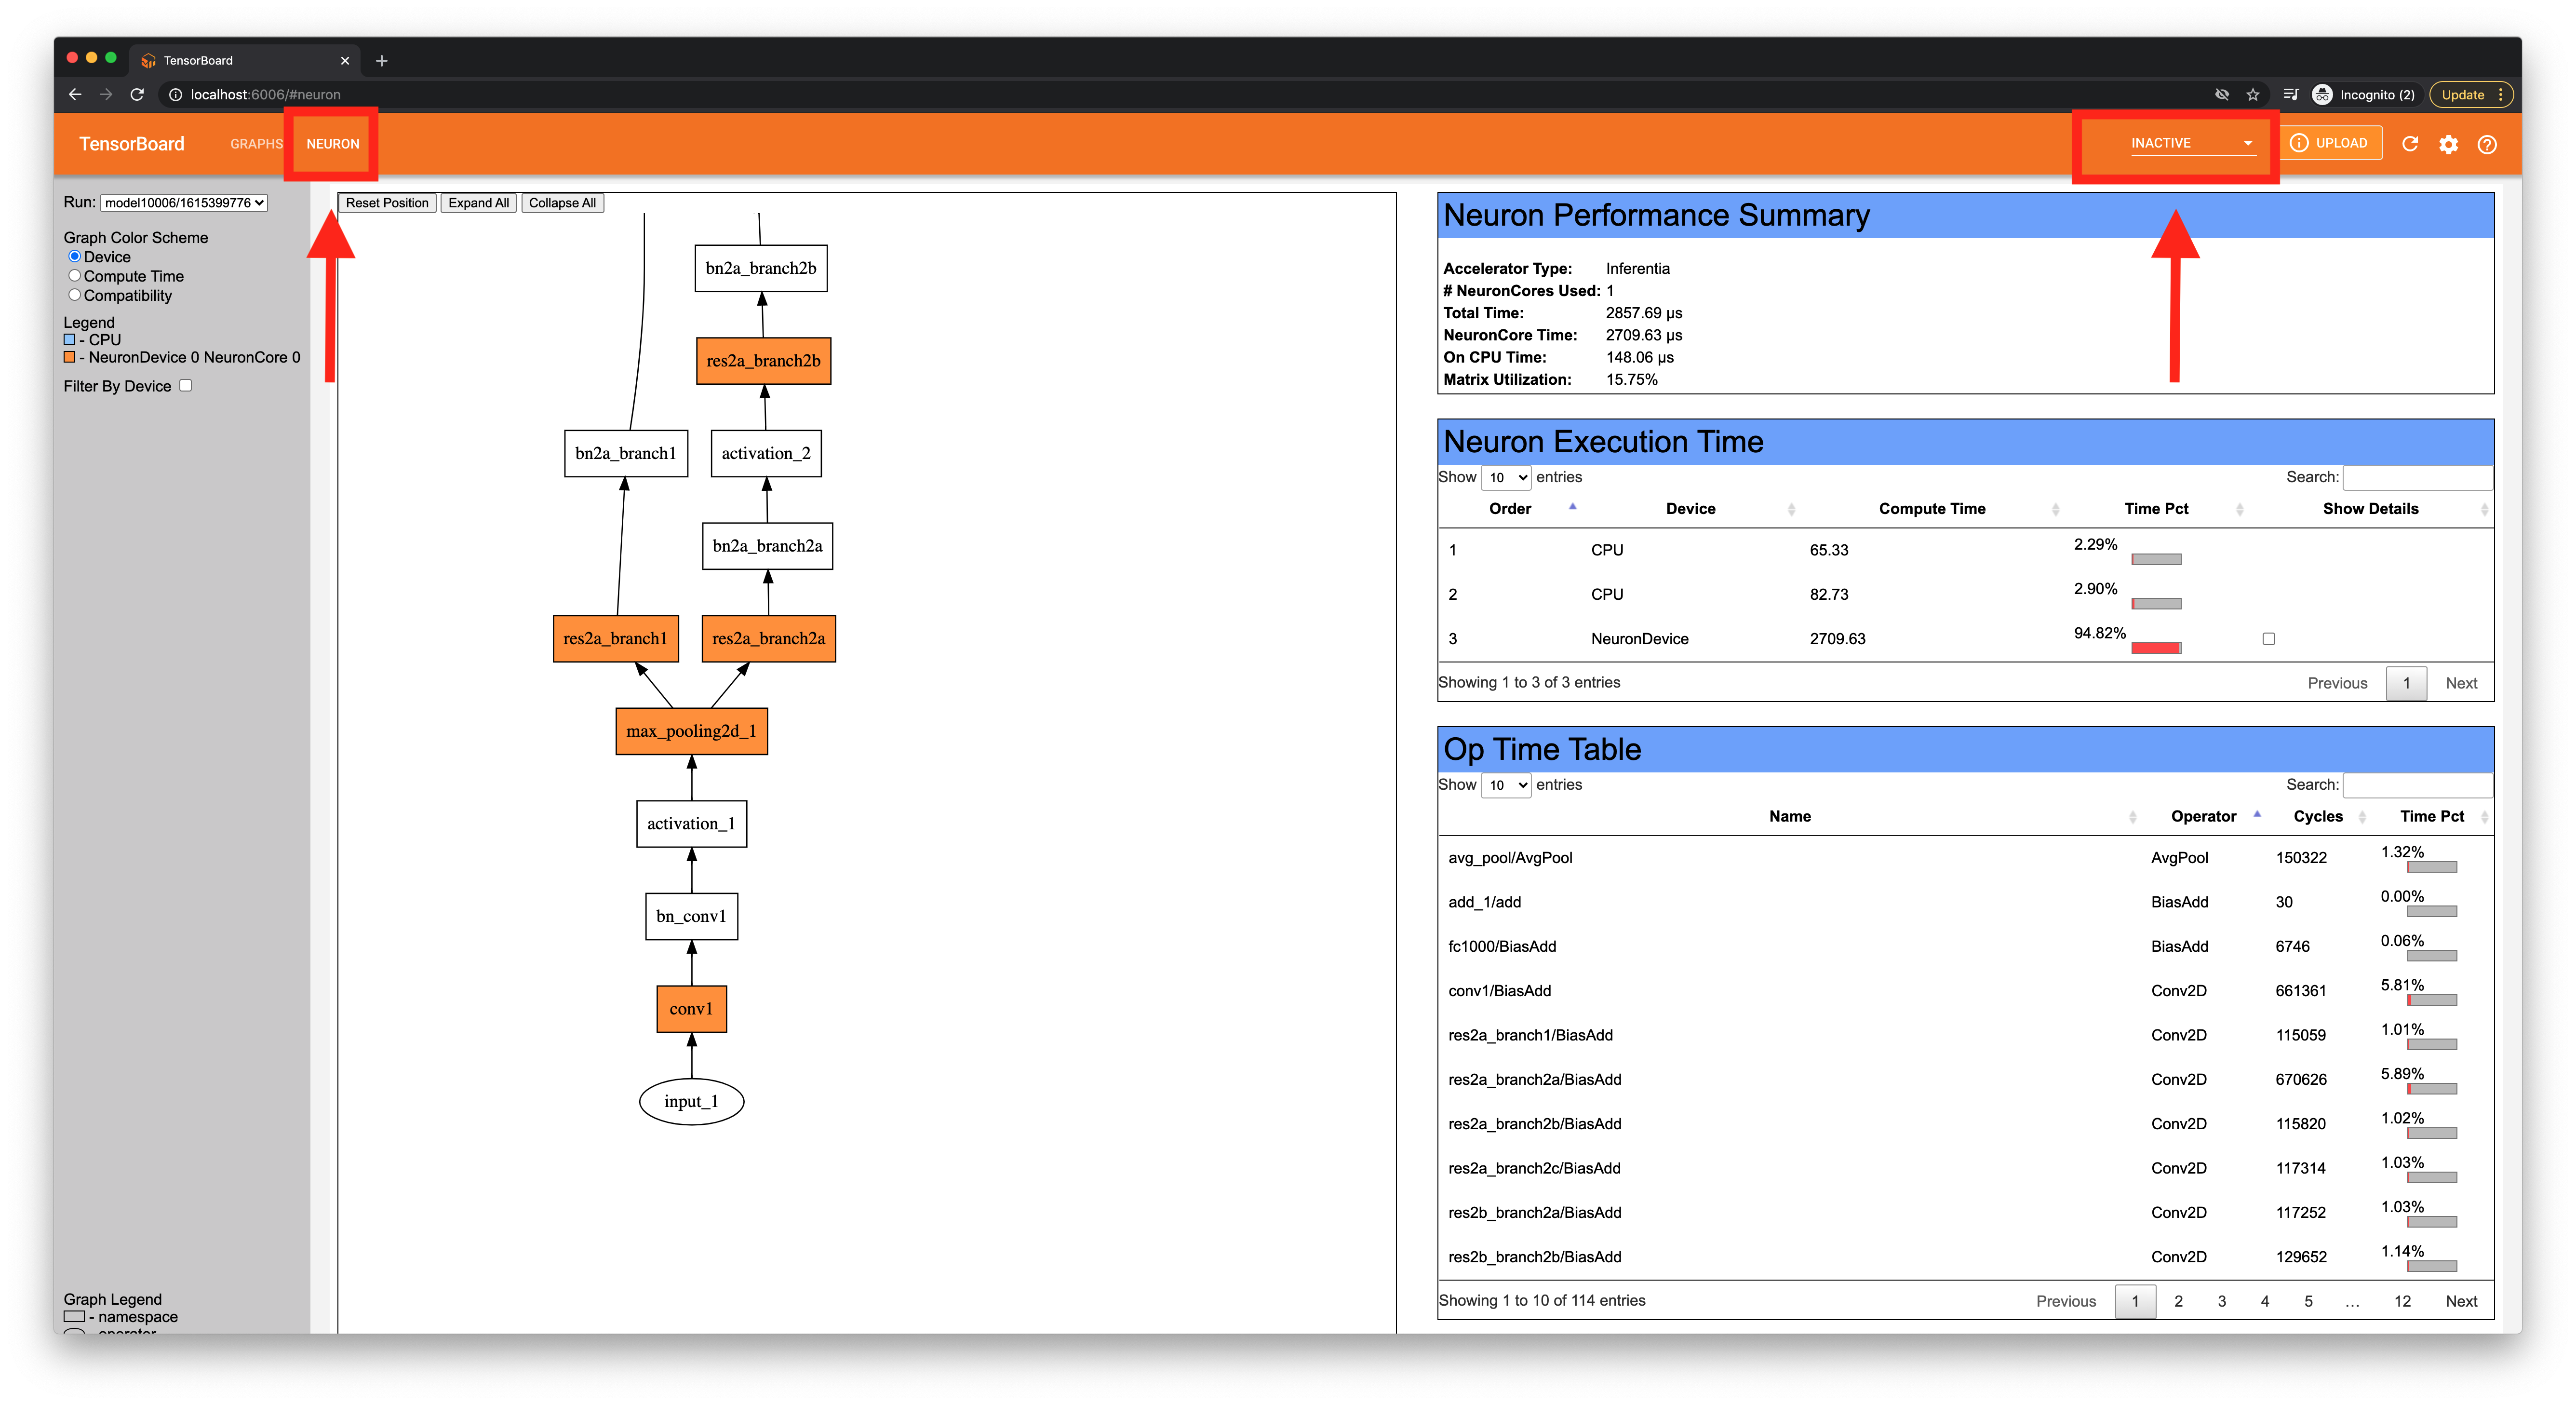
6.3. In the top navigation bar, switch from Graphs to Neuron. If it does not show up,
please wait a while and refresh the page while the plugin loads. If the issue persists, check
the Inactive dropdown list on the right and check for Neuron.
6.4. If TensorBoard failed to find the generated logs, you will see the following message:
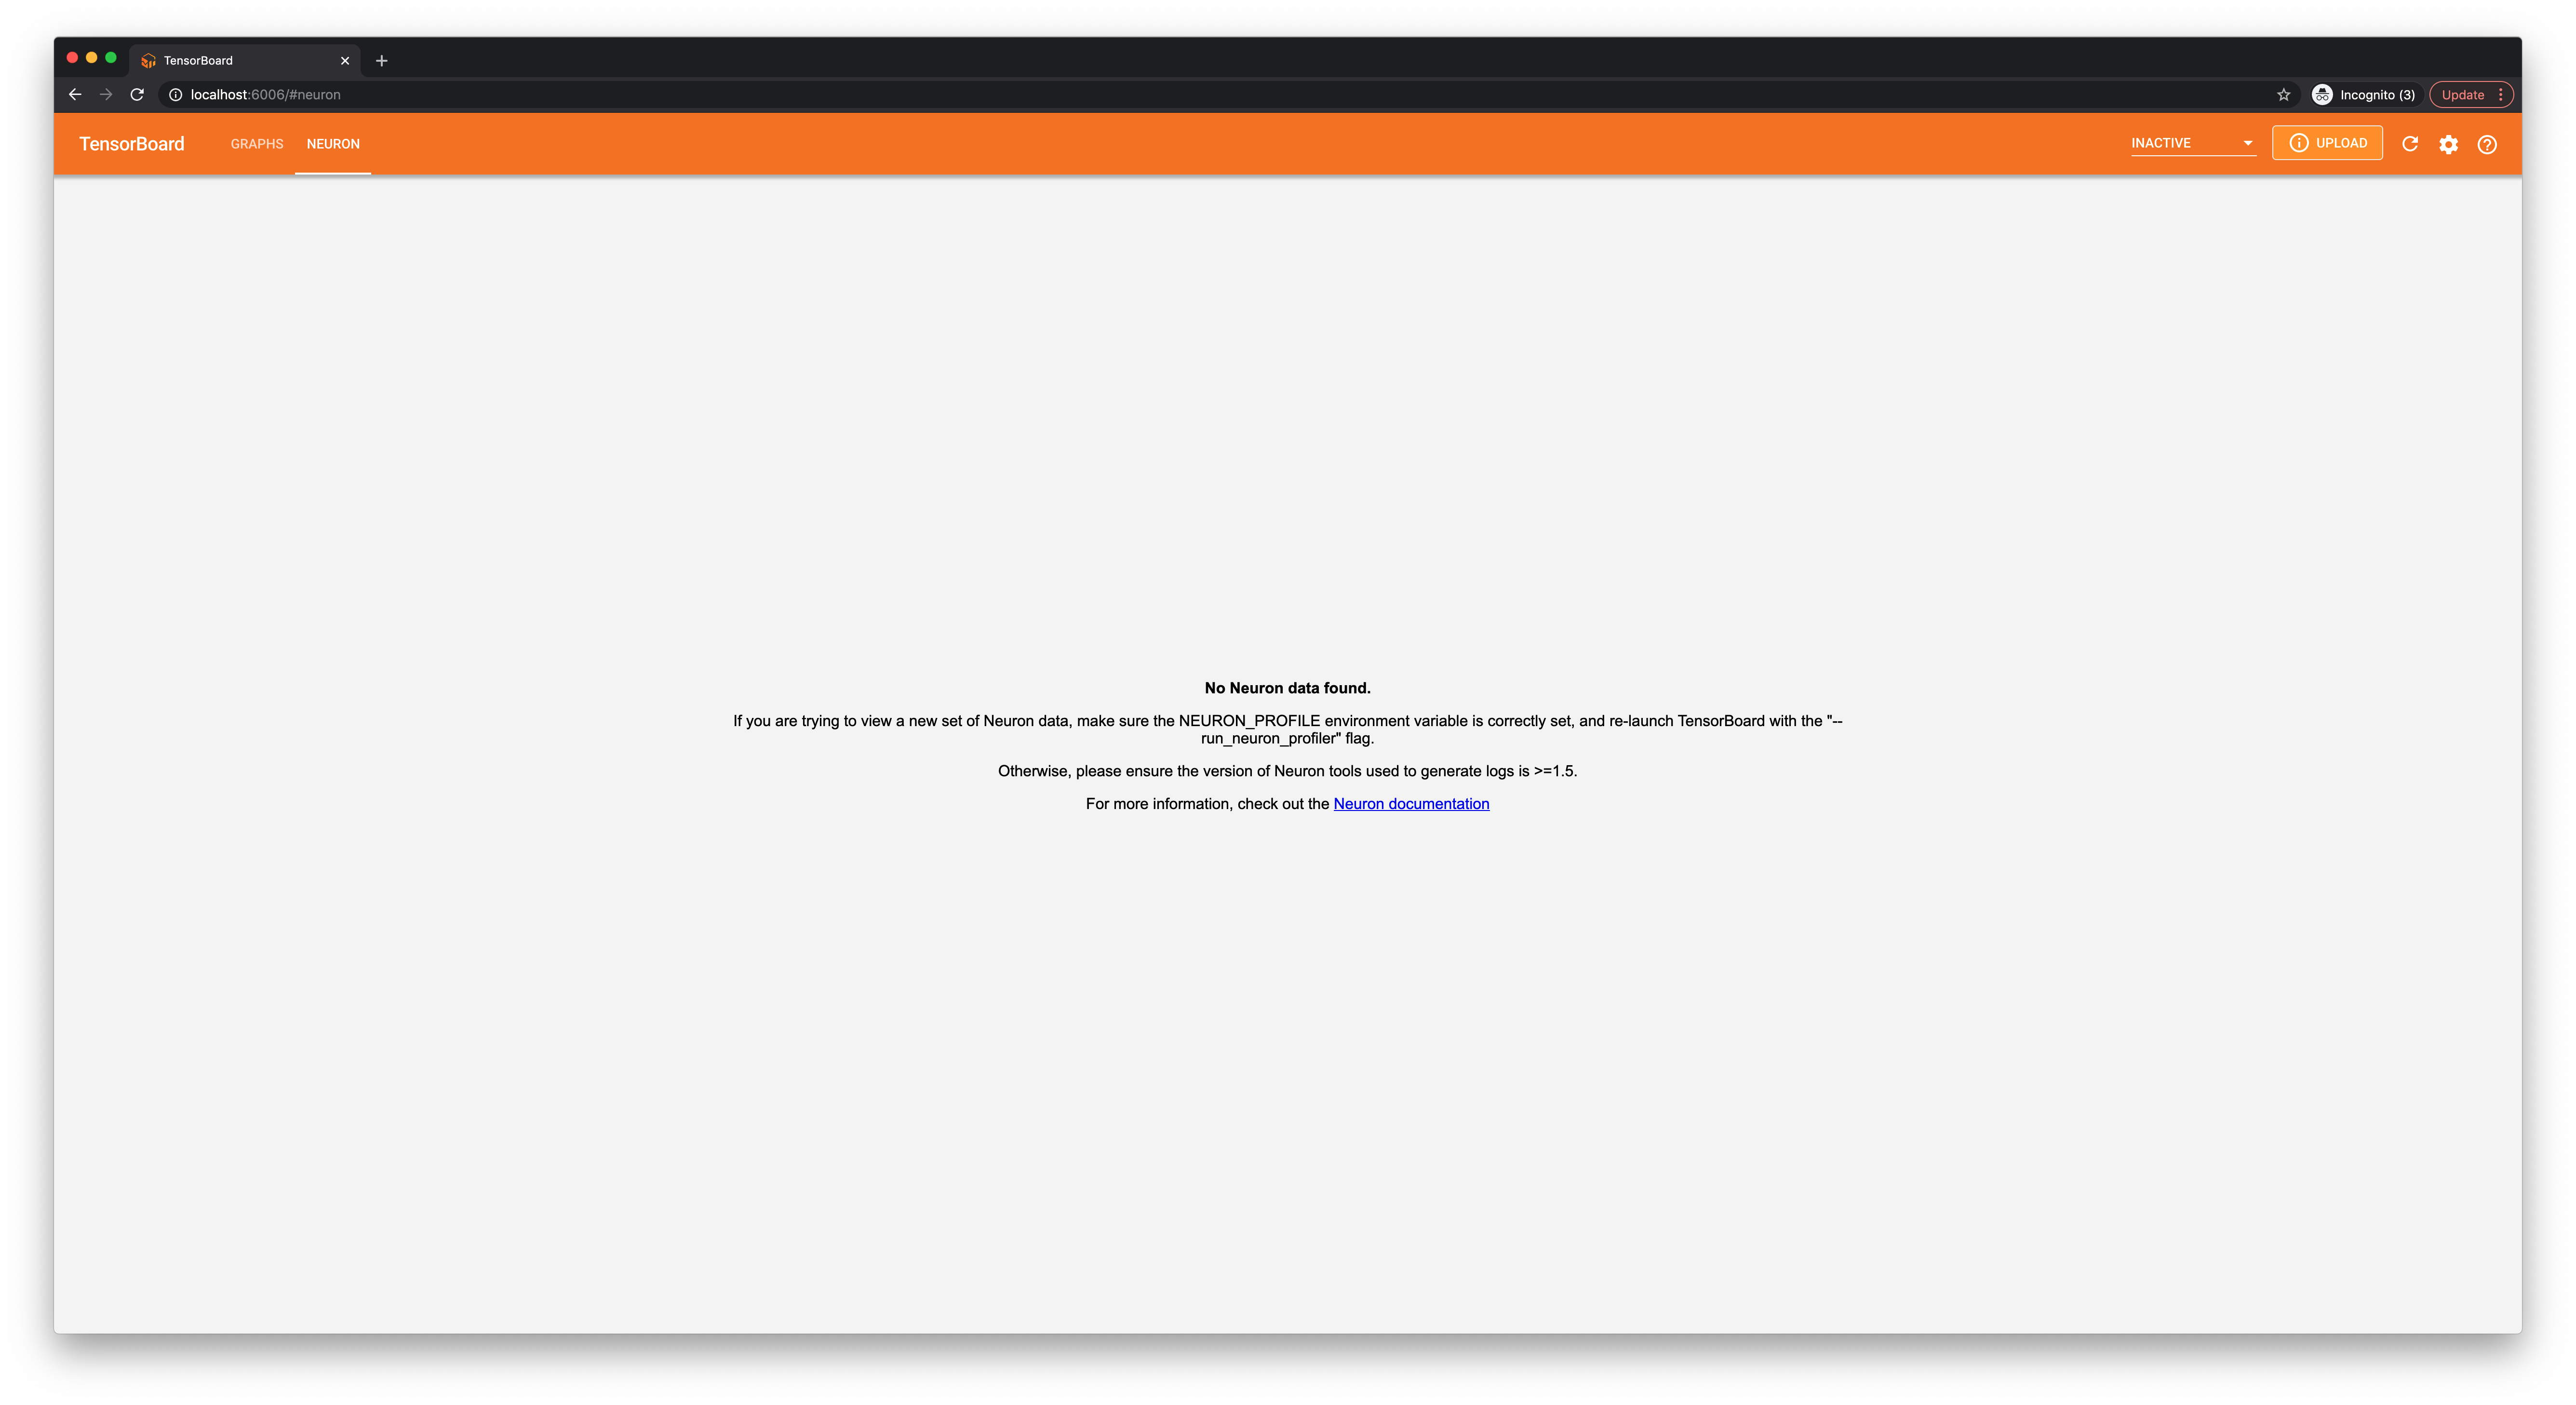
In this case, please check the console output on the Deployment Instance where TensorBoard was
launched for any warnings or error messages, and make sure the version of the aws-neuron-tools
package is compatible.
Visualize graphs executed on Neuron#
Show how the graph was partition to run on NeuronCores#
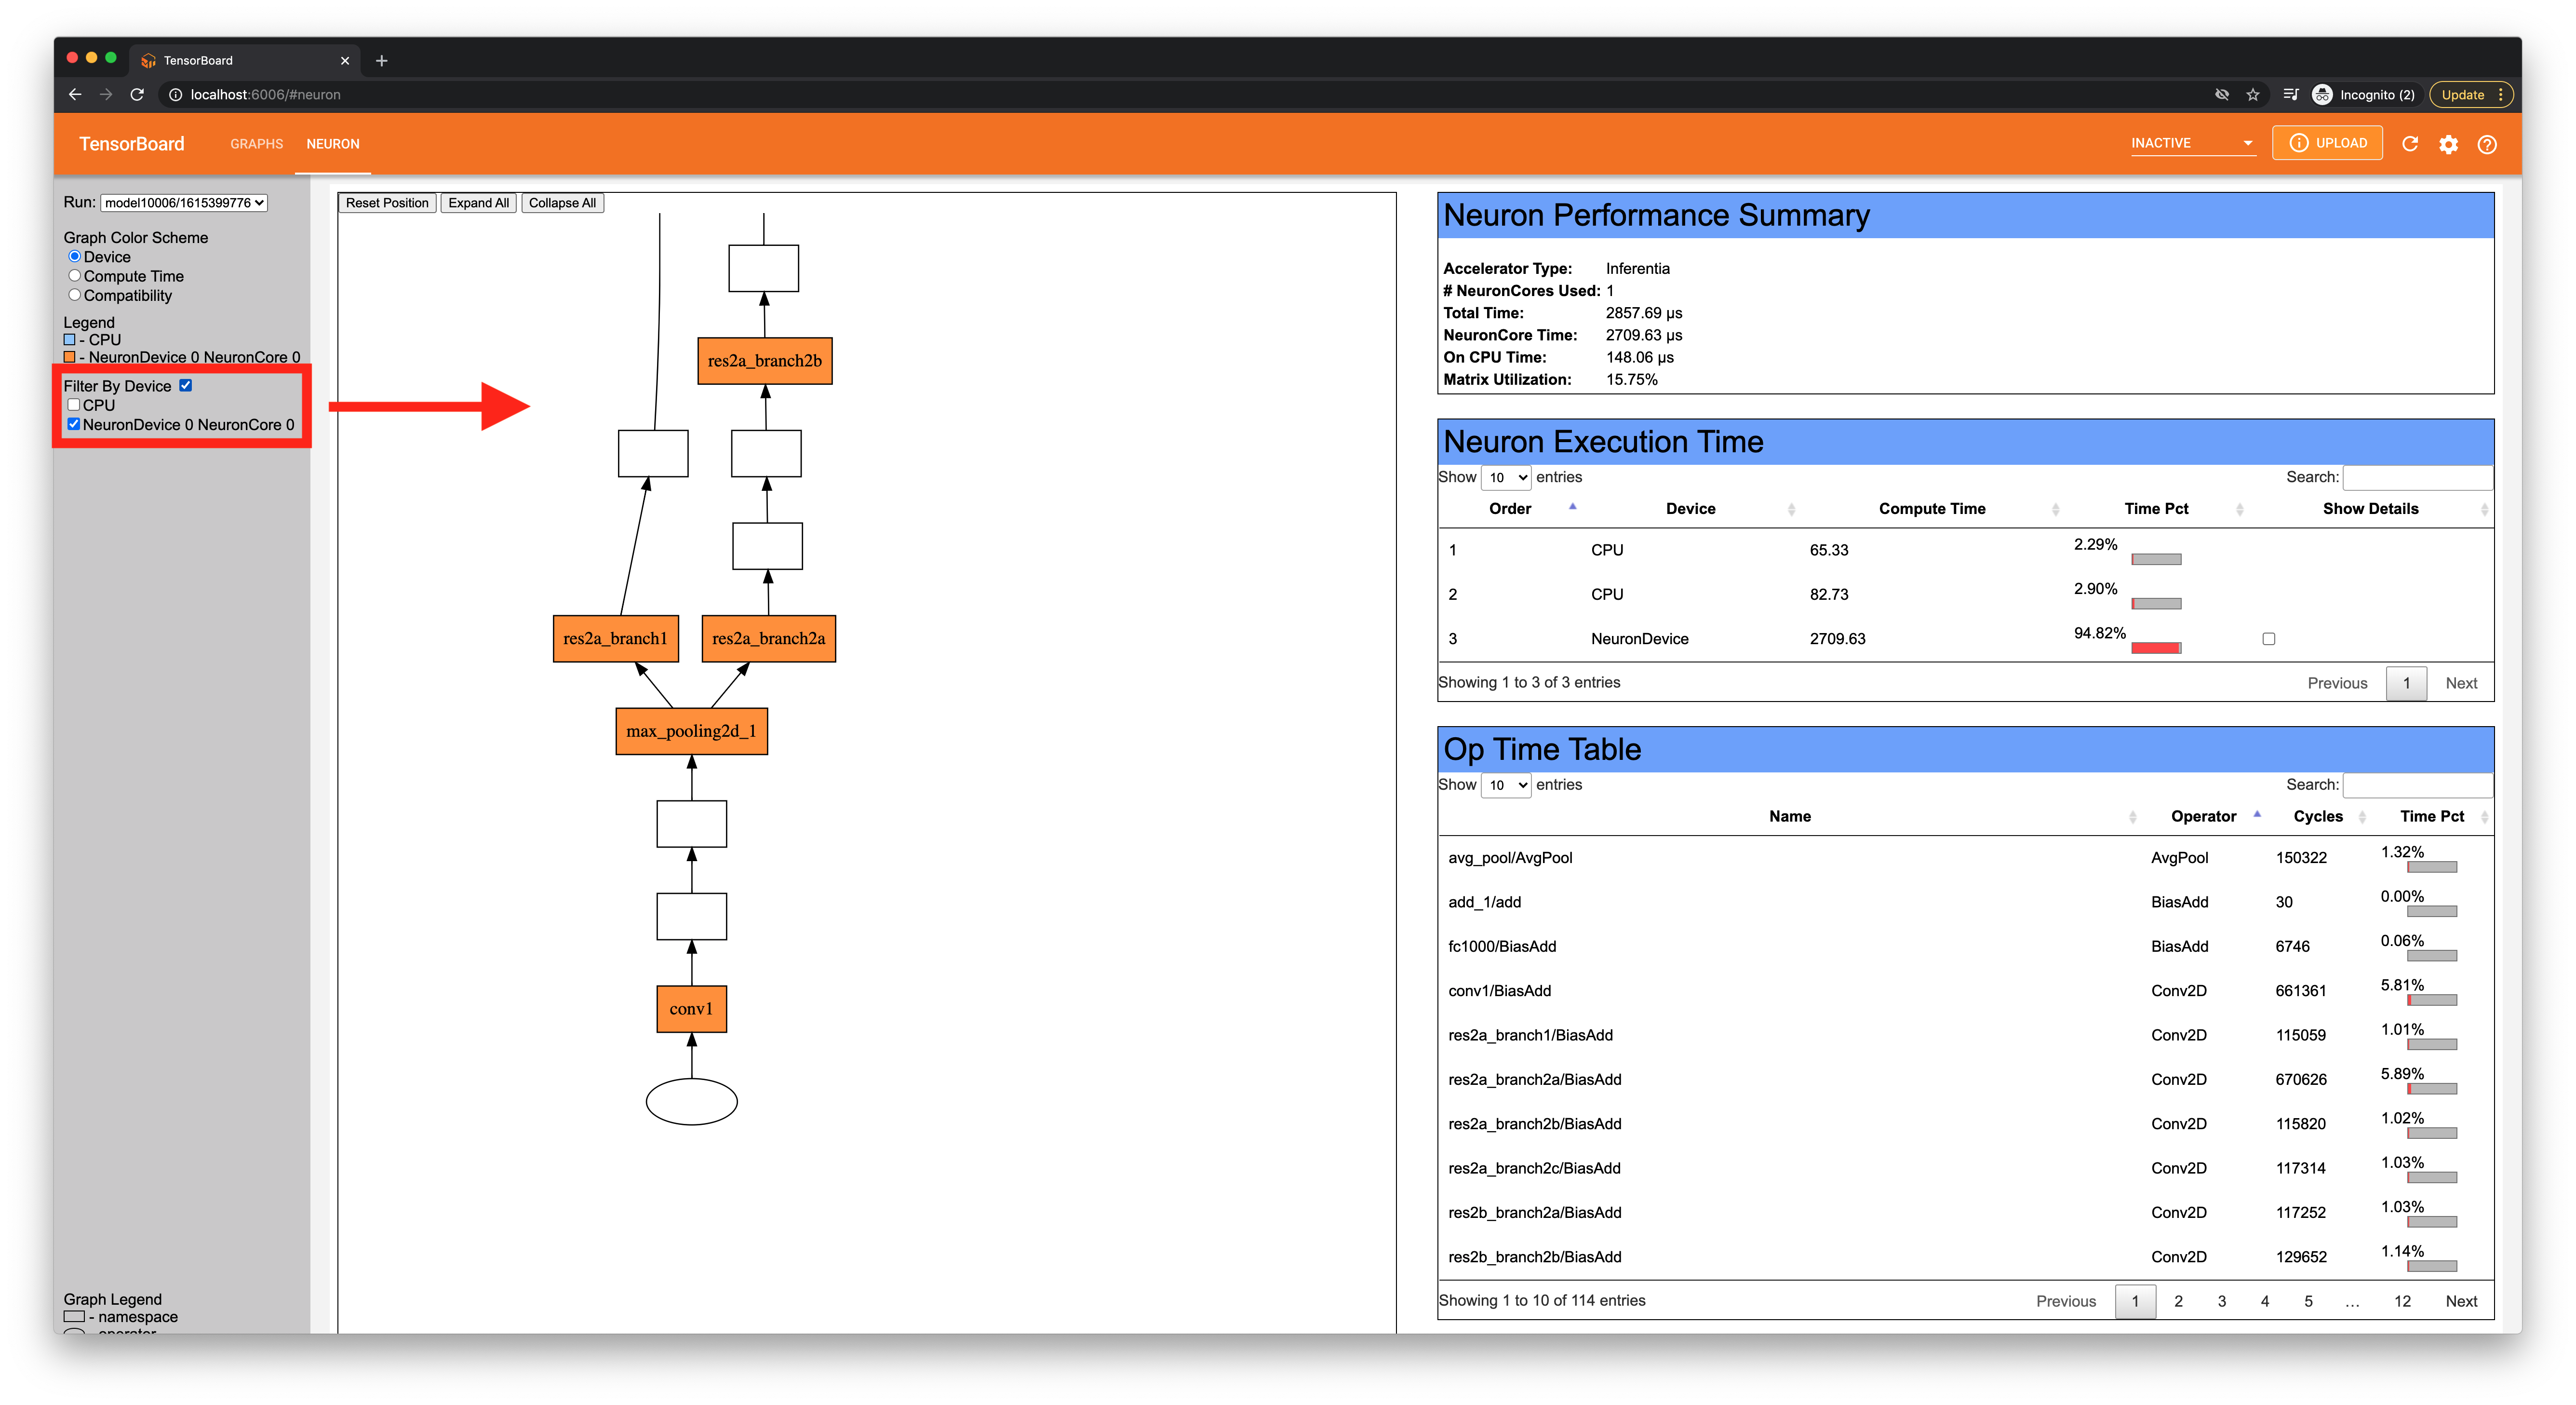
To view how the graph was partitioned to run on NeuronCores, select “Device” under “Graph Color Schemes” in the left navigation bar.
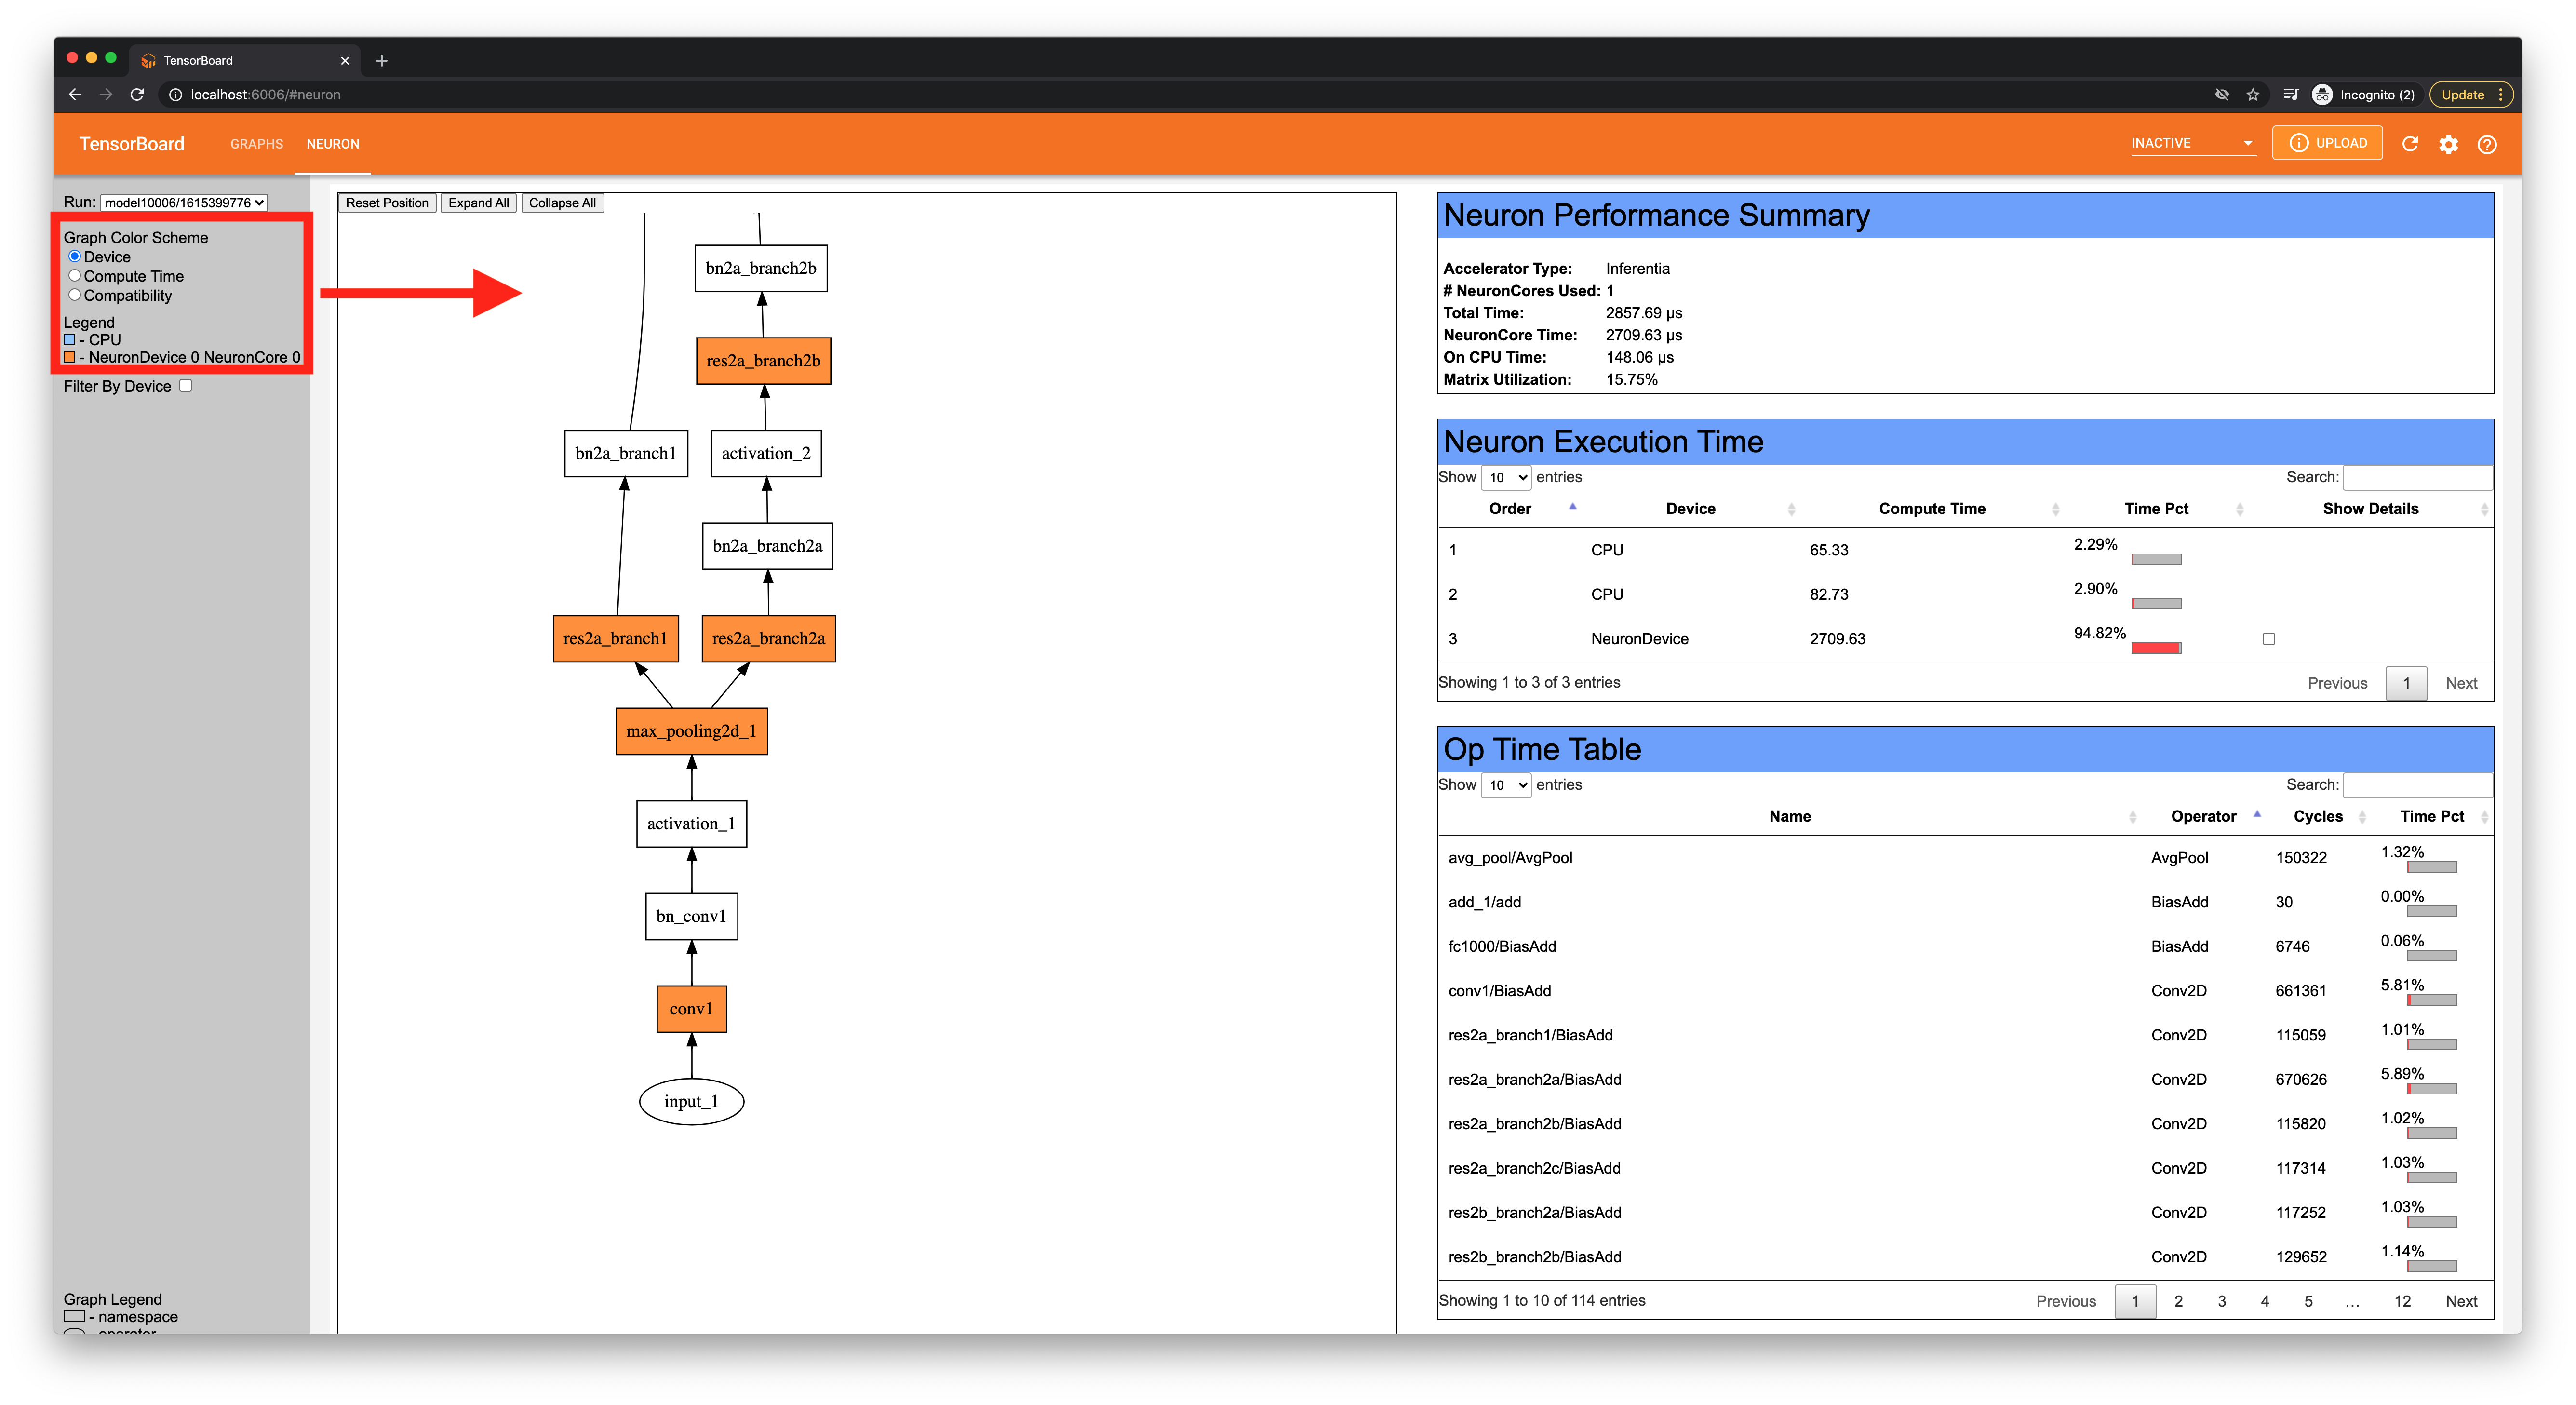
Each operator will be colored according to the device used. In this example, light blue indicates an operator was executed on CPU, and orange indicates the operator was executed on NeuronCores. Operators that are white may have been optimized by the Neuron compiler and fused into another operation.
Inspect which operators consumes the most time#
You can also view how long each operator took by changing to the “Compute time” color scheme.
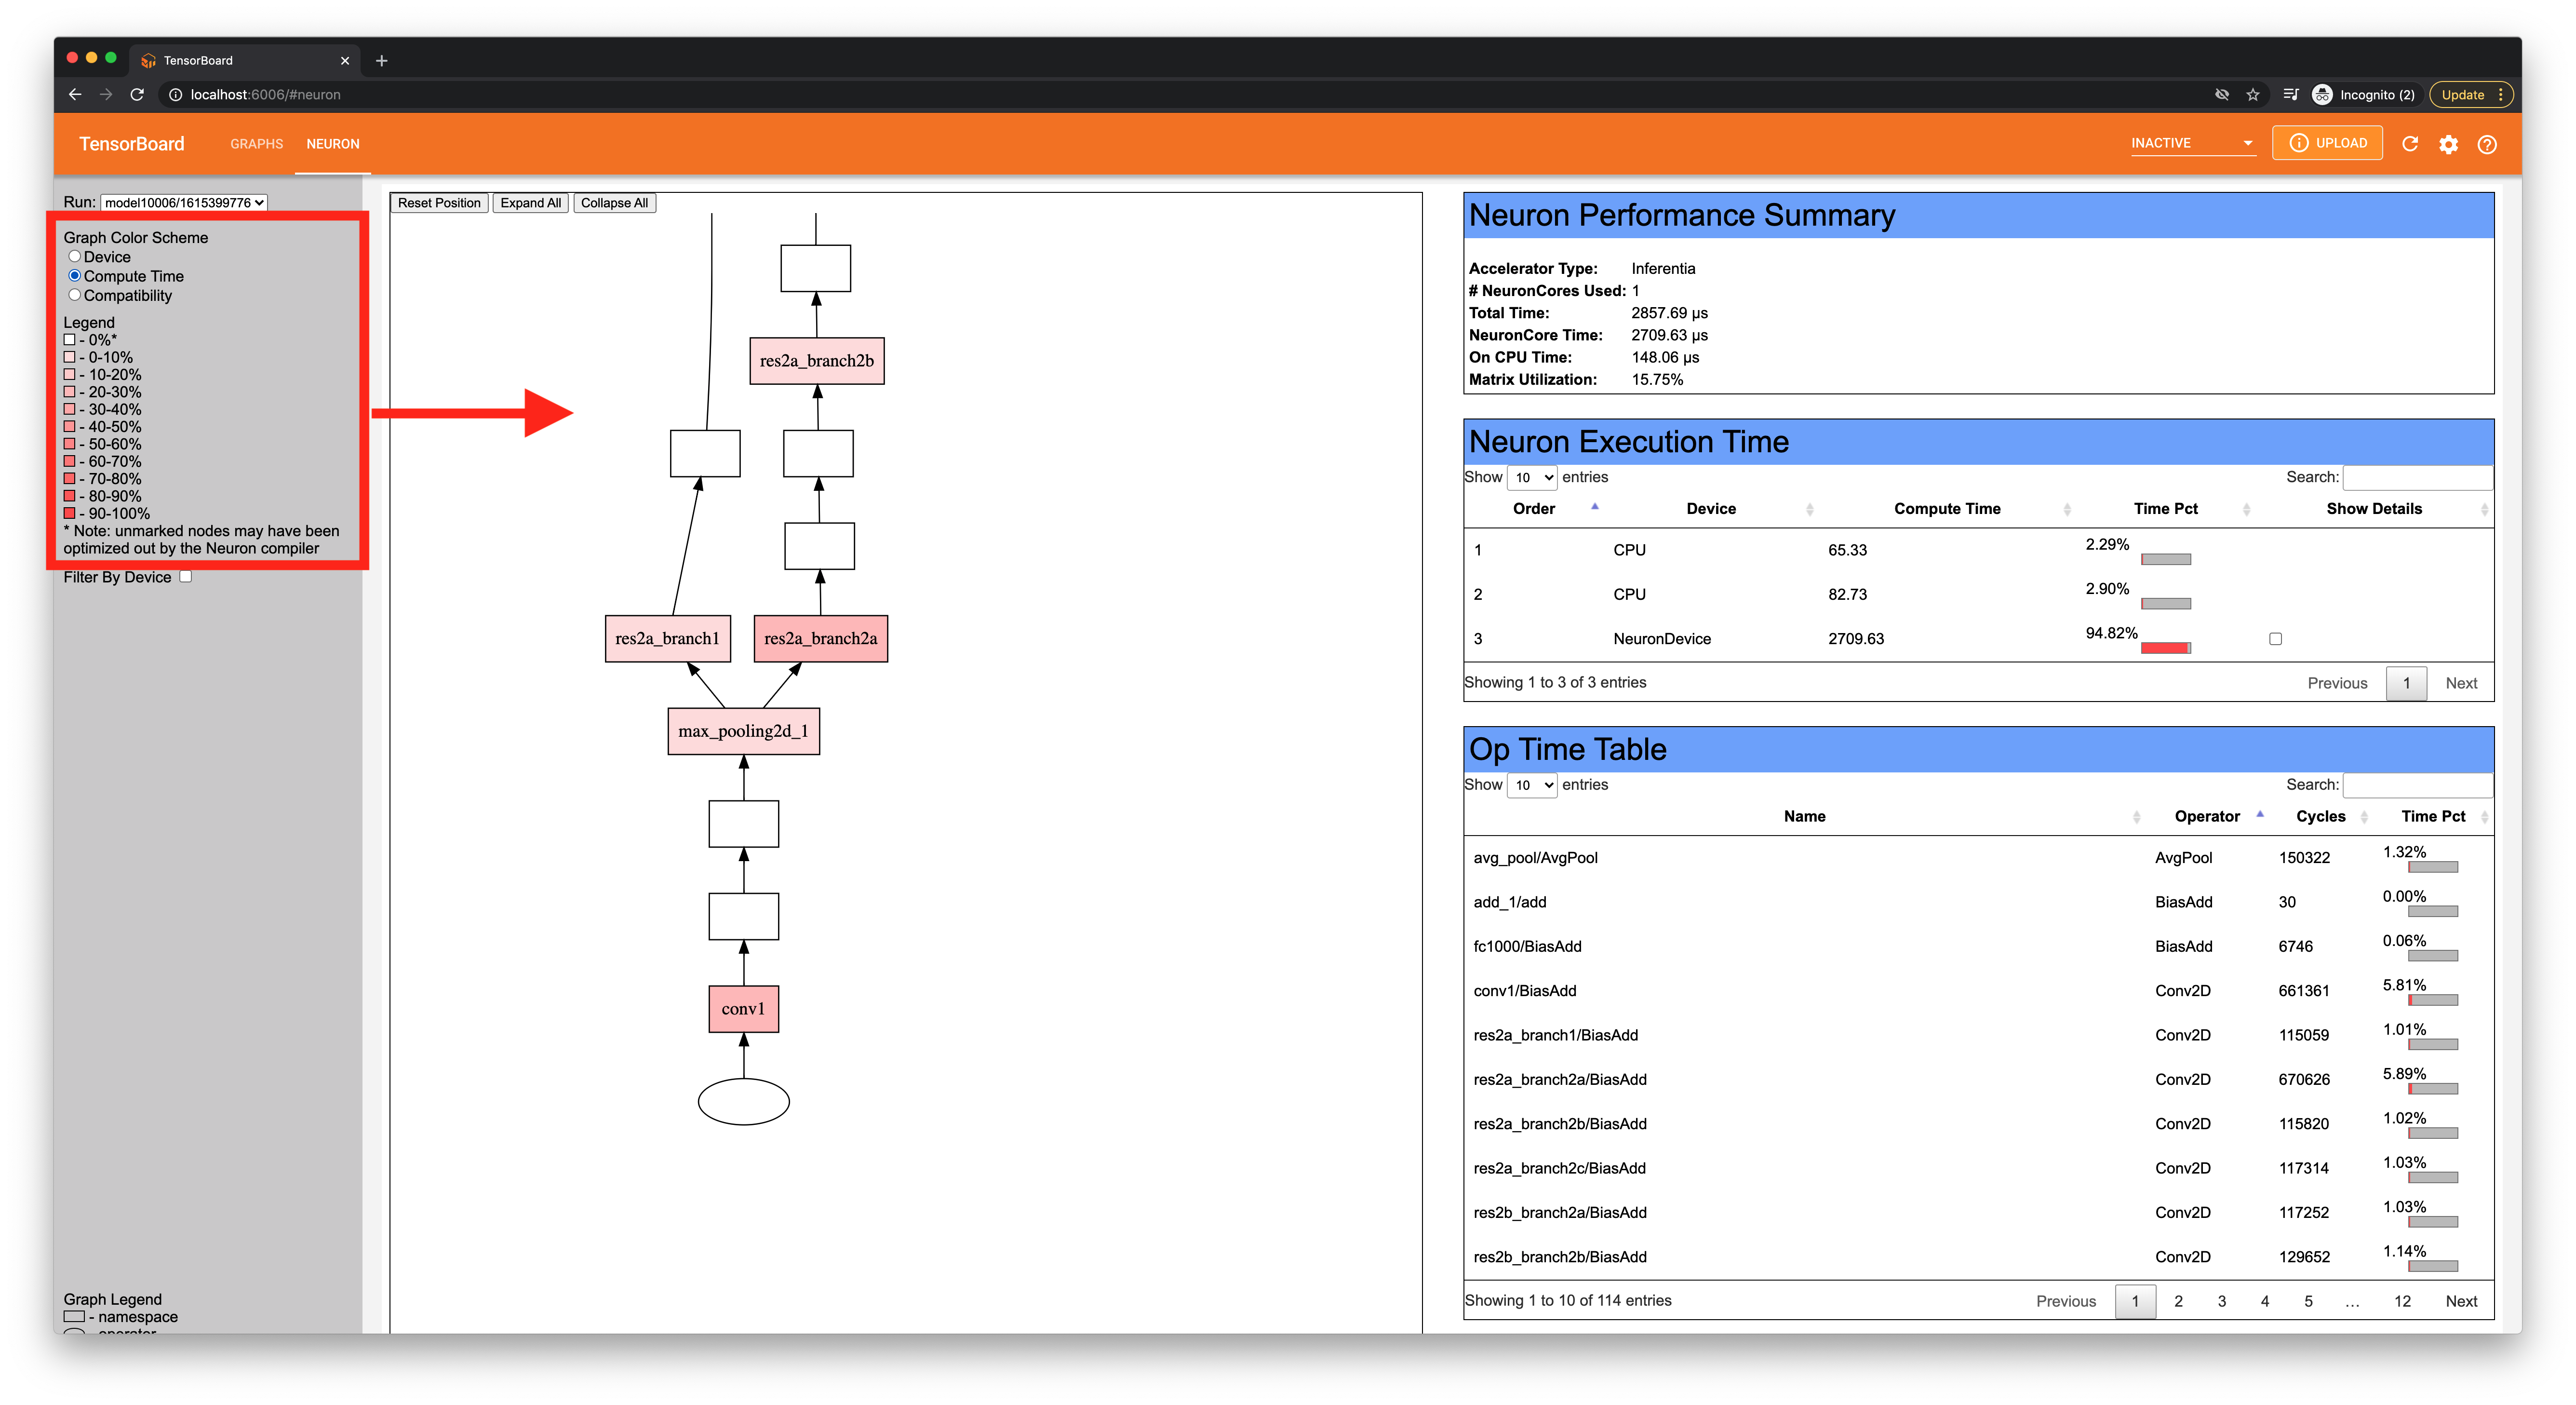
This view will show time taken by each layer and will be colored according to how much relative time the layer took to compute. A lighter shade of red means that a relatively small portion of compute time was spent in this layer, while a darker red shows that more compute time was used.
Check out Neuron support operators for each framework#
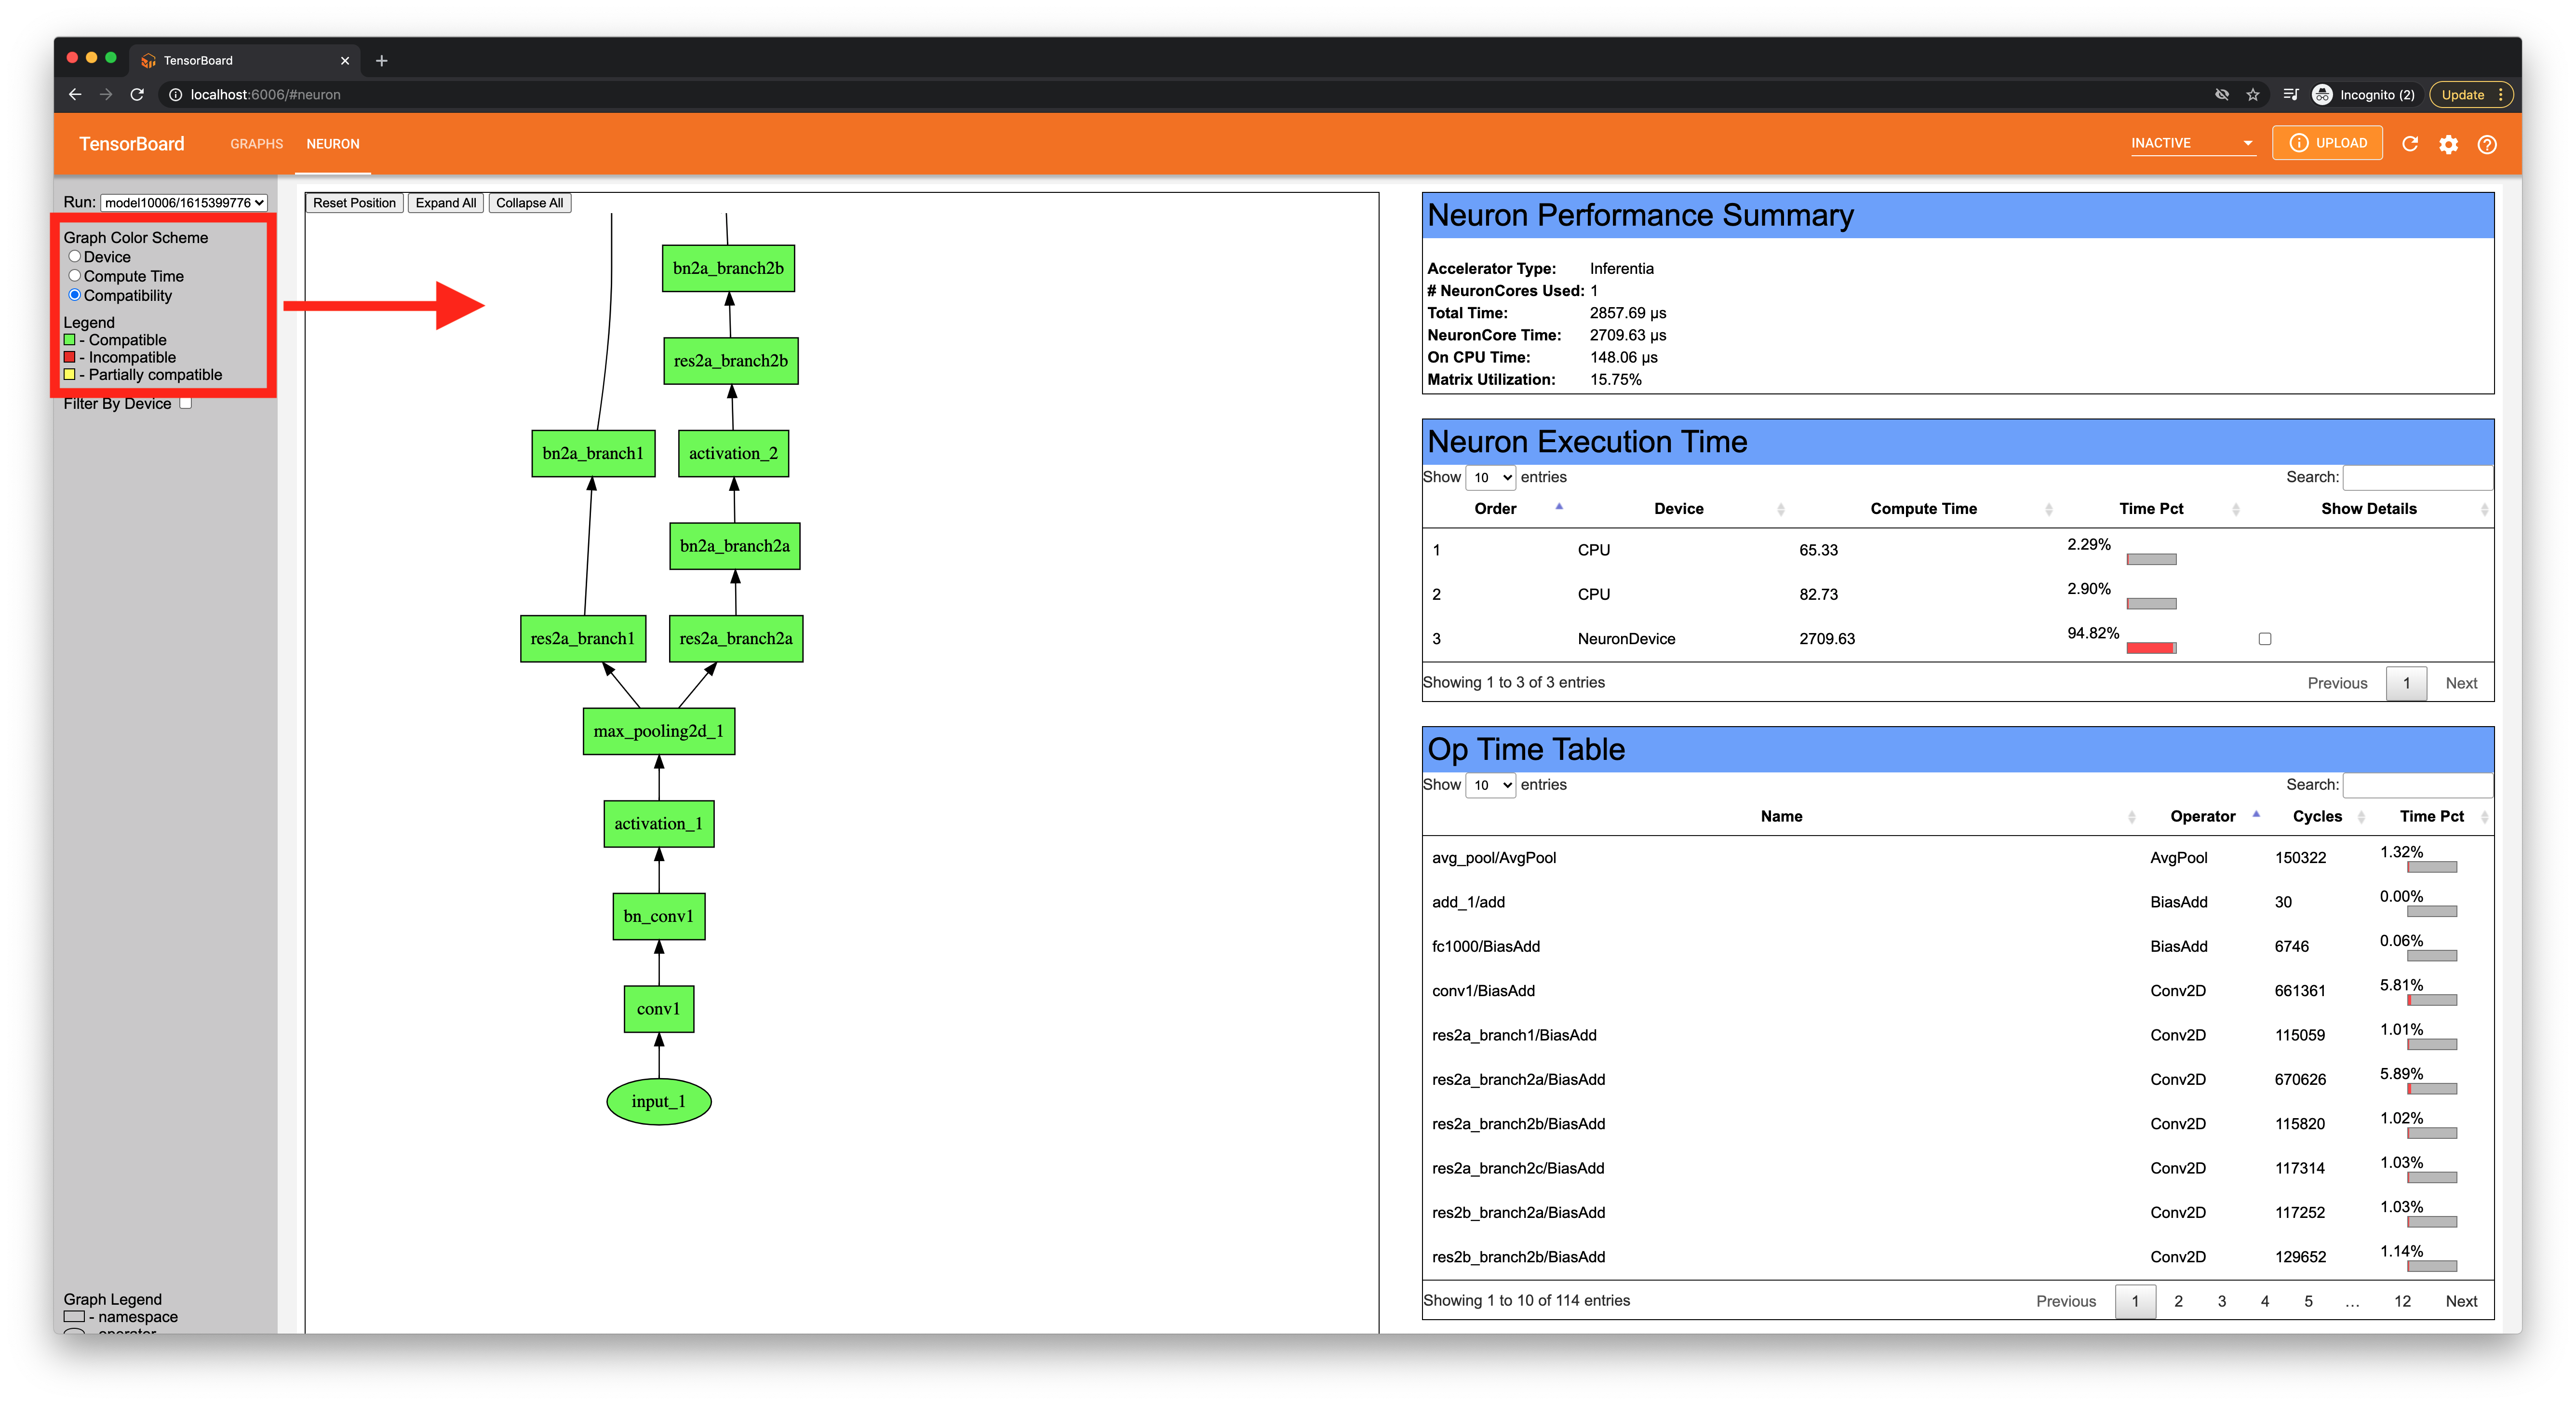
The “Compatibility” color scheme allows you to better understand what operators are currently supported by the Neuron compiler - green for compatible ops, red for incompatible ops, and yellow for subgraphs that contain both compatible and incompatible ops.
Filter view by device#
Additionally, you can choose to filter by CPU and NeuronCores, which will only color ops that match the selected device(s).
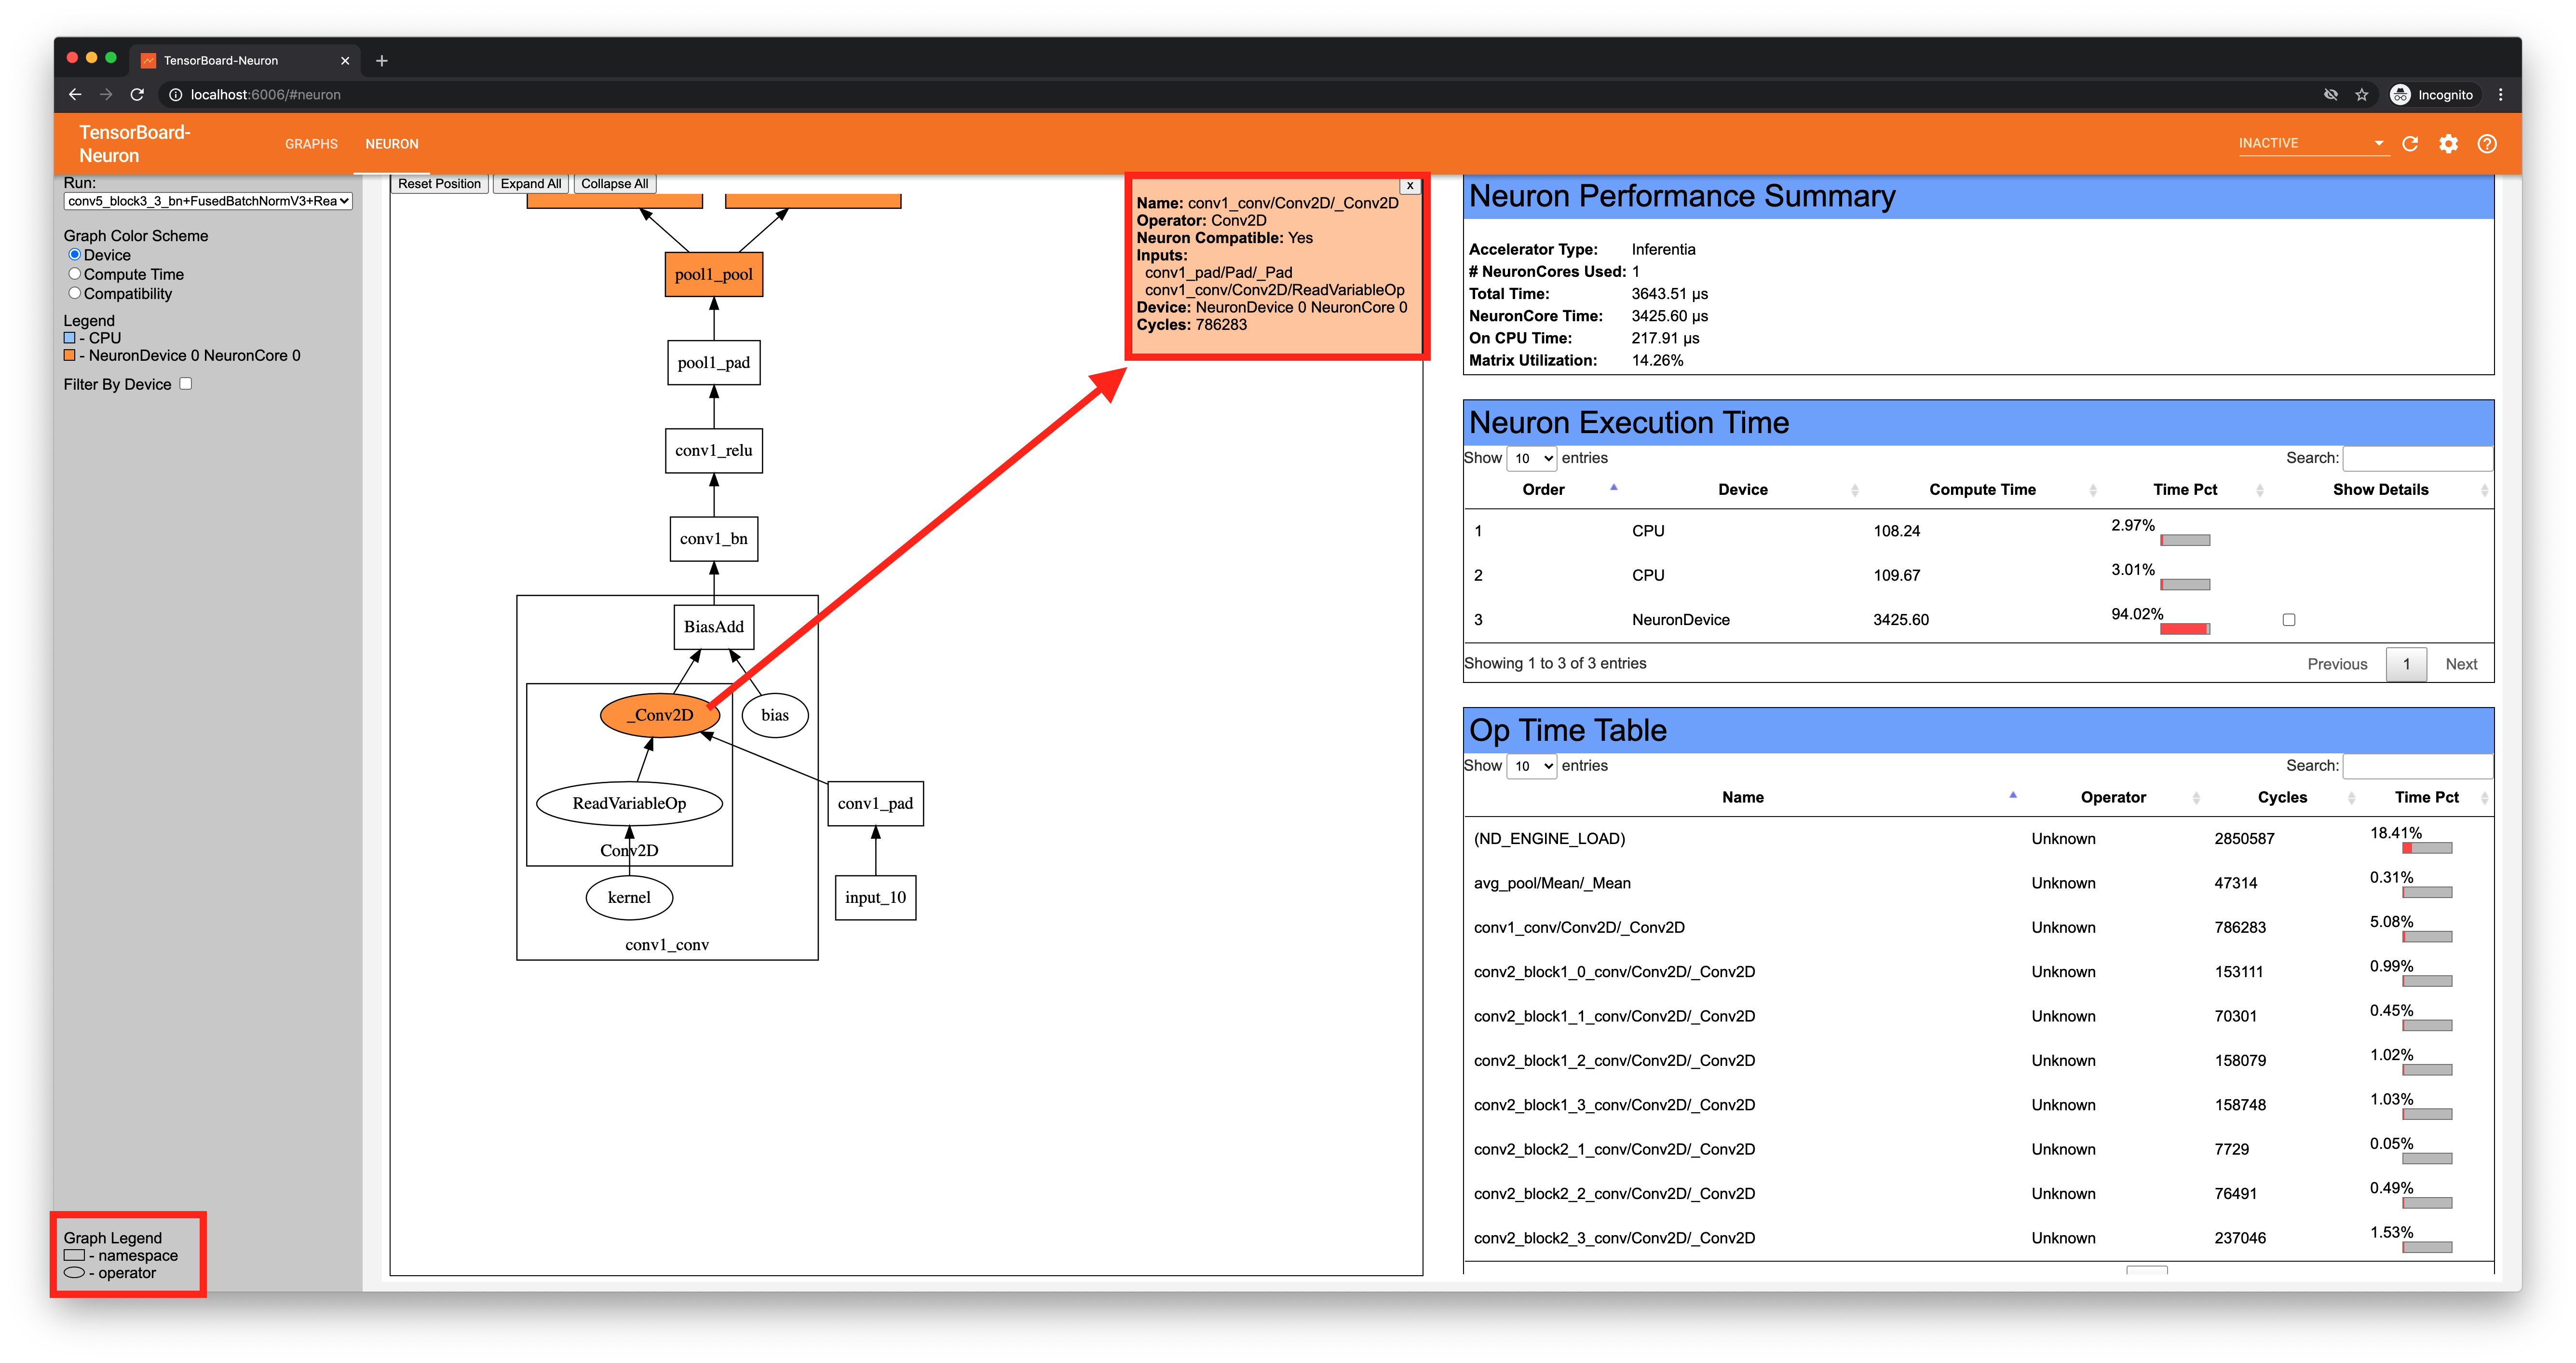
Expand/collapse subgraphs and view operator details#
Each rectangular node in the graph represents a subgraph that can be expanded or collapse by clicking on the name. Operators will be represented by ellipses, and can be clicked to reveal more information on that operator, such as inputs and execution device.
The Expand All and Collapse All buttons can be used to expand or collapse every subgraph.
When using these features, the positioning of the graph may change when redrawing the new graph.
Try using Reset Position button and zoom out by scrolling if the graph appears to be missing.
Viewing the Neuron profile data#
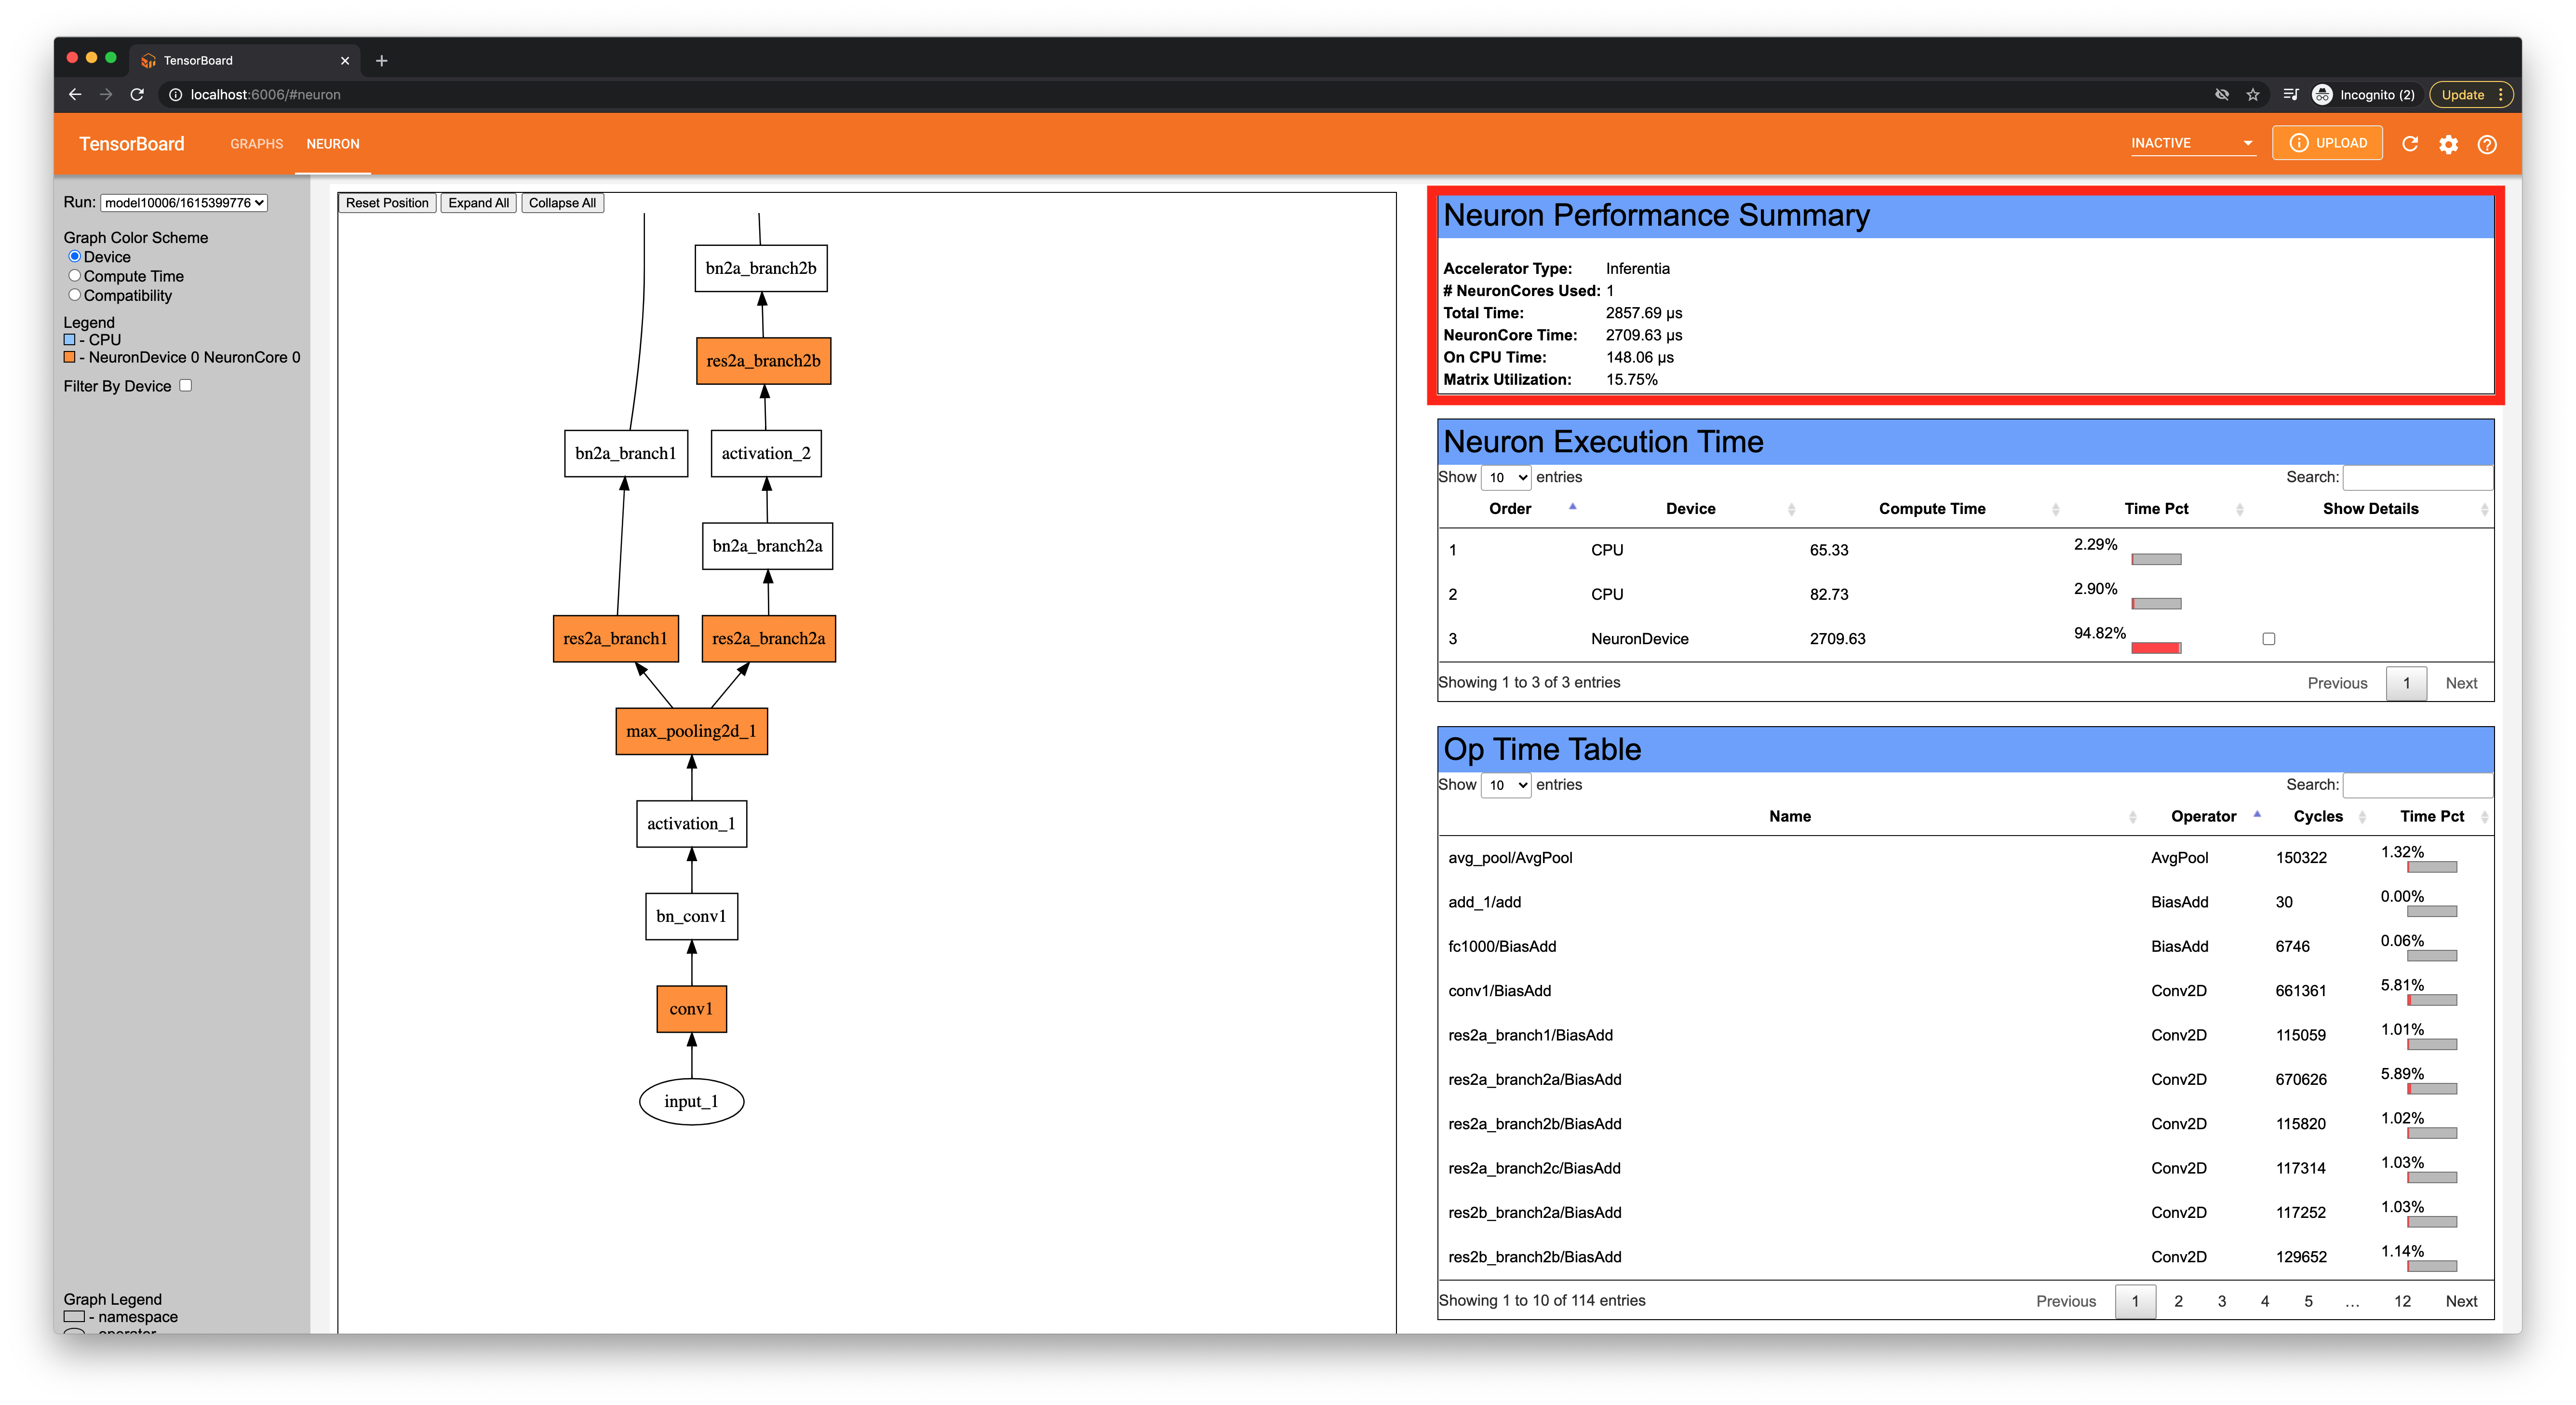
On the right side of the Neuron plugin, information on the profiled inference will be displayed.
See performance summary#
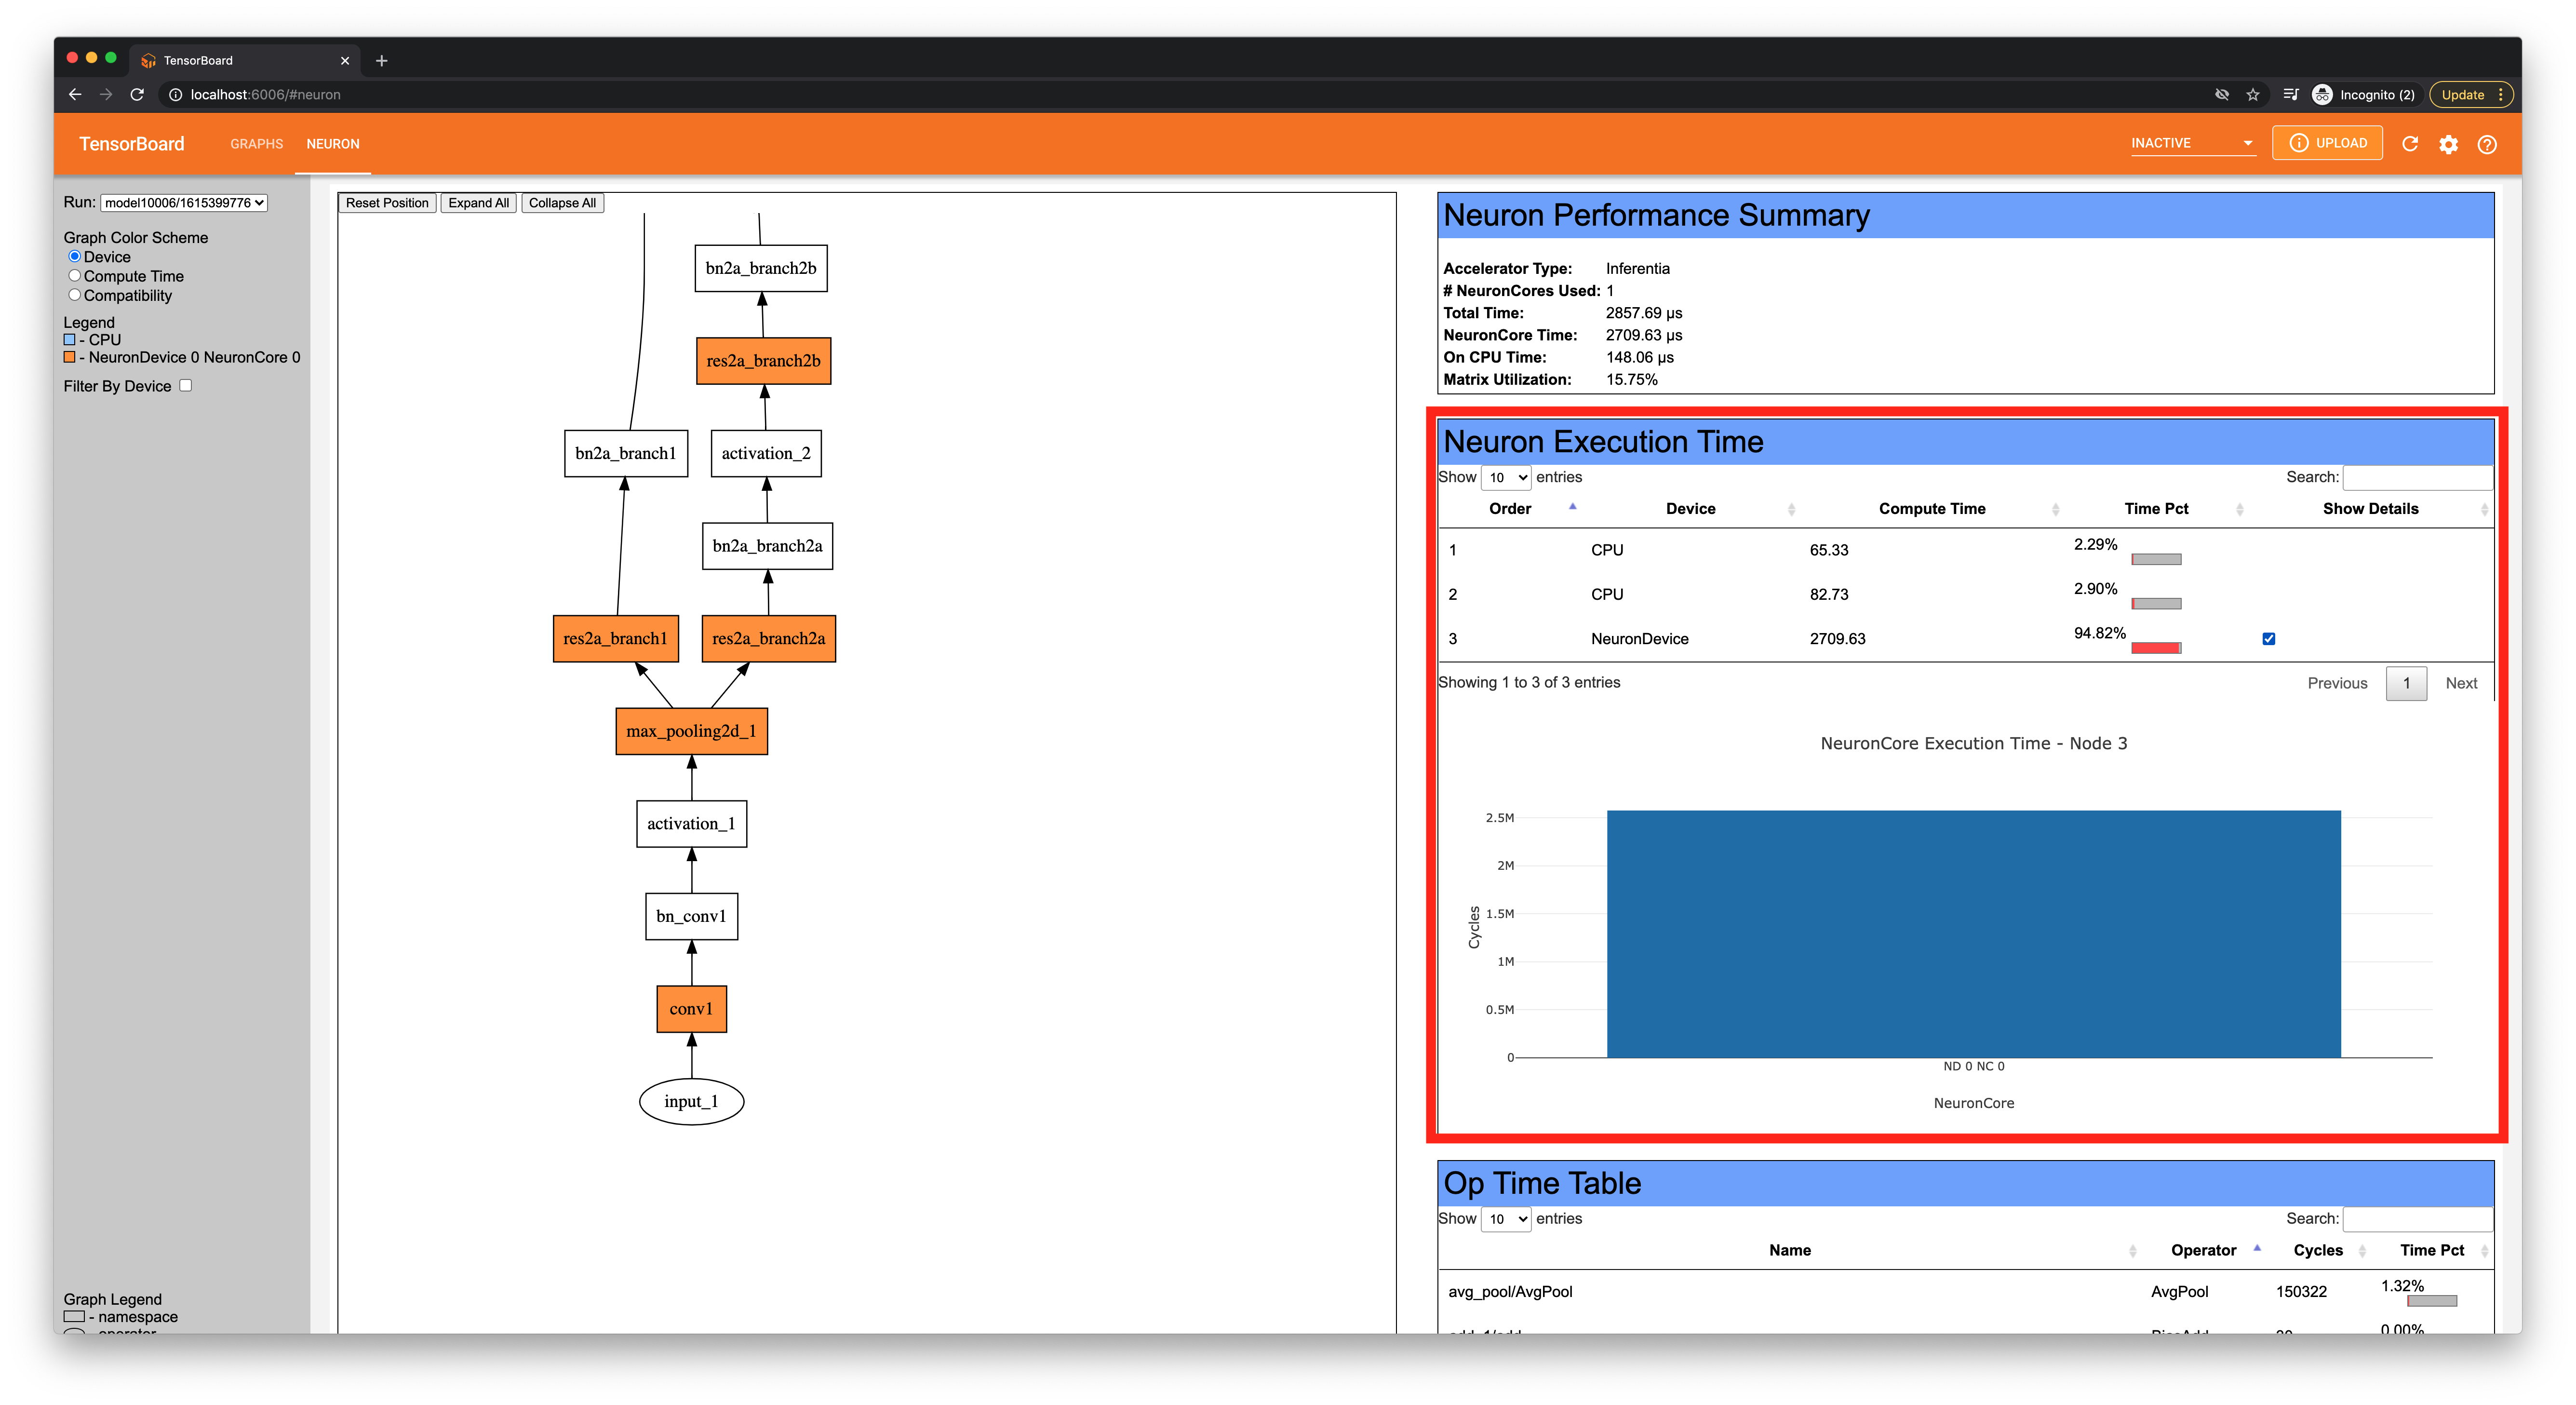
First is the “Neuron Performance Summary,” which gives a quick overview on how Neuron executed the graph, including information on the number of NeuronCores and both on-NeuronCore time and on-CPU time.
Get a breakdown of time spent per NeuronCore#
Next, the “Neuron Execution” will give more details on how a graph was partitioned for Neuron. Each entry in the table will show the order it was executed in, what type of device was used, the compute time (in microseconds), and the percentage of total time spent. To dive deeper into subgraphs, you can check the “Show Details” box to display the breakdown per NeuronCore.
Get a breakdown of time spent per operator#
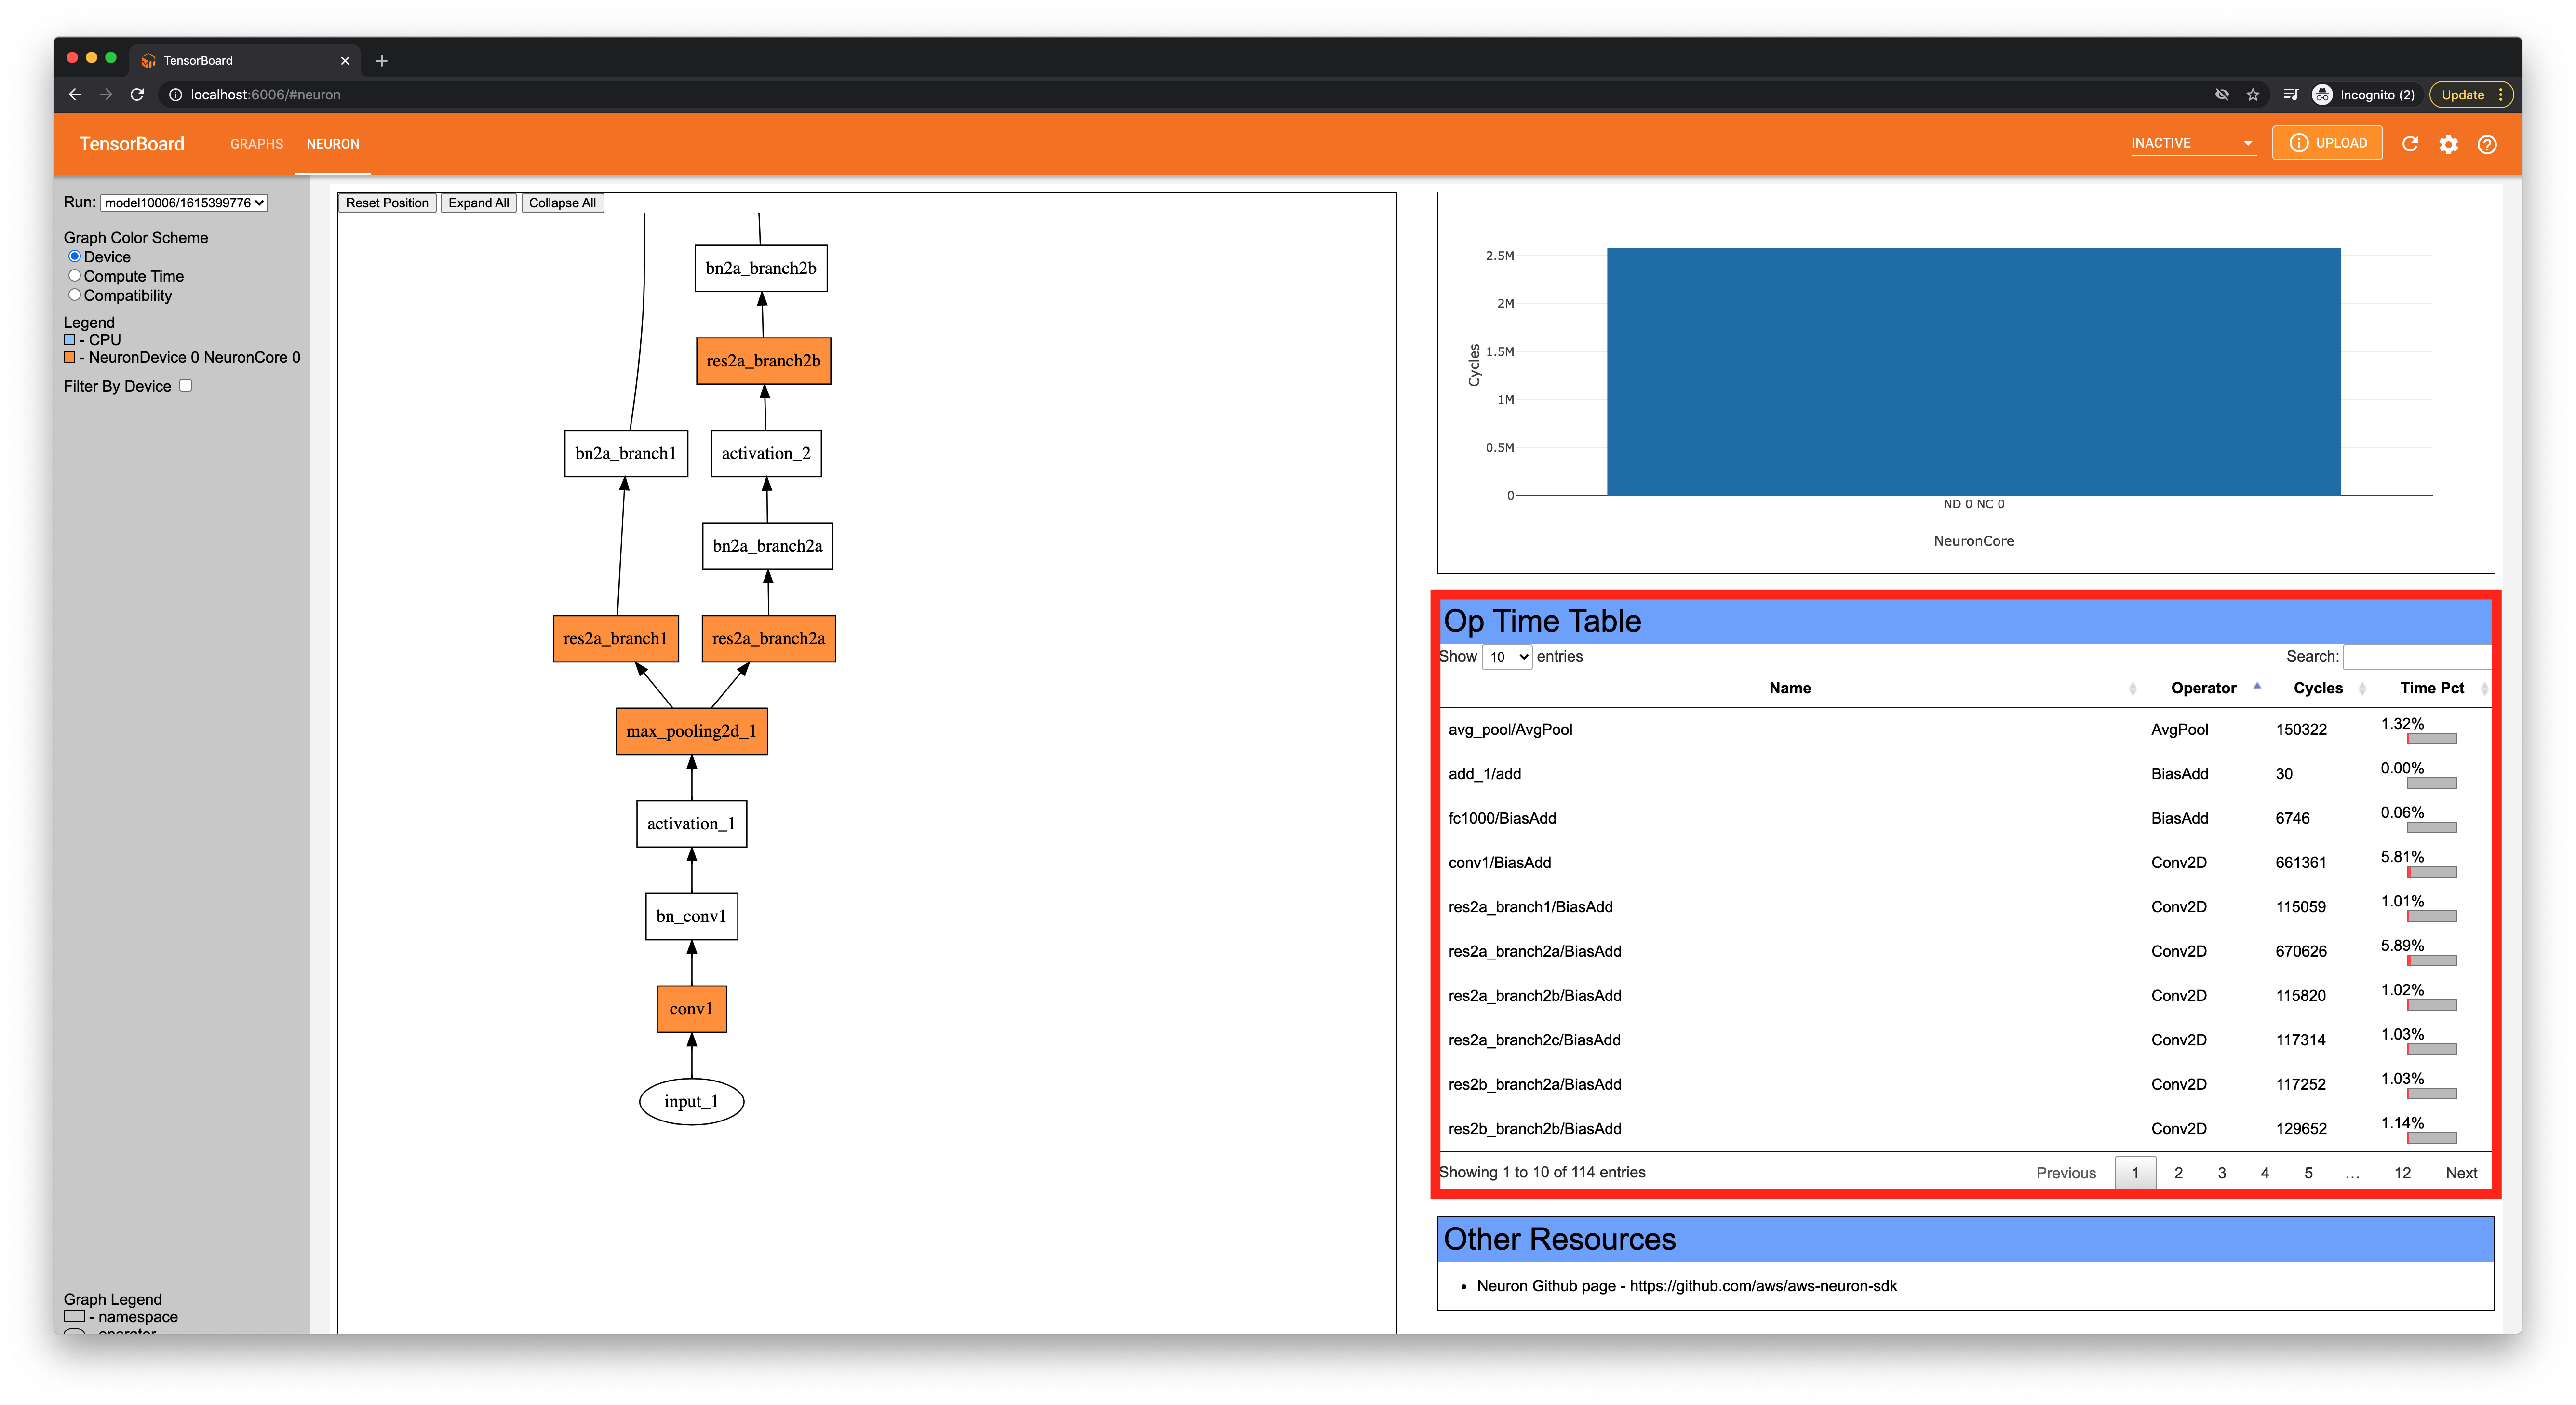
The “Op Time Table” section shows the cycle count per operator, much like the “Compute time” coloring
for graph visualization. This table can be sorted by clicking the column names, and searched using the
provided text box in the top right corner. Due to Neuron compiler optimizations, some of the compute may
not be associated with any specific operator and will be categorized as unknown. Additionally, time
spent moving data to and from NeuronCores will fall under (ND_ENGINE_LOAD).
This document is relevant for: Inf1