
This document is relevant for: Inf1, Inf2, Trn1, Trn2
Neuron Profiler 2.0 (Beta) User Guide#
Overview#
Neuron Profiler 2.0 offers a user-friendly experience for capturing and analyzing application performance through both high-level system profiles and detailed device-level profiles. Users can profile their workloads using framework-specific APIs within their application code or by setting an environment variable before execution. This tool supports profiling for both single-node and distributed workloads, integrating with environments such as ParallelCluster and EKS. Once captured, profile results can be explored through multiple interfaces: the Neuron Profiler UI, the open-source trace viewer Perfetto, or by exporting to a human-readable JSON format. This flexibility in data capture and visualization enables users to gain comprehensive insights into their application’s performance across various scenarios and scales.
Note
Neuron Profiler 2.0 is a set of new features currently in beta that enhance and simplify the experience of capturing and viewing profiles. It is not a replacement of Neuron Profiler, which is the existing feature set specifically for capturing and viewing device profiles.
Key benefits#
End-to-end timing of model execution and a Neuron Runtime API trace across all workers, helping identify scheduling gaps, synchronization, and host/runtime overheads.
No extra device memory usage by default, making system profiles ideal when device memory is limited or when only high-level insights are needed.
Option to capture device profiles for individual models during your workload.
Flexible capture and viewing: enable via environment variables or framework APIs; view in the Neuron Profiler UI, in Perfetto, or export as JSON.
Capturing profiles#
Neuron Profiler 2.0 offers several flexible options for capturing profiles. Users can either set an environment
variable NEURON_RT_INSPECT_ENABLE or use the PyTorch or JAX profiling APIs from their application code for
fine-grained control over which sections of their code are profiled. PyTorch and JAX users who prefer not to
modify their application code can still enable profiling by setting the environment variable before running
their application.
JAX User Experience#
JAX Setup#
Follow the JAX Setup instructions to install the required JAX Neuron Plugin and the latest Neuron Driver, Runtime and Tools packages.
JAX Profiler#
The JAX context-managed profiling API allows you to profile blocks of code. This will capture a system profile
including a Neuron Runtime API trace and Python trace for your application code in the captured block. This
will also capture device profiles for any compiled graphs (NEFFs) executed on NeuronCores within this block. To use
the profiler, import the jax package.
import jax
Profiling is enabled for all code enclosed in the context when using
with jax.profiler.trace(os.environ["NEURON_RT_INSPECT_OUTPUT_DIR"]):
Note
It is important to pass the output directory os.environ["NEURON_RT_INSPECT_OUTPUT_DIR"] to
with jax.profiler.trace and run export NEURON_RT_INSPECT_OUTPUT_DIR=<your output directory>
before enabling profiling. This ensures all captured profile data is saved to the correct output directory.
Custom Annotations in JAX#
To add custom annotations to blocks of code in your profile, you can use jax.profiler.TraceAnnotation.
Annotation names can be created at runtime, such as in the example here
using with jax.profiler.TraceAnnotation("my_label"+str(i)):. For more information on TraceAnnotations,
see the official JAX documentation.
JAX Profiling using environment variable#
Instead of using the jax.profiler context manager, you can enable profiling for your entire application using
an environment variable. This is desirable if you want to capture a profile without modifying your application
code. To enable profiling with the environment variable NEURON_RT_INSPECT_ENABLE=1 and
NEURON_RT_INSPECT_OUTPUT_DIR=./output before running your application.
For example:
# make sure to remove call to with jax.profiler.trace from python script
NEURON_RT_INSPECT_ENABLE=1 NEURON_RT_INSPECT_OUTPUT_DIR=./output python jax_script.py
When using the NEURON_RT_INSPECT_ENABLE environment variable instead of jax.profiler, system profiles
will not contain a framework and application code trace, only Neuron Runtime API trace.
Do not set the NEURON_RT_INSPECT_ENABLE environment variable and use the jax.profiler within your
application code at the same time. Use one or the other.
For more profiling options that can be set through environment variables, see the section Profile Capture Environment Variables.
Full JAX Example#
Create a file jax_script.py which performs repeated matrix multiplications distributed across Neuron devices.
from functools import partial
import os
import jax
import jax.numpy as jnp

from jax.sharding import Mesh, NamedSharding, PartitionSpec as P
from jax.experimental.shard_map import shard_map
from time import sleep

os.environ["XLA_FLAGS"] = "--xla_dump_hlo_snapshots --xla_dump_to=./dump"

jax.config.update("jax_default_prng_impl", "rbg")

mesh = Mesh(jax.devices(), ('i',))

def device_put(x, pspec):
    return jax.device_put(x, NamedSharding(mesh, pspec))

lhs_spec = P('i', None)
lhs = device_put(jax.random.normal(jax.random.key(0), (128, 128)), lhs_spec)

rhs_spec = P('i', None)
rhs = device_put(jax.random.normal(jax.random.key(1), (128, 16)), rhs_spec)

@jax.jit
@partial(shard_map, mesh=mesh, in_specs=(lhs_spec, rhs_spec), out_specs=rhs_spec)
def matmul_allgather(lhs_block, rhs_block):
    rhs = jax.lax.all_gather(rhs_block, 'i', tiled=True)
    return lhs_block @ rhs

with jax.profiler.trace(os.environ["NEURON_RT_INSPECT_OUTPUT_DIR"]):
    out = matmul_allgather(lhs, rhs)
    for i in range(10):
        with jax.profiler.TraceAnnotation("my_label"+str(i)):
            out = matmul_allgather(lhs, rhs)
        sleep(0.001)

expected = lhs @ rhs
with jax.default_device(jax.devices('cpu')[0]):
    equal = jnp.allclose(jax.device_get(out), jax.device_get(expected), atol=1e-3, rtol=1e-3)
    print("Tensors are the same") if equal else print("Tensors are different")
Set your profile output directory and run the script:
export NEURON_RT_INSPECT_OUTPUT_DIR=./output
python jax_script.py
PyTorch User Experience#
PyTorch Setup#
Follow the PyTorch Setup instructions to install the required PyTorch Neuron packages as well as the latest Neuron Driver, Runtime and Tools.
PyTorch Profiler#
The PyTorch context-managed profiling API allows you to profile blocks of code. This will capture a system profile including a Neuron Runtime API trace and Python trace for your application code in the captured block. This will also capture device profiles for any compiled graphs executed on NeuronCores within this block. To use the profiler, import it in your application:
from torch_neuronx.experimental import profiler
Then profile a block of code using:
with torch_neuronx.experimental.profiler.profile(
    port=9012,
    profile_type='system',
    target='neuron_profile_perfetto',
    output_dir=os.environ['NEURON_RT_INSPECT_OUTPUT_DIR'],
    ms_duration=30000) as profiler:
After modifying your code to call the profiler, run your application as you normally would
but set the environment variable NEURON_RT_INSPECT_OUTPUT_DIR to specify the output directory.
NEURON_RT_INSPECT_OUTPUT_DIR=./output python application.py
Note
it is essential to set output_dir=os.environ['NEURON_RT_INSPECT_OUTPUT_DIR'] when starting the profiler from your application code.
This ensures that all profile data sources dump to the same output directory.
PyTorch Profiling using Environment Variable#
Instead of using the torch_neuronx.experimental.profiler.profile context manager, you can enable profiling
for your entire application using environment variable. This is desirable if you want to capture a profile without modifying your application code. To enable profiling
with environment variable NEURON_RT_INSPECT_ENABLE=1 and NEURON_RT_INSPECT_OUTPUT_DIR=./output before running your application.
For example
# make sure to remove call to with torch_neuronx.experimental.profiler.profile from python script
NEURON_RT_INSPECT_ENABLE=1 NEURON_RT_INSPECT_OUTPUT_DIR=./output python pytorch_script.py
When using the NEURON_RT_INSPECT_ENABLE environment variable instead of torch_neuronx.experimental.profiler.profile system profiles will not contain a framework and application code trace, only Neuron Runtime API trace.
Do not set the NEURON_RT_INSPECT_ENABLE environment variable and use the torch_neuronx.experimental.profiler.profile within your application code at the same time. Use one or the other.
For more profiling options that can be set through environment variables, see the section Profile Capture Environment Variables.
Full PyTorch Example#
Create a file train_torchrun_context.py with the following contents
import os

import torch
import torch.nn as nn
import torch.nn.functional as F

# XLA imports
import torch_xla
import torch_xla.core.xla_model as xm
import torch_xla.debug.profiler as xp

import torch_neuronx
from torch_neuronx.experimental import profiler

os.environ["NEURON_CC_FLAGS"] = "--cache_dir=./compiler_cache"

# Global constants
EPOCHS = 2

# Declare 3-layer MLP Model
class MLP(nn.Module):
    def __init__(self, input_size=10, output_size=2, layers=[5, 5]):
        super(MLP, self).__init__()
        self.fc1 = nn.Linear(input_size, layers[0])
        self.fc2 = nn.Linear(layers[0], layers[1])
        self.fc3 = nn.Linear(layers[1], output_size)

    def forward(self, x):
        x = F.relu(self.fc1(x))
        x = F.relu(self.fc2(x))
        x = self.fc3(x)
        return F.log_softmax(x, dim=1)

def main():
    # Fix the random number generator seeds for reproducibility
    torch.manual_seed(0)

    # XLA: Specify XLA device (defaults to a NeuronCore on Trn1 instance)
    device = xm.xla_device()

    # Start the profiler context-manager
    with torch_neuronx.experimental.profiler.profile(
        port=9012,
        profile_type='system',
        target='neuron_profile_perfetto',
        output_dir=os.environ['NEURON_RT_INSPECT_OUTPUT_DIR'],
        ms_duration=30000) as profiler:

        # IMPORTANT: the model has to be transferred to XLA within
        # the context manager, otherwise profiling won't work
        model = MLP().to(device)
        optimizer = torch.optim.SGD(model.parameters(), lr=0.01)
        loss_fn = torch.nn.NLLLoss()

        # start training loop
        print('----------Training ---------------')
        model.train()
        for epoch in range(EPOCHS):
            optimizer.zero_grad()
            train_x = torch.randn(1, 10).to(device)
            train_label = torch.tensor([1]).to(device)

            # forward
            loss = loss_fn(model(train_x), train_label)

            # back
            loss.backward()
            optimizer.step()

            # XLA: collect ops and run them in XLA runtime
            xm.mark_step()

    print('----------End Training ---------------')

if __name__ == '__main__':
    main()
Run this workload with the following command:
NEURON_RT_INSPECT_OUTPUT_DIR="output" python simple_demo.py
Non-framework Specific User Experience#
You can also control profiling with environment variables. This is useful when you can’t easily change your application code, such as when running an executable which calls the Neuron Runtime or in a containerized environment where the application code is built into the container image.
Profile Capture Environment Variables#
Core control variables#
Variable |
Description |
Default behavior |
|---|---|---|
|
Set to |
Enables system profiling and disables device profiling. To control which profile types are captured, see Profile stype selection |
|
Directory for profile data output |
Default directory for captured profile data is |
Profile type selection#
Note
When NEURON_RT_INSPECT_ENABLE set to 1, NEURON_RT_INSPECT_SYSTEM_PROFILE is enabled by default (set to 1) and NEURON_RT_INSPECT_DEVICE_PROFILE is disabled by default (set to 0).
When ``NEURON_RT_INSPECT_ENABLE` = 1, two different profile types are available:
Variable |
Profile type |
Description |
Enable capture |
Disable capture |
|---|---|---|---|---|
|
System-level |
Captures runtime system events and operations |
Set to |
Set to |
|
Device-level |
Captures detailed NeuronCore hardware metrics |
Set to |
Set to |
Note
These variables have no effect if NEURON_RT_INSPECT_ENABLE is not set to 1.
Advanced configuration#
Variable |
Profile type |
Description |
Default behavior |
|---|---|---|---|
|
System-level |
Maximum trace events per NeuronCore before oldest events are overwritten |
1,000,000 |
Note
Increasing the event limit will consume more host memory.
Example Capturing Profile of Application Using Environment Variables#
Instead of using the PyTorch or JAX profilers you can profile your Python application (or any application calling the Neuron Runtime API) using environment variables.
NEURON_RT_INSPECT_ENABLE=1 NEURON_RT_INSPECT_OUTPUT_DIR=./output python app.py
See Profile Capture Environment Variables for other profiling options that can be set via environment variable.
Example Capturing Profile of nccom-test Using Environment Variables#
Profiling can be enabled using environment variables. For simplicity, we have a quick way to generate a Neuron workload through using nccom-test. nccom-test is a benchmarking tool which is already available with Neuron AMI.
export NEURON_RT_INSPECT_ENABLE=1
export NEURON_RT_INSPECT_OUTPUT_DIR=./output
nccom-test allr allg -b 512kb -e 512kb -r 32 -n 10 -d fp32 -w 1 -f 512
Note
If you have problems with nccom-test add the –debug flag. If using a trn1.2xlarge instance, change -r 32 to -r 2 to use fewer neuron cores.
To understand the profiling output see this section: Inspect Output
CLI reference for System Profiles#
In addition to controlling profiling with environment variables, you can use the neuron-profile inspect command line interface
for profiling applications. This provides the same functionality as environment variables but helps you avoid typos, invalid arguments,
and provides a useful --help command to explain available options.
Usage:
neuron-profile [OPTIONS] inspect [inspect-OPTIONS] [userscript...]

Application Options:
-v, --version                      Show version and exit

Help Options:
-h, --help                         Show this help message

[inspect command options]
    -o, --output-dir=              Output directory for the captured profile data, including system and device profiles (default: ./output)
    -n, --num-trace-events=        Maximum number of trace events to capture when profiling. Once hitting this limit, no new events are recorded
        --capture-system-profiles  Disable capture of system profile data. Can reduce output size.
        --capture-device-profiles  Disable capture of device profile data. Can reduce output size.

[inspect command arguments]
userscript:                        Run command/script that launches a Neuron workload. E.g. 'python app.py' or './runscript.sh'
Example of using System Profiles CLI#
User can provide any type of their own script to generate a Neuron workload such as Pytorch to the System Profiles CLI.
For simplicity, we have a quick way to generate a Neuron workload
through using nccom-test. nccom-test is a benchmarking tool which is already available with Neuron AMI and aws-neuronx-tools package.
ubuntu@ip-172-31-63-210:~$ neuron-profile inspect -o inspect-output-nccom-test nccom-test allg -b 512kb -e 512kb -r 32 -n 10 -d fp32 -w 1 -f 512
INFO[0000] Running command "nccom-test allg -b 512kb -e 512kb -r 32 -n 10 -d fp32 -w 1 -f 512" with profiling enabled
    size(B)    count(elems)    type    time:avg(us)    algbw(GB/s)    busbw(GB/s)
    524288          131072    fp32           24.15          21.71          21.03
Avg bus bandwidth:    21.0339GB/s
Note
If you have problems with nccom-test add the –debug flag. If using a trn1.2xlarge instance, change -r 32 to -r 2 to use fewer neuron cores.
neuron-profile inspect Output#
The above command shows a Neuron workload execution is being traced and output to inspect-output-nccom-test directory.
You will see the output directory contains a single NEFF file and a device profile (NTFF) for all Neuron Cores which executed that NEFF.
You will also see ntrace.pb and trace_info.pb files storing the system profile data.
Below showing what the outputs will look like:
ubuntu@ip-172-31-63-210:~$ tree inspect-output-nccom-test
inspect-output-nccom-test
    ├── i-012590440bb9fd263_pid_98399
    │   ├── 14382885777943380728_instid_0_vnc_0.ntff
    │   ├── 14382885777943380728_instid_0_vnc_1.ntff
    │   ├── 14382885777943380728_instid_0_vnc_10.ntff
    │   ├── 14382885777943380728_instid_0_vnc_11.ntff
    ...
    │   ├── 14382885777943380728_instid_0_vnc_8.ntff
    │   ├── 14382885777943380728_instid_0_vnc_9.ntff
    │   ├── cpu_util.pb
    │   ├── host_mem.pb
    │   ├── neff_14382885777943380728.neff
    │   ├── ntrace.pb
    │   └── trace_info.pb
    └──

2 directories, 74 files
To view a summary of the captured profile data run the command
neuron-profile view -d inspect-output-nccom-test --output-format summary-text
EKS User Experience#
Capturing a profile on EKS is most easily done through setting of environment variables as described in the section Non-framework specific User Experience. By using environment variables, users do not need to change application code in their container image or modify their run commands.
Update the deployment yaml to include the NEURON_RT_INSPECT_ENABLE and NEURON_RT_INSPECT_OUTPUT_DIR
environment variables. For distributed workloads, it’s important that NEURON_RT_INSPECT_OUTPUT_DIR points to a
directory on a shared volume which all workers have access to.
apiVersion: v1
kind: Pod
metadata:
name: trn1-mlp
spec:
restartPolicy: Never
schedulerName: default-scheduler
nodeSelector:
    beta.kubernetes.io/instance-type: trn1.32xlarge
containers:
    - name: trn1-mlp
    env:
        - name: NEURON_RT_INSPECT_ENABLE
        value: "1"
        - name: NEURON_RT_INSPECT_OUTPUT_DIR
        value: "/shared/output"
    command: ['torchrun']
    args:
        - '--nnodes=1'
        - '--nproc_per_node=32'
        - 'train_torchrun.py'
    image: ${ACCOUNT_ID}.dkr.ecr.${REGION}.amazonaws.com/${REPO}:mlp
    imagePullPolicy: IfNotPresent
    resources:
        limits:
        aws.amazon.com/neuron: 16
Note
EKS users running PyTorch and JAX applications are still free to change their application code and use the PyTorch or JAX Python profiling APIs if they want finer-grained control over profiling. However, using the environment variables conveniently allows profiling without modifying the container image or application code.
Processing and Viewing Profiles#
Users have three output options for interacting with their captured profiles
Neuron Profiler UI - Neuron’s custom UI which allows easily drilling down to detailed device profiles from high level system profiles
Perfetto - Allows sharing profiles as a single file and viewing your profiles in the Perfetto UI at https://ui.perfetto.dev/
JSON - human-readable text output that enables simple scripting
Neuron Profiler UI#
To view a profile in the Neuron Profiler UI run the following command to process a profile and launch the UI
neuron-profile view -d ./output
To view profiles with the Neuron Profiler UI running locally you will need to have InfluxDB installed on your system. To install and setup InfluxDB follow the directions in the official Neuron Profile documentation.
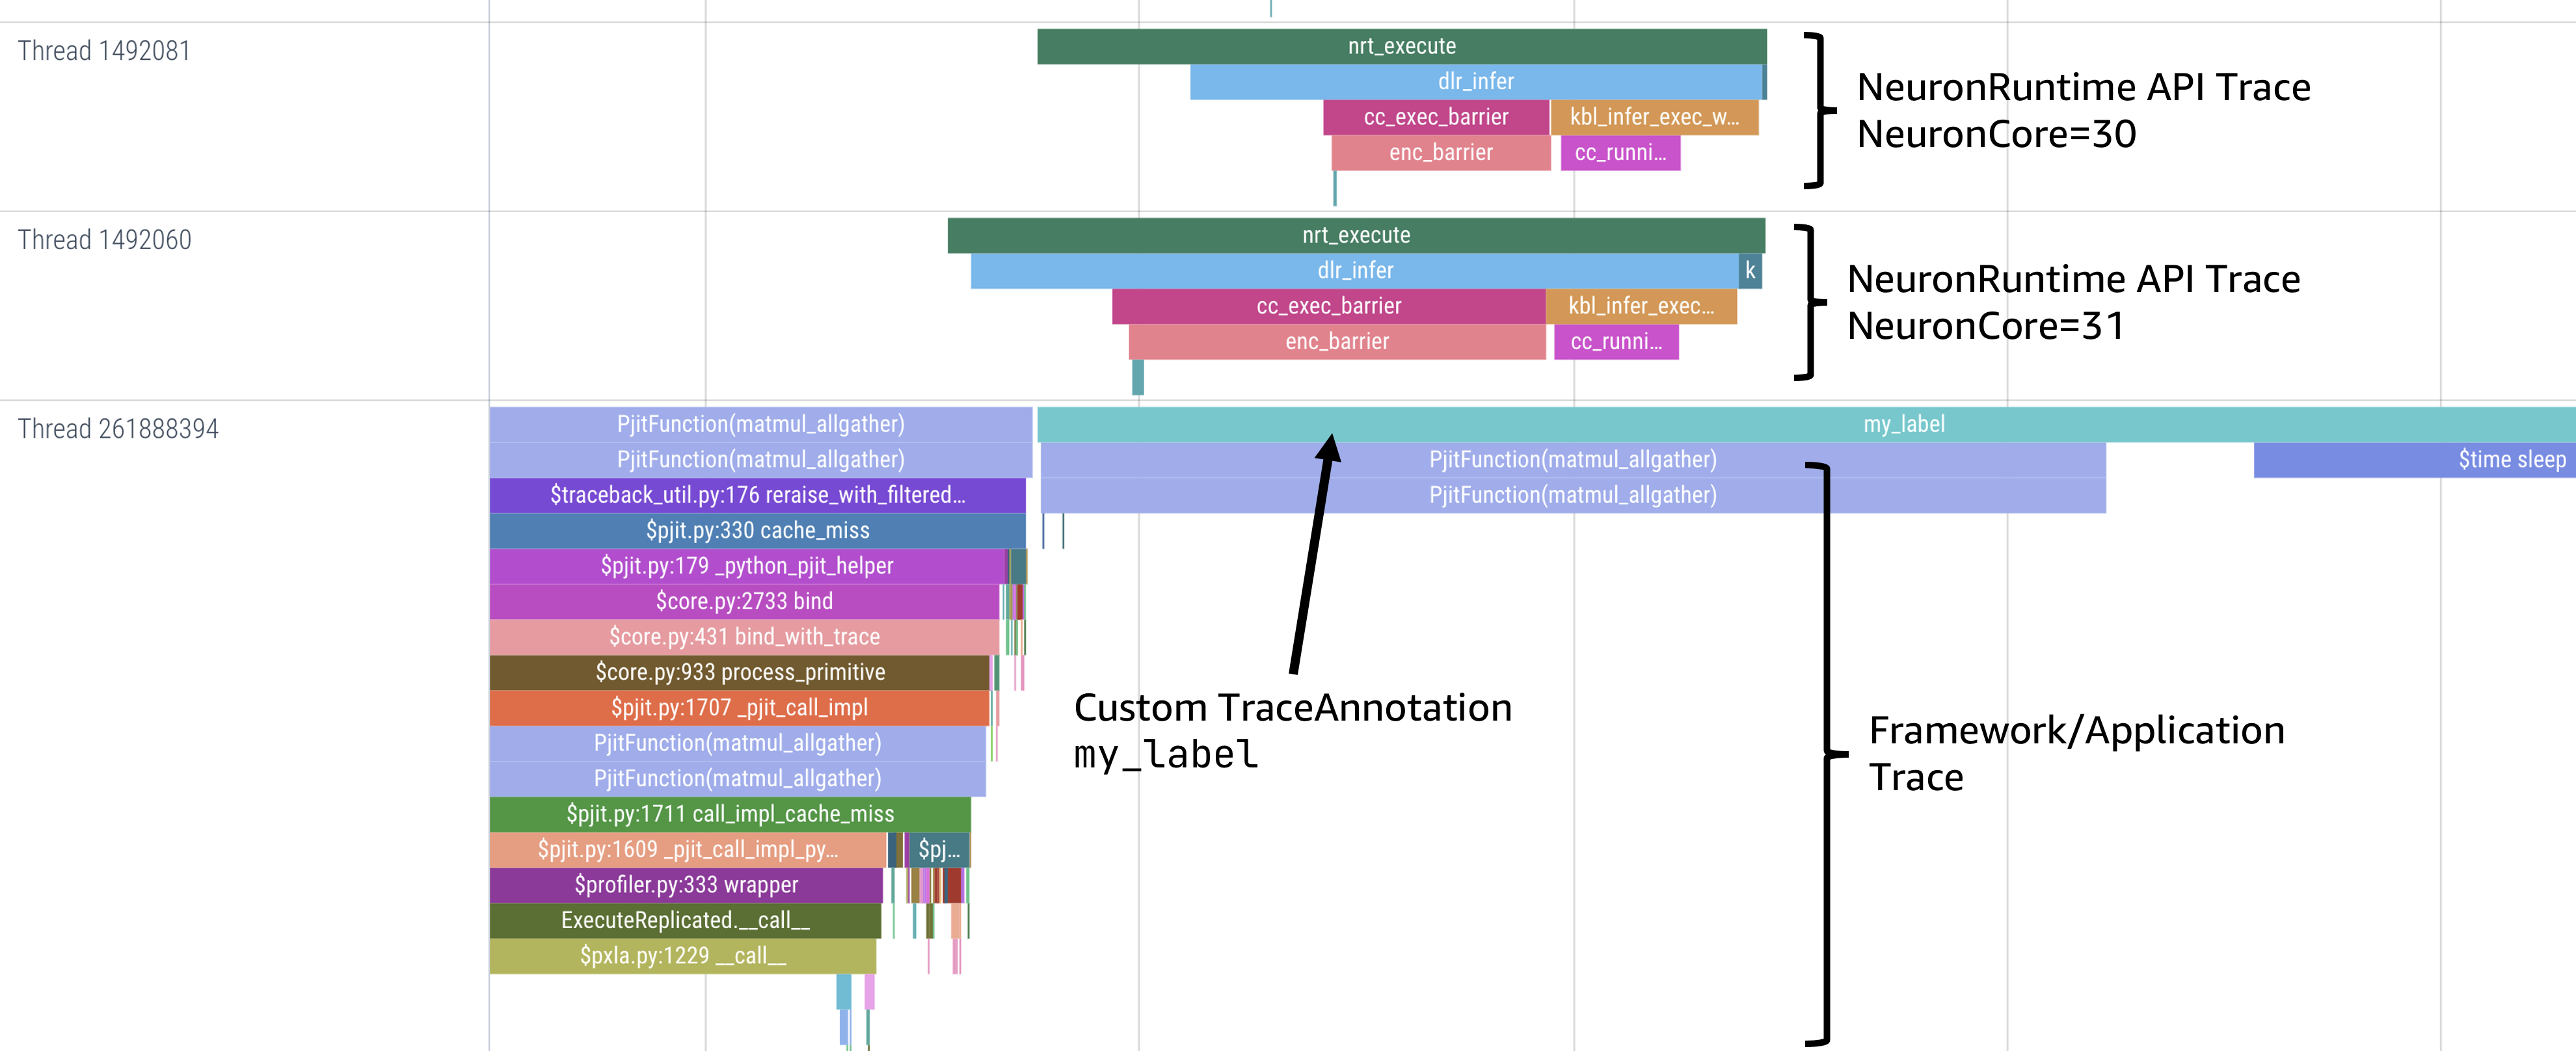
Neuron Profiler System Profile UI#
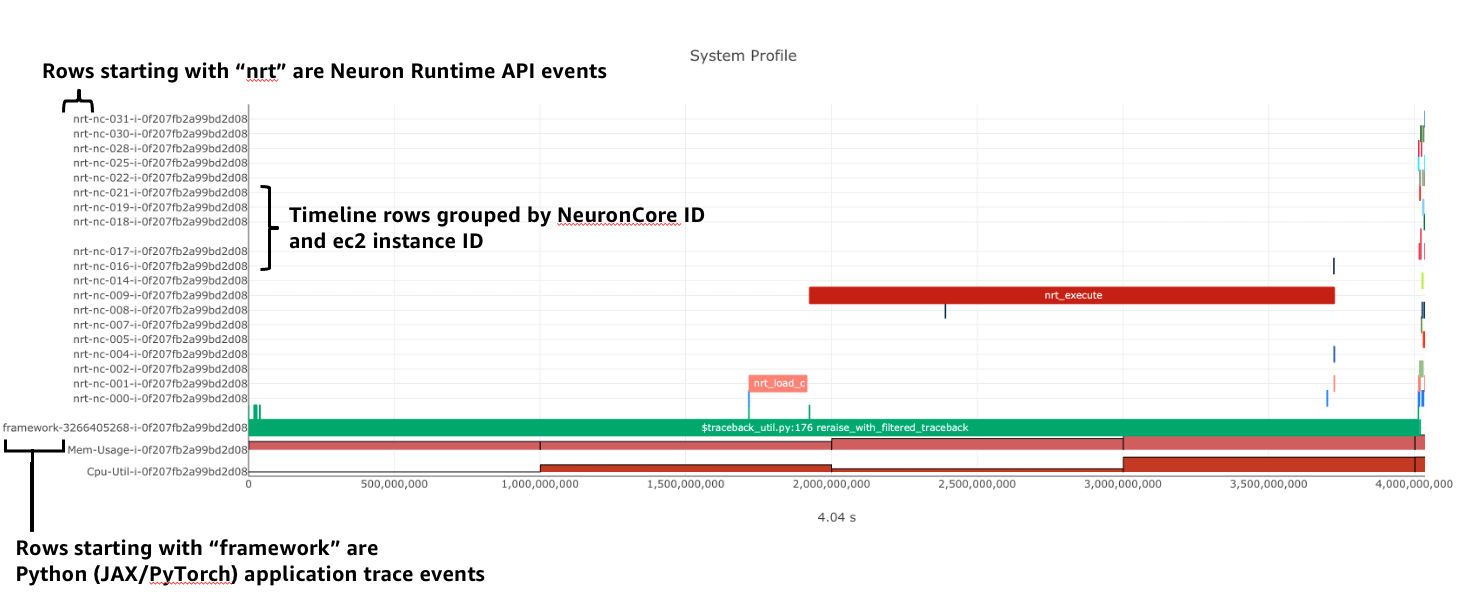
The system profile timeline shows a trace of Neuron Runtime API calls, ML framework function calls, CPU utilization, and memory usage on each of the instances in your workload. The Neuron Runtime API trace is grouped by NeuronCore IDX and ec2 instance ID. For example, all events in the row labeled nrt-nc-003-i-0f207fb2a99bd2d08 are associated with NeuronCore 3 and instance i-0f207fb2a99bd2d08.
Framework function traces are grouped by thread id and ec2 instance id. For example, all events in the row framework-3266405268-i-0f207fb2a99bd2d08 are framework or application function calls made on thread 3266405268 running on instance i-0f207fb2a99bd2d08.
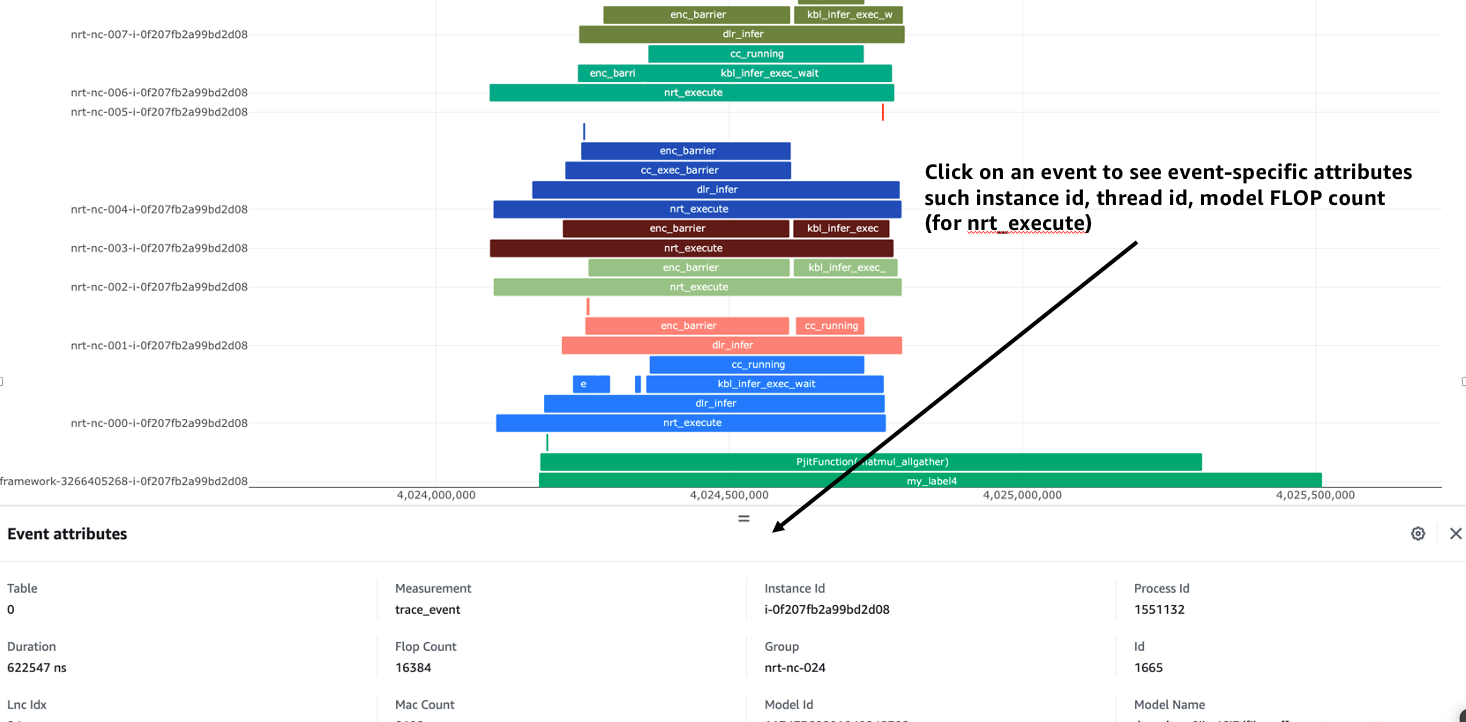
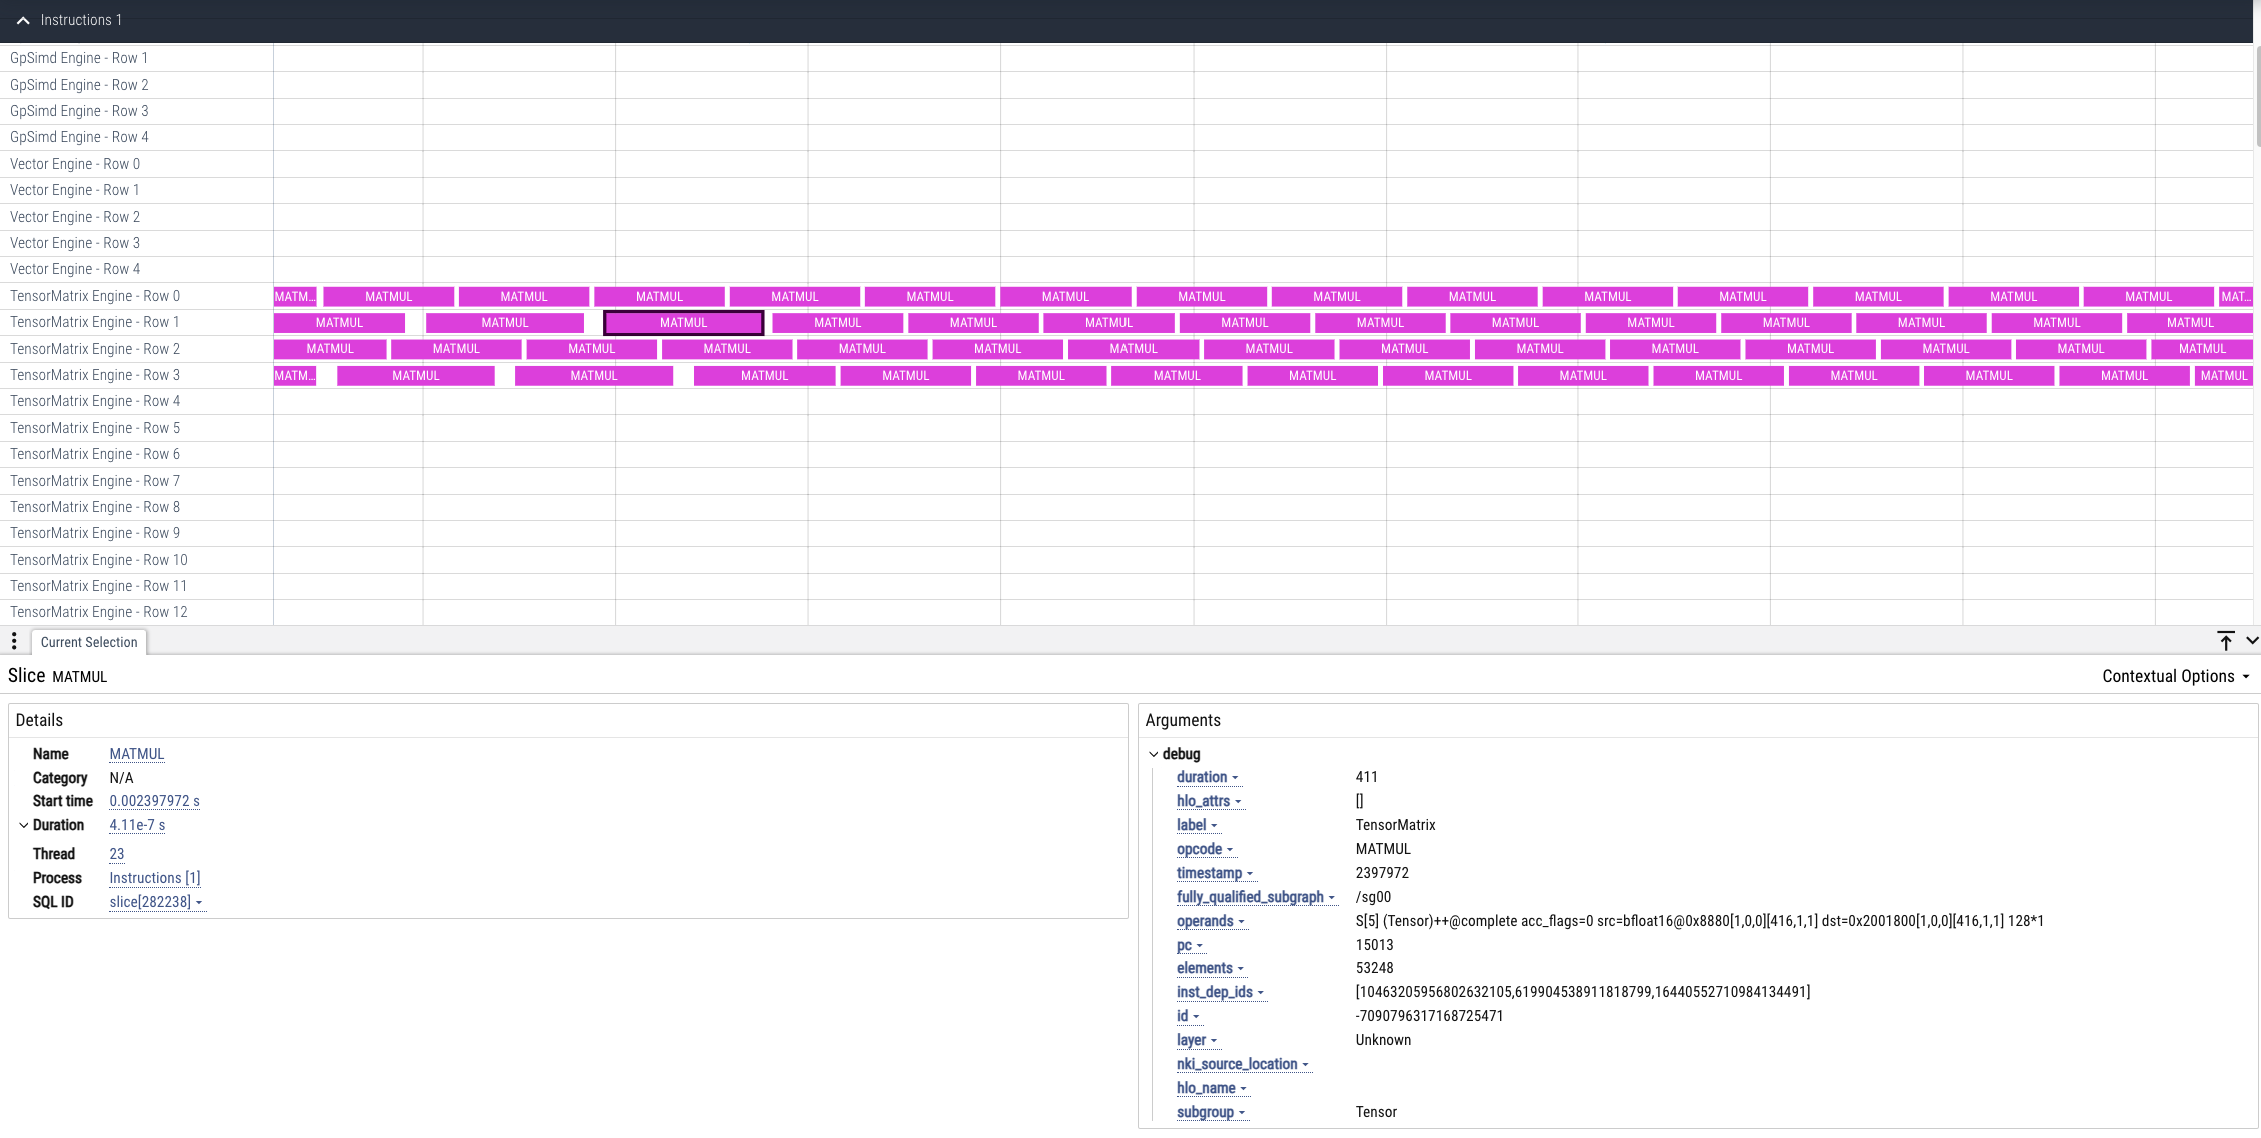
Clicking on trace events in the timeline shows a “Event attributes” view with a list of attributes associated with that event. For example, clicking on an nrt_execute event (the Neuron Runtime API call for executing a compiled model on a NeuronCore) will show events such as Flop count (the number of floating point operations for a single execution of the model), the model name, and the NeuronCore idx and ec2 instance id associated with the function call.
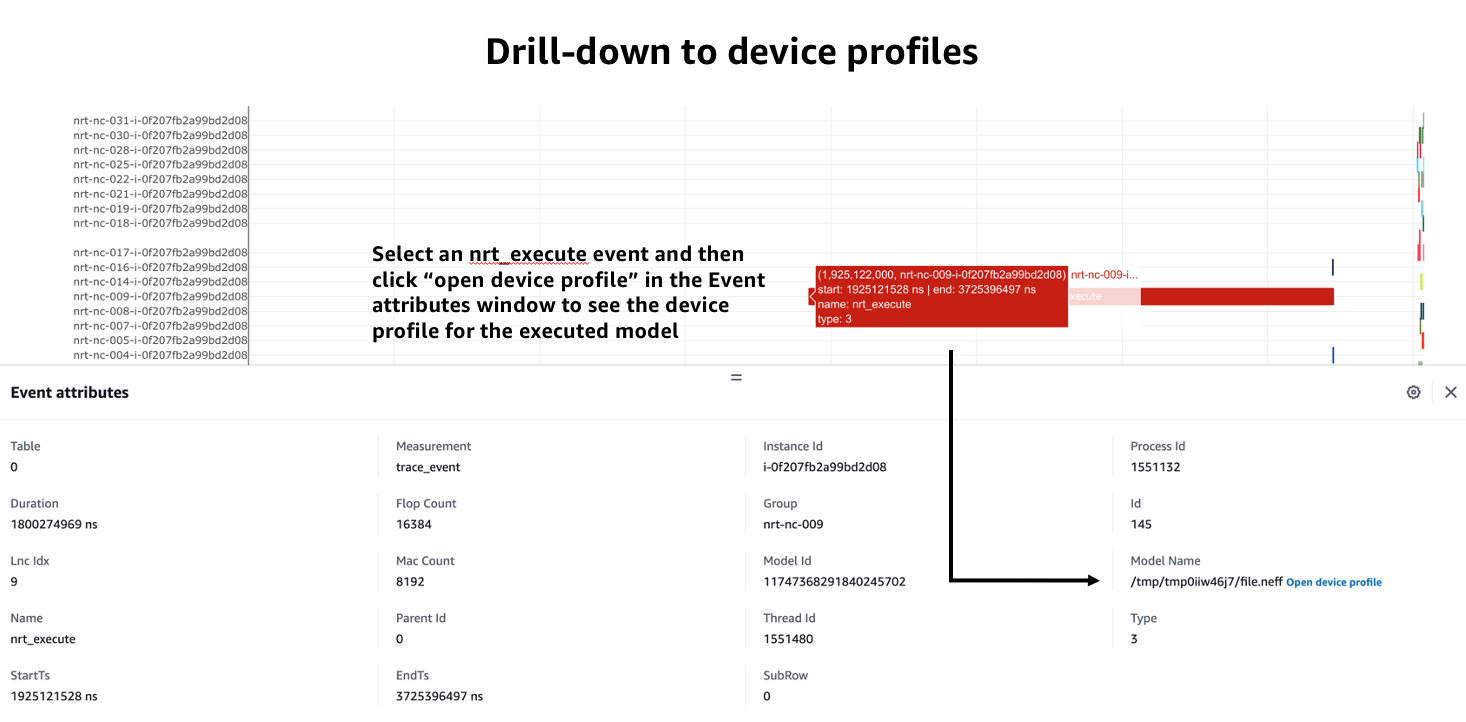
Neuron Profiler 2.0 allows users to drill-down from a system timeline to a device profile timeline in order to see a detailed view of hardware activity during the execution of a graph. To do this, select an nrt_execute event in the timeline and in the “Event attributes” view select the “Open device profile” button under the Model Name attribute. This will open a new window with a device profile. For help understanding a device profile see the section documentation section “Understanding a Neuron Profile”
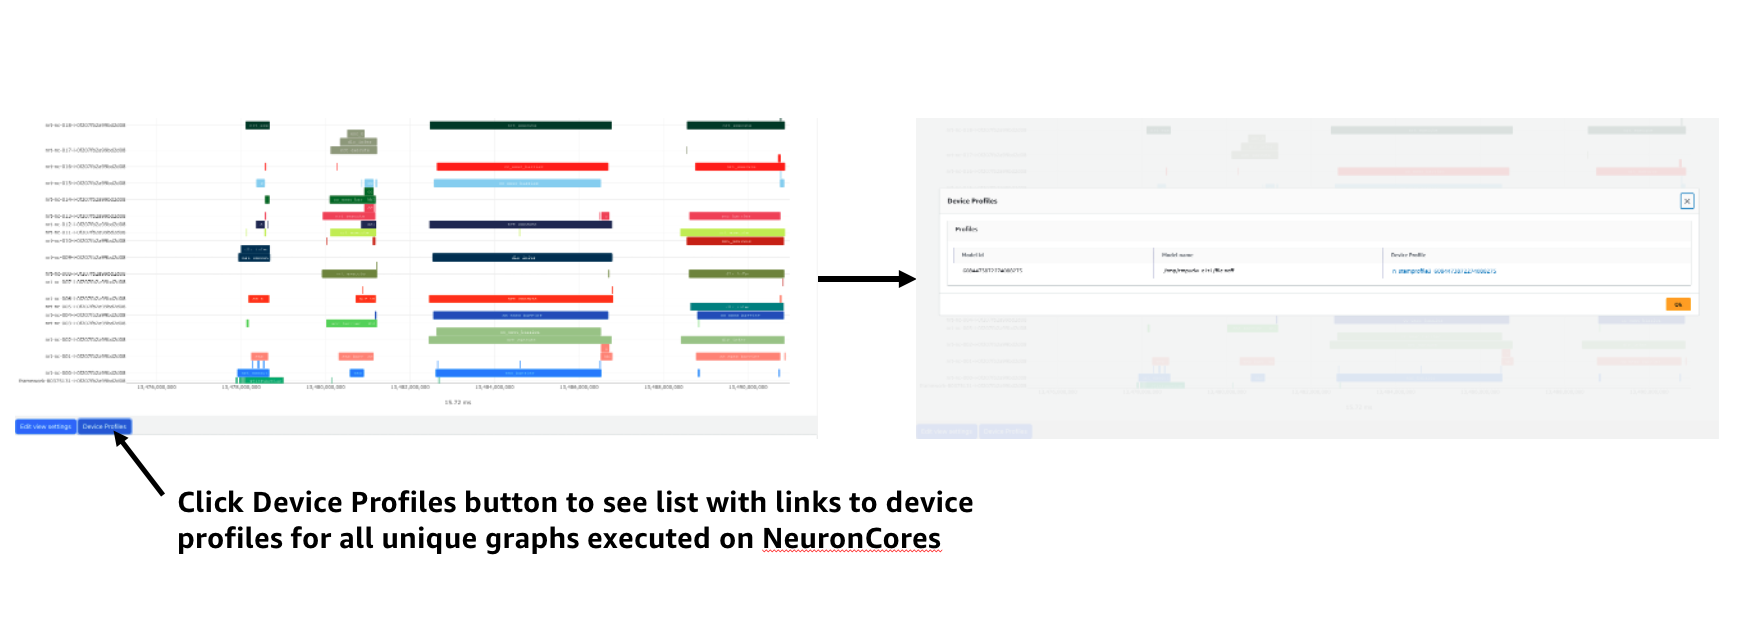
To see a list of all device profiles that were captured during your workload press the “Device Profiles” button at the bottom of the timeline. From this list you can see all unique compiled graphs (NEFFs) that were executed on NeuronCores during your workload. For each graph there is a link to a device profile that will show a detailed view of hardware activity on the NeuronCore during execution of this graph.
Viewing Profiles with Perfetto#
Perfetto is an open-source trace analysis toolkit with a powerful UI for visualizing and analyzing trace data. Users of Neuron Profiler have the option of viewing their profiles in the Perfetto UI.
The --output-format perfetto option writes processed data to Perfetto’s native protobuf-based tracing format which can be visualized in the Perfetto UI at https://ui.perfetto.dev/.
Example:
neuron-profile view -d ./output --output-format perfetto
This will generate a system_profile.pftrace file for the system profile and a device_profile_model_<model_id>.pftrace file for each unique compiled model that was executed on a Neuron Device.
To view the system profile, go to https://ui.perfetto.dev/ and open the system_profile.pftrace file.
Note
When loading trace files in the Perfetto UI, your data is processed locally and not uploaded to Perfetto’s servers.
To view a device profile go to https://ui.perfetto.dev/ and open the device_profile_model_<model_id>.pftrace file. This will show a detailed view of hardware activity on the NeuronCore during execution of this graph.
Note
Your browser may run out of memory when viewing *.pftrace (Perfetto trace) files that are more than a few hundred MB. See the section Viewing Large Profiles in Perfetto for directions on how to view large traces using the trace processor.
Perfetto Output View Options#
When outputting to Perfetto it is possible to group your traces by different attributes. This is useful for larger profiles involving many NeuronCores and instances. The following options are available:
CLI option |
Description |
|---|---|
|
First-order grouping of trace events (maps to a Perfetto process / process group of rows). Provide a comma-delimited list of field names. Allowed fields: |
|
Second-order grouping of trace events (maps to a Perfetto thread / single row). Provide a comma-delimited list of field names. Allowed fields: |
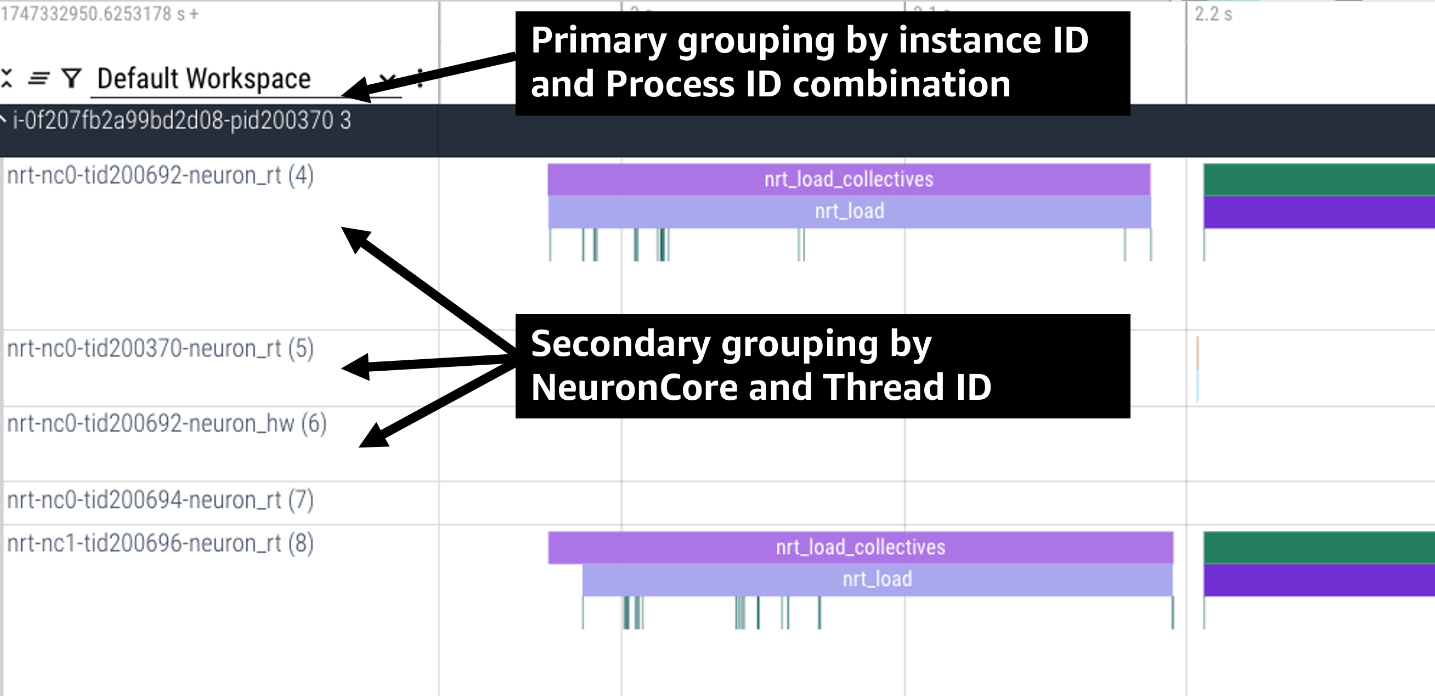
For example, the following profile uses neuron-profile view --output-format=perfetto --system-trace-primary-group=instance_id,process_id --system-trace-secondary-group=lnc_idx,thread_id to group the system profile first by unique combinations
of instance_id and process_id, and then in each of those groups there are rows of events with unique combinations of lnc_idx and thread_id.
Grouping By Global Worker ID#
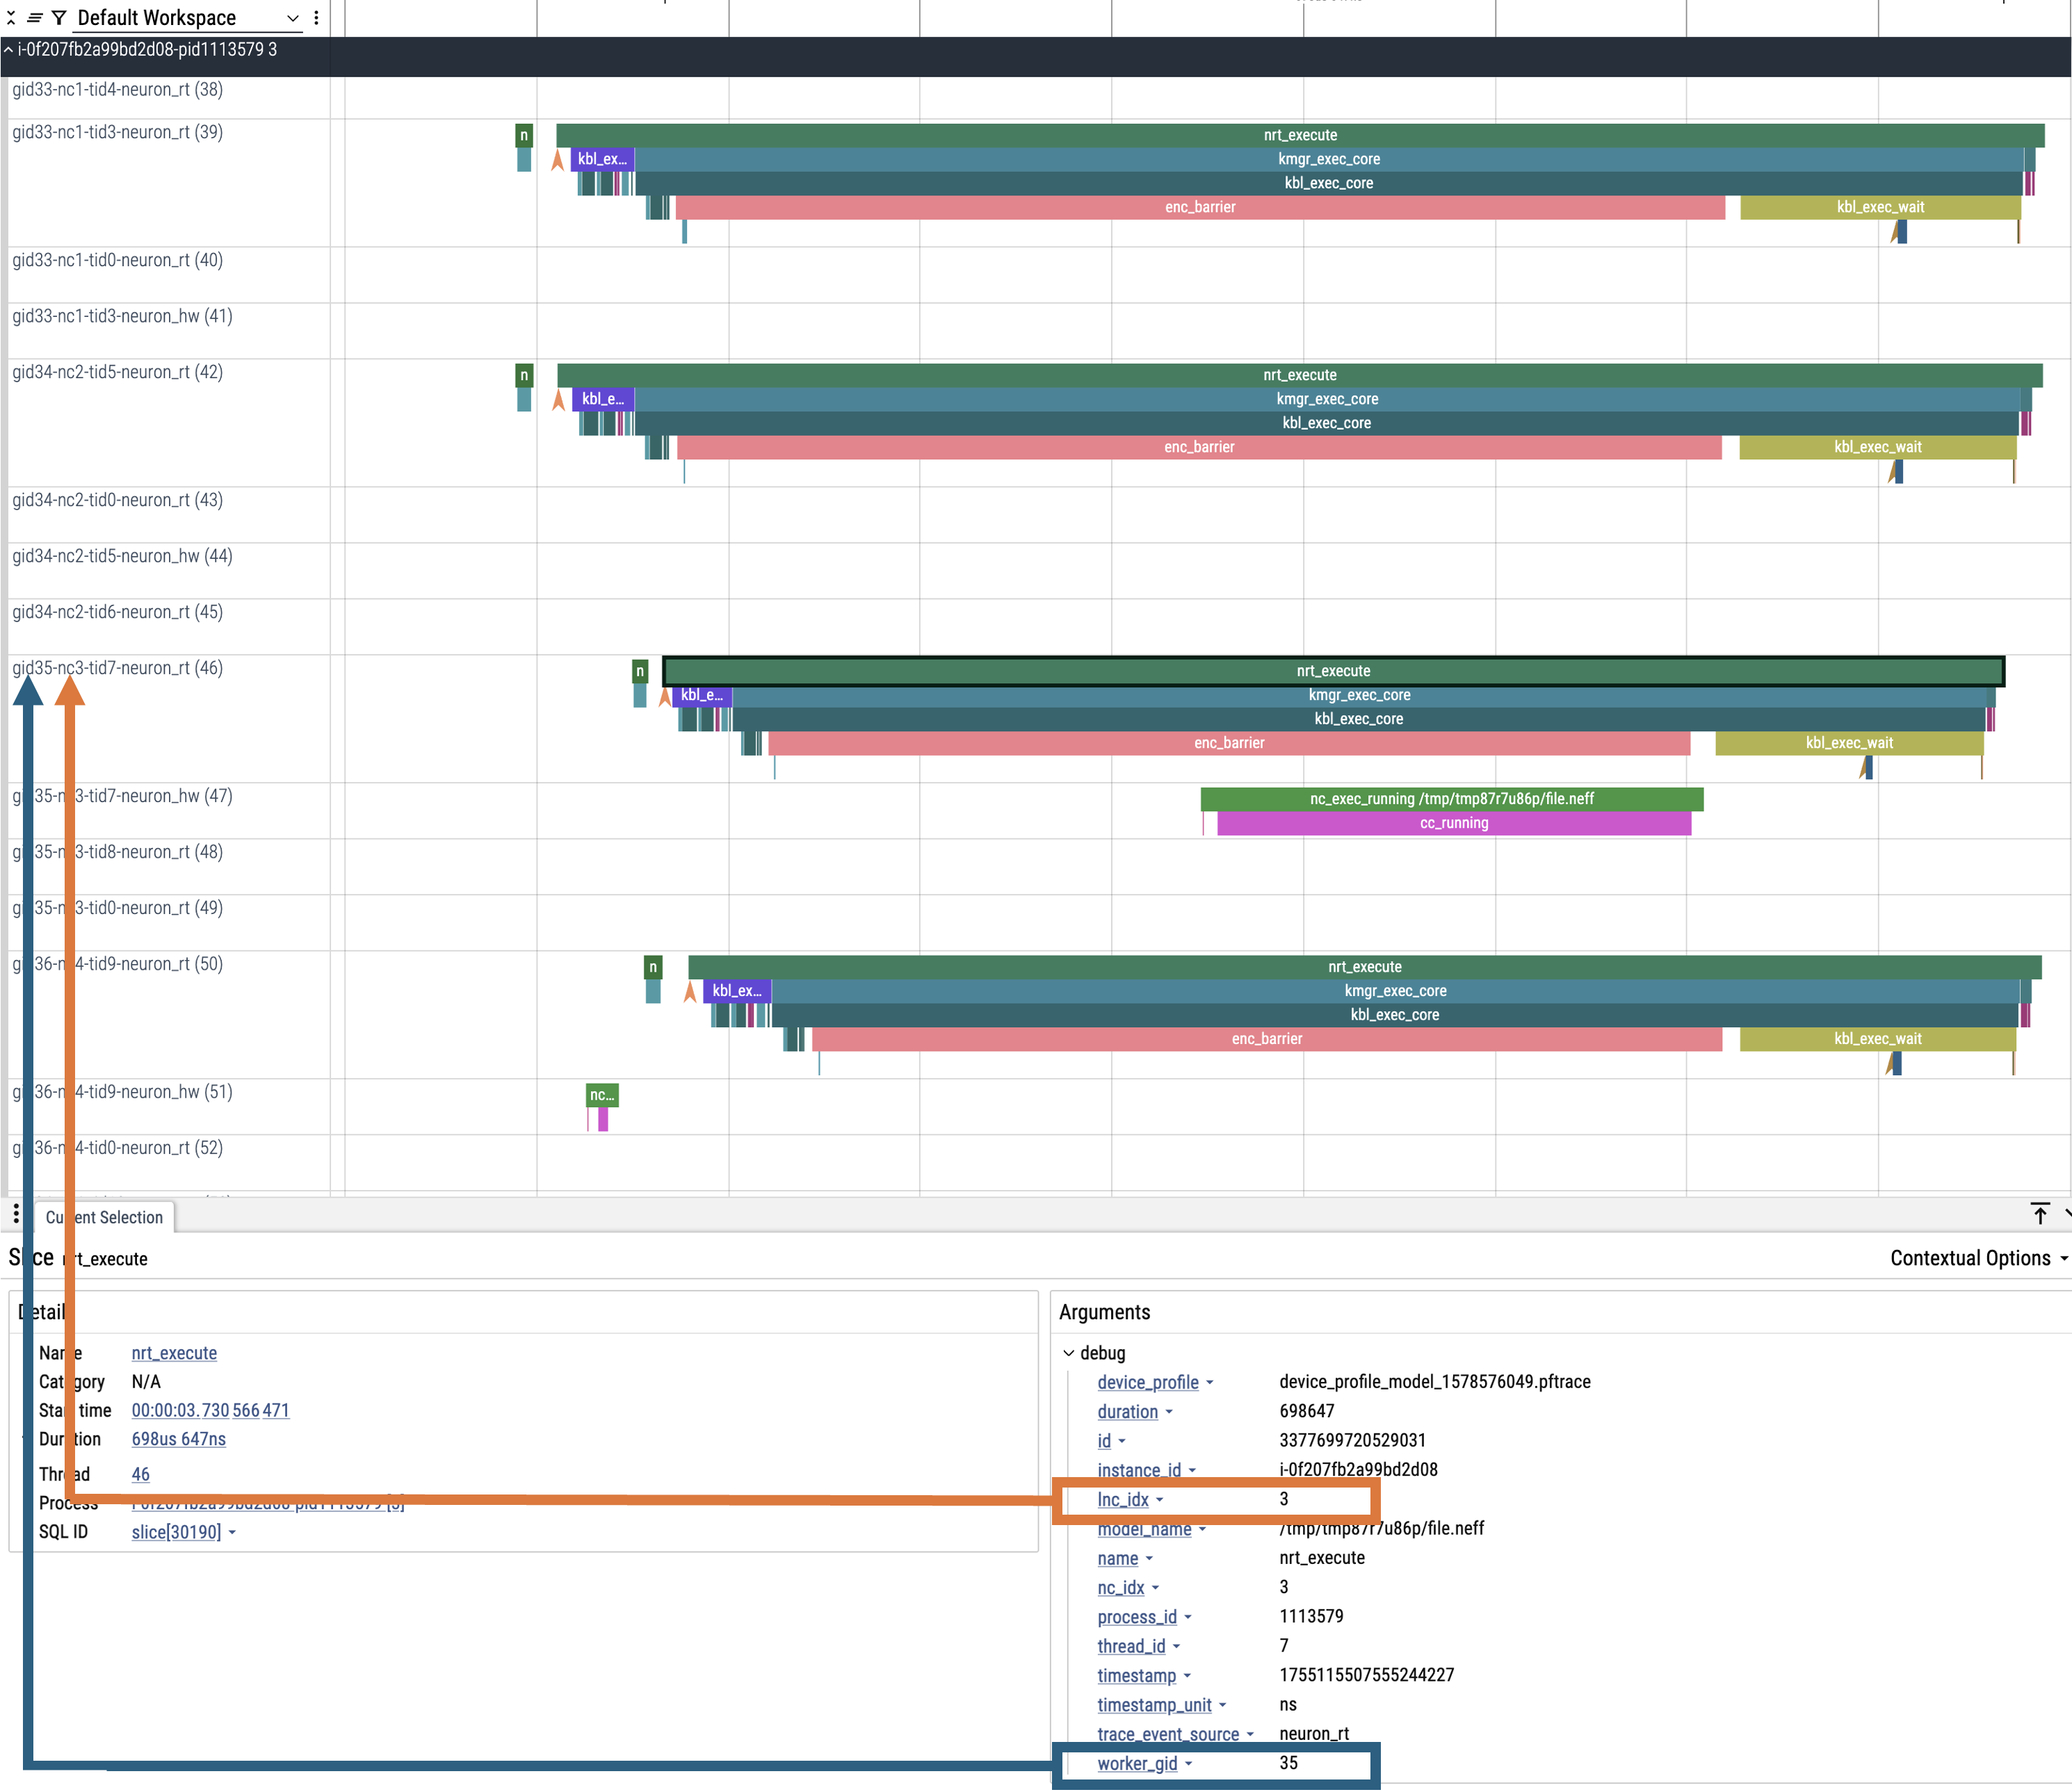
By default, Perfetto traces are grouped by worker_gid which is a unique global identifier for each NeuronCore across all instances in a distributed workload.
When clicking on an event in the trace you will see fields for both lnc_idx (local NeuronCore index on that process) and worker_gid (global NeuronCore index across all instances).
It is possible for lnc_idx to be the same for different processes on the same instance or across different instances in a distributed workload. However, worker_gid is unique for each NeuronCore across all instances.
The image below shows how to correlate the naming of tracks (rows) in the Perfetto UI to both lnc_idx and worker_gid.
Generating JSON Output From Profiles#
The --output-format json option writes processed profile data to human-readable JSON that can be used for scripting and manual inspection.
neuron-profile view -d ./output --output-format json
This will generate a system_profile.json file containing the system profile data and a device_profile_model_<model_id>.json file for each unique compiled model that was executed on a Neuron Device.
The system_profile.json JSON contains the following data types:
trace_events: Neuron Runtime API trace events and Framework/Application trace events containing timestamps, durations, names, and the ec2 instance-id to differentiate between events from different compute nodes in a distributed workload.
{
    "Neuron_Runtime_API_Event": {
        "duration": 27094,
        "group": "nrt-nc-000",
        "id": 1,
        "instance_id": "i-0f207fb2a99bd2d08",
        "lnc_idx": "0",
        "name": "nrt_tensor_write",
        "parent_id": 0,
        "process_id": "1627711",
        "size": "4",
        "tensor_id": "4900392441224765051",
        "tensor_name": "_unknown_",
        "thread_id": 1627711,
        "timestamp": 1729888371056597613,
        "type": 11
    },
    "Framework_Event": {
        "duration": 3758079,
        "group": "framework-80375131",
        "instance_id": "i-0f207fb2a99bd2d08",
        "name": "PjitFunction(matmul_allgather)",
        "process_id": "701",
        "thread_id": 80375131,
        "timestamp": 1729888382798557372,
        "type": 99999
    }
}
mem_usage: sampled host memory usage
{
    "duration": 1,
    "instance_id": "i-0f207fb2a99bd2d08",
    "percent_usage": 9.728179797845964,
    "timestamp": 1729888369286687792,
    "usage": 51805806592
}
cpu_util: sampled CPU utilization. Results are provided per core and per ec2 instance involved in a distributed workload
{
    "cpu_id": "47",
    "duration": 1,
    "instance_id": "i-0f207fb2a99bd2d08",
    "timestamp": 1729888371287337243,
    "util": 2.3255813
},
Processing only system or device profiles#
To reduce processing times it is possible to skip processing of system or device profiles. Sometimes users may only be interested in one or want to start with a limited set of profiling data before exploring the full profile.
To skip processing of device profiles use the --ignore-device-profile option. To skip processing of system profiles use the --ignore-system-profile option. These options can be used with the --output-format values db (default), perfetto, or json.
For example:
neuron-profile view -d ./output --ignore-device-profile --output-format perfetto
Filtering System Profiles#
This guide explains how to filter system trace events to optimize memory usage, reduce output size, and speed up trace processing. Capture-time filtering reduces memory usage and trace file size by only collecting specific events, but filtered data cannot be recovered later. Processing-time filtering preserves the complete trace and allows flexible analysis with different filters, but requires more memory and storage during capture.
Capture-Time Filtering#
Configure filters before trace capture using environment variables or API functions. You can use NeuronCore filters to only capture events for specific NeuronCores (for example only events associated with NeuronCore 0 or all the NeuronCores on a specific NeuronDevice). You can use event type filters to only capture specific events (for example model execute or collectives events). It is possible to combine both NeuronCore and event type filters.
Filtering by NeuronCore#
If capture is enabled for a NeuronCore then a ring buffer will be allocated in host memory for storing those core’s events. Thus filtering by NeuronCore decreases host memory usage during capture.
Default Behavior#
By default, all visible NeuronCores are enabled for capture.
Using Environment Variables#
# Filter to capture events only from NeuronCore 0
export NEURON_RT_INSPECT_EVENT_FILTER_NC=0

# Filter to capture events from NeuronCores 0, 2, and 4
export NEURON_RT_INSPECT_EVENT_FILTER_NC=0,2,4

# Filter to capture events from a range of NeuronCores (0 through 3)
export NEURON_RT_INSPECT_EVENT_FILTER_NC=0-3

# Reset to default behavior
unset NEURON_RT_INSPECT_EVENT_FILTER_NC # Back to capturing all visible cores
Using API Functions#
#include <nrt/nrt_sys_trace.h>

// Allocate and configure trace options
nrt_sys_trace_config_t *config;
nrt_sys_trace_config_allocate(&config);
nrt_sys_trace_config_set_defaults(config);

// Enable capture only for specific NeuronCores

// Disable all cores since by default they are all enabled
int num_cores = 128;
for (int i=0; i<num_cores; i++) {
  nrt_sys_trace_config_set_capture_enabled_for_nc(config, i, false); // disable NC i
}

// Then enable specific cores
nrt_sys_trace_config_set_capture_enabled_for_nc(config, 0, true);  // Enable NC 0
nrt_sys_trace_config_set_capture_enabled_for_nc(config, 2, true);  // Enable NC 2

// Start tracing with the configuration
nrt_sys_trace_start(config);

// Your application code here...

// Stop tracing and cleanup
nrt_sys_trace_stop();
nrt_sys_trace_config_free(config);
Filtering by Event Type#
Default Behavior#
By default, all event types are enabled for capture.
Getting Available Event Types#
You can discover all available event types using the nrt_sys_trace_get_event_types API.
#include <nrt/nrt_sys_trace.h>

// Get all available event types
const char **event_types = nullptr;
size_t count = 0;
NRT_STATUS status = nrt_sys_trace_get_event_types(&event_types, &count);

if (status == NRT_SUCCESS) {
    printf("Available event types:\n");
    for (size_t i = 0; i < count; ++i) {
        printf("  %s\n", event_types[i]);
    }

    // Free the event types array
    for (size_t i = 0; i < count; ++i) {
        free((void*)event_types[i]);
    }
    free((void*)event_types);
}
Using Environment Variables#
The NEURON_RT_INSPECT_EVENT_FILTER_TYPE environment variable supports:
Default: If not set, all event types are captured
Specific event types: Use exact event names from
nrt_sys_trace_get_event_types()Event categories: Use
hardwareorsoftwareto filter by categoryExclusion: Use
^prefix to exclude specific events from a category
# Filter to capture only specific event types
export NEURON_RT_INSPECT_EVENT_FILTER_TYPE=nrt_load,nrt_execute,nc_exec_running

# Filter to capture all hardware events
export NEURON_RT_INSPECT_EVENT_FILTER_TYPE=hardware

# Filter to capture all software events
export NEURON_RT_INSPECT_EVENT_FILTER_TYPE=software

# Filter to capture all hardware events EXCEPT cc_exec
export NEURON_RT_INSPECT_EVENT_FILTER_TYPE=hardware,^cc_running

# Filter to capture all software events EXCEPT nrt_load
export NEURON_RT_INSPECT_EVENT_FILTER_TYPE=software,^nrt_load

# Mix categories and specific events
export NEURON_RT_INSPECT_EVENT_FILTER_TYPE=hardware,nrt_tensor_write,nrt_tensor_read

# Reset to default behavior
unset NEURON_RT_INSPECT_EVENT_FILTER_TYPE  # Back to capturing all event types
The hardware group contains events that are executed on the NeuronCore.
These are nc_exec_running, cc_running, cc_exec_barrier, numerical_err, nrt_model_switch, timestamp_sync_point, hw_notify.
The software group contains all other events.
Using API Functions#
Use the nrt_sys_trace_config_set_capture_enabled_for_event_type API to filter by event type.
#include <nrt/nrt_sys_trace.h>

// Configure trace options
nrt_sys_trace_config_t *config;
nrt_sys_trace_config_allocate(&config);
nrt_sys_trace_config_set_defaults(config); // By default, all event types are enabled

// Disable specific event types (others remain enabled)
nrt_sys_trace_config_set_capture_enabled_for_event_type(config, "device_exec", false);

// Or disable all first, then enable only specific ones
const char **all_event_types = nullptr;
size_t all_count = 0;
nrt_sys_trace_get_event_types(&all_event_types, &all_count);

// Disable all event types first
for (size_t i = 0; i < all_count; ++i) {
    nrt_sys_trace_config_set_capture_enabled_for_event_type(config, all_event_types[i], false);
}

// Enable only specific event types
nrt_sys_trace_config_set_capture_enabled_for_event_type(config, "model_load", true);
nrt_sys_trace_config_set_capture_enabled_for_event_type(config, "nrt_execute", true);

// Verify which event types are enabled
const char **enabled_types = nullptr;
size_t enabled_count = 0;
nrt_sys_trace_config_get_enabled_event_types(config, &enabled_types, &enabled_count);
printf("Enabled event types: %zu\n", enabled_count);
for (size_t i = 0; i < enabled_count; ++i) {
    printf("  %s\n", enabled_types[i]);
}

// Clean up memory (caller is responsible)
for (size_t i = 0; i < enabled_count; ++i) {
    free((void*)enabled_types[i]);
}
free((void*)enabled_types);

for (size_t i = 0; i < all_count; ++i) {
    free((void*)all_event_types[i]);
}
free((void*)all_event_types);

// Start tracing
nrt_sys_trace_start(config);

// Your application code here...

// Cleanup
nrt_sys_trace_stop();
nrt_sys_trace_config_free(config);
Adjusting Hardware Timestamps#
Hardware events executed on the NeuronCore use device-specific timestamps that are in a different time domain than CPU timestamps. To enable accurate correlation between hardware and software events in the JSON system trace output, the runtime automatically adjusts hardware event timestamps to the CPU time domain using synchronization point events.
How Timestamp Adjustment Works#
System trace events are generated from multiple independent time domains: the CPU host and each ML accelerator devices operating with their own clocks. To align events from different domains, the runtime performs software-based time synchronization after event collection.
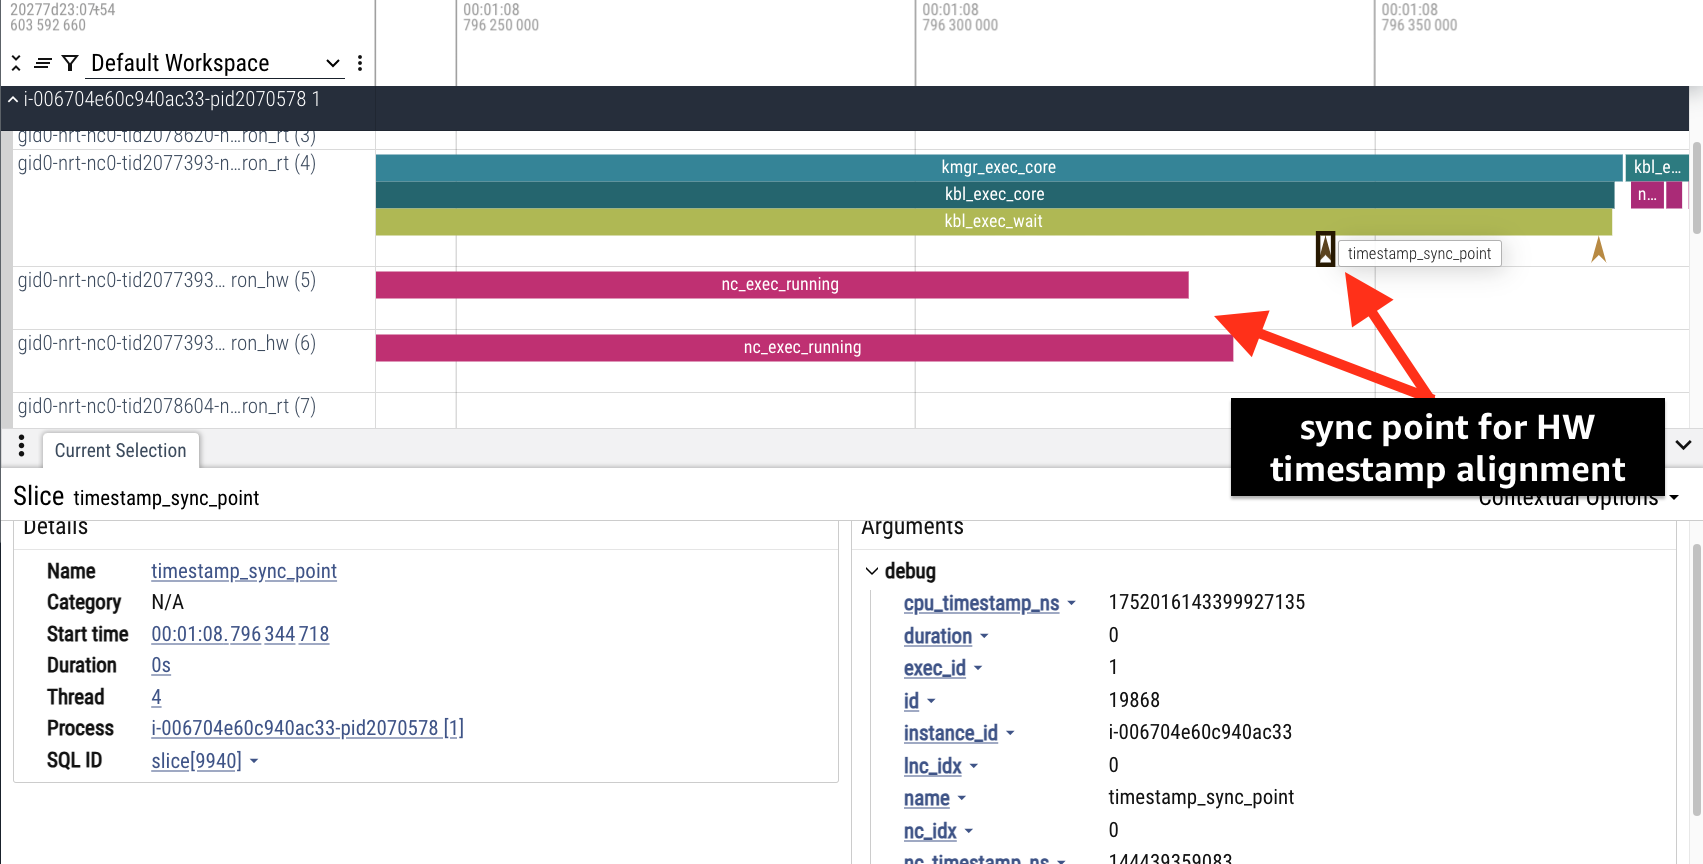
Sync Point Events: After each execution, a special timestamp_sync_point event captures nearly simultaneous timestamps from both the host CPU (cpu_timestamp_ns) and the device (nc_timestamp_ns). These sync events are used to adjust the timestamps of hardware events to the CPU domain.
These synchronization events are included in the returned event trace and serve as reference points for timestamp adjustment. Users can see the sync point used for aligning hardware events in the timeline.
Adjustment Algorithm: For each hardware event, the runtime:
Uses the sync point with matching exec_id for that NeuronCore
Calculates the time difference between the hardware event and the sync point (in device time)
Applies that same time difference to the sync point’s CPU timestamp
Formula:
adjusted_timestamp = sync_cpu_timestamp + (event_device_timestamp - sync_device_timestamp)
Illustration:
     Sync_Point           HW_Event
             │                │
             ▼                ▼
Device Time ─●────────────────●───>
             |-------Δt------>|     - sync_device_timestamp and sync_cpu_timestamp occur ~simultaneously, though their clocks differ
CPU Time ────●────────────────●───> - Calc Δt = event_device_timestamp - sync_device_timestamp (elapsed time since sync point on device)
             |-------Δt------>|     - Add Δt to sync_cpu_timestamp to get adjusted_timestamp
Hardware Events: Hardware events that require timestamp adjustment include:
nc_exec_running(NeuronCore execution start/stop)cc_running(collective communication execution)cc_exec_barrier(collective communication barriers)numerical_err(numerical errors)nc_model_switch(NeuronCore model switching)
Tips#
Memory Optimization: Use NeuronCore filtering to avoid allocating ring buffers for unused cores and decrease host memory usage. Use both event type or NeuronCore to decrease output trace sizes.
Event Type Discovery: Use
nrt_sys_trace_get_event_types()to discover available event typesCategory Filtering: Use
hardware/softwarecategories for broad filteringExclusion Filtering: Use
^prefix to exclude specific events from categoriesCombine Filters: Use both NeuronCore and event type filters together for maximum optimization
Processing-Time Filtering#
Apply filters when viewing or processing already captured profiles. This approach allows you to
analyze the same trace data in different ways without recapturing. The filters can be used for any
neuron-profile output format including --output-format json and --output-format perfetto.
Filtering by NeuronCore#
Use the --system-trace-filter-neuron-core to only process events for specific NeuronCores. The IDs are local to the instance and not global IDs.
If the --system-trace-filter-neuron-core argument is not set then events from all NeuronCores will be included in the processed trace.
# Filter by single neuron core
neuron-profile view -d ./output --system-trace-filter-neuron-core "0" --output-format perfetto

# Filter by multiple neuron cores
neuron-profile view -d ./output --system-trace-filter-neuron-core "0,1,2,3" --output-format perfetto
Filtering by Event Type#
Use the --system-trace-filter-event-type to only process specific trace events types.
If the --system-trace-filter-event-type argument is not set then all event types will be included in the processed trace.
# Filter by single event type
neuron-profile view -d ./output --system-trace-filter-event-type "nrt_execute" --output-format perfetto

# Filter by multiple event types
neuron-profile view -d ./output --system-trace-filter-event-type "nrt_execute,nrt_load" --output-format perfetto
Filtering by Instance ID#
Use the --system-trace-filter-instance-id to only process events for specific ec2 instances.
If the --system-trace-filter-instance-id argument is not set then events from all instances will be included in the processed trace.
# Filter by single instance
neuron-profile view -d ./output --system-trace-filter-instance-id "i-abc123" --output-format perfetto

# Filter by multiple instances (comma-separated)
neuron-profile view -d ./output --system-trace-filter-instance-id "i-abc123,i-def456,i-ghi789" --output-format perfetto
Troubleshooting#
Incomplete JAX Profiles#
If your JAX profile has fewer events than expected or lacks the Runtime API trace, check whether
jax.profiler.stop_trace is being called inside a with jax.profiler.trace context block.
This can prematurely stop tracing. Use jax.profiler.stop_trace only when profiling was started
with jax.profiler.start_trace, not when using the context-managed with jax.profiler.trace API.
Also when using jax.profiler within your script ensure that the
environment variable NEURON_RT_INSPECT_ENABLE is not set to 1.
Additionally, ensure that NEURON_RT_INSPECT_OUTPUT_DIR is set to
the correct output directory and this is the output directory passed to
with jax.profiler.trace.
Dropped Events in System Profile#
When processing a system profile, you may see a warning indicating that some trace events were dropped during capture.
WARN[0000] Warning: 1001 trace events were dropped during capture (stored 530560 out of 531561 total events). Consider increasing buffer size, reducing trace duration, or filtering events.
This means during capture the trace event buffers filled and oldest events were overwritten. If you need to avoid dropping events for the full duration of your workload consider the following adjustments:
Increase buffer size by setting
NEURON_RT_INSPECT_SYS_TRACE_MAX_EVENTS_PER_NC(see Profile Capture Environment Variables). This will increase host memory usage.Apply capture-time filters (NeuronCores / event types) (see Filtering System Profiles.)
Shorten profiled region: limit the code span under the profiling context / runtime.
This document is relevant for: Inf1, Inf2, Trn1, Trn2