
This document is relevant for: Inf1, Inf2, Trn1, Trn2, Trn3
Neuron Profiler User Guide#
The Neuron Profiler, neuron-profile, is a tool to profile and analyze performance of a ML model compiled with the Neuron compiler and run on NeuronDevices.
Important
The Neuron Profiler will be replaced by the new Neuron Explorer in a future release. For more details and migration guidance, see Neuron Explorer FAQ.
neuron-profile helps developers identify performance bottlenecks and optimize their workloads for NeuronDevices. neuron-profile provides insights into NeuronDevice activity including the instructions executed on each compute engine (ex. Tensor engine, Vector engine, etc.), DMA data movement activity, and performance metrics such as engine utilization, DMA throughput, memory usage, and more. NeuronDevice activity is collected by the neuron-profile capture command which runs the model with tracing enabled. Profiling typically has near zero overhead because NeuronDevices have dedicated on-chip hardware profiling.
Additionally, neuron-profile supports Neuron Kernel Interface (NKI) developers in profiling their kernels. For more information, please refer to Profile a NKI Kernel
Installation#
neuron-profile comes as part of the aws-neuronx-tools package, and will be installed to /opt/aws/neuron/bin.
Note
neuron-profile requires Ubuntu 22.04 or newer, or Amazon Linux 2023 or newer.
Capturing profiles requires an Inferentia or Trainium instance, but processing profiles
can be done on any instance type.
The Neuron web profile viewer utilizes InfluxDB OSS 2.x to store time series data for the profiled workloads after post processing. Please follow the instructions provided at https://portal.influxdata.com/downloads/ for the correct OS. A sample installation of Neuron Profile and InfluxDB is provided below.
Ubuntu#
# Install Neuron Profile
. /etc/os-release
sudo tee /etc/apt/sources.list.d/neuron.list > /dev/null <<EOF
deb https://apt.repos.neuron.amazonaws.com ${VERSION_CODENAME} main
EOF

wget -qO - https://apt.repos.neuron.amazonaws.com/GPG-PUB-KEY-AMAZON-AWS-NEURON.PUB | sudo apt-key add -
sudo apt-get update -y
sudo apt-get install aws-neuronx-runtime-lib aws-neuronx-dkms -y
sudo apt-get install aws-neuronx-tools -y

# Install InfluxDB
wget -q https://repos.influxdata.com/influxdata-archive_compat.key
echo '393e8779c89ac8d958f81f942f9ad7fb82a25e133faddaf92e15b16e6ac9ce4c influxdata-archive_compat.key' | sha256sum -c && cat influxdata-archive_compat.key | gpg --dearmor | sudo tee /etc/apt/trusted.gpg.d/influxdata-archive_compat.gpg > /dev/null
echo 'deb [signed-by=/etc/apt/trusted.gpg.d/influxdata-archive_compat.gpg] https://repos.influxdata.com/debian stable main' | sudo tee /etc/apt/sources.list.d/influxdata.list

sudo apt-get update && sudo apt-get install influxdb2 influxdb2-cli -y
sudo systemctl start influxdb
influx setup
# Fill in the information to finish the setup
Capturing a profile#
The neuron-profile tool can both capture and post-process profiling information. neuron-profile takes a compiled model (a NEFF), executes it, and saves the profile results to a NTFF (profile.ntff by default).
For this example, we assume a NEFF is already available as file.neff
$ neuron-profile capture -n file.neff -s profile.ntff
Capturing profiles for multi-worker jobs#
neuron-profile can capture profiles for collectives-enabled NEFFs running across multiple NeuronCores, NeuronDevices, or even nodes.
This is useful for understanding performance and communication overheads when deploying larger distributed models.
The following example, performs a distributed run across all NeuronDevices and NeuronCores on an inf2.24xlarge instances, capturing profiles for all 12 workers (one for each NeuronCore).
$ neuron-profile capture -n file.neff --collectives-workers-per-node 12 -s output/profile.ntff
A profile is saved for each worker in the output directory.
$ ls output
profile_rank_0.ntff   profile_rank_2.ntff  profile_rank_6.ntff profile_rank_1.ntff   profile_rank_3.ntff  profile_rank_7.ntff
profile_rank_10.ntff  profile_rank_4.ntff  profile_rank_8.ntff profile_rank_11.ntff  profile_rank_5.ntff  profile_rank_9.ntff
It is also possible to run a distributed job while only capturing a profile for a specific worker instead of all workers. To do that, use the --collectives-profile-id option.
$ neuron-profile capture -n file.neff --collectives-profile-id 5 --collectives-workers-per-node 12 -s output/profile.ntff
$ ls output
profile_rank_5.ntff
Providing per-worker inputs#
By default, neuron-profile capture uses all-zero inputs or a single set of inputs specified via positional arguments. For multi-worker jobs where each worker needs different inputs, use the --multi-input (-m) option to specify a file that maps inputs to each worker.
Each line in the multi-input file corresponds to one worker and follows the same format as the positional inputs argument (<NAME> <FILE_PATH> pairs separated by spaces). For example, for a 2-worker job:
# inputs.txt
IN1 worker0_x.npy IN2 worker0_y.npy
IN1 worker1_x.npy IN2 worker1_y.npy
Then capture the profile with:
$ neuron-profile capture -n file.neff -m inputs.txt --collectives-workers-per-node 2 -s output/profile.ntff
Note
The --multi-input option cannot be used together with the positional inputs argument.
Capturing profiles for multi-node jobs#
For multi-node jobs, neuron-profile must be invoked on each node using the collectives-worker-start-id to specify the global index of the first worker on the given
node. For example, for a two node job with a total of four workers and two workers per node, the following commands are run on each node.
# on node 0
$ neuron-profile capture -n file.neff --collectives-worker-start-id 0 --collectives-workers-per-node 2 --collectives-worker-count 4
# on node 1
$ neuron-profile capture -n file.neff --collectives-worker-start-id 2 --collectives-workers-per-node 2 --collectives-worker-count 4
neuron-profile saves the profile for a worker on the node where that worker was launched. So in the case above, profile_rank_0.ntff and profile_rank_1.ntff
are saved to node 0, and profile_rank_2.ntff and profile_rank_3.ntff are saved to node 1.
Processing and viewing the profile results#
To analyze and view the collected profiling data, use the view subcommand of neuron-profile. This command performs two main functions: it post-processes the profiling data and starts up an HTTP server. Once the server is running, you can access the profiling results through your web browser. Please note: Chrome is the officially supported browser for viewing profiling results
Note
Profiles can be processed and viewed on another machine without Neuron devices. The aws-neuronx-tools package
needs to be installed so that you can run neuron-profile view. To process the profile on another
instance, you need to copy the NEFF and NTFF files from your Inf or Trn instance to that instance.
Viewing a single profile#
The first way to invoke neuron-profile view is to pass both the NEFF and the NTFF to this command.
It will post-process these artifacts and print out a direct link to the profile view.
$ neuron-profile view -n file.neff -s profile.ntff
View profile at http://localhost:3001/profile/n_fdc71a0b582ee3009711a96e59958af921243921
ctrl-c to exit
Viewing profiles for multi-worker jobs#
Profiles from multi-worker jobs (i.e. more than one NeuronCore) can either be viewed individually or in a combined collectives view. Since profile data is often similar between workers and processing profile data for all workers can be time-consuming, it is recommended to first explore the profile for a single worker or small subset of workers. Viewing the profile for a specific worker is the same as for single-worker profiles.
$ neuron-profile view -n file.neff -s output/profile_rank_5.ntff
View profile at http://localhost:3001/profile/n_fdc71a0b582ee3009711a96e59958af921243921
To view the profile for multiple workers, pass the directory containing all worker profiles to neuron-profile.
$ neuron-profile view -n file.neff -d output
View profile at http://localhost:3001/profile_cc/p_9a69d907e1350100c9b03745eaa67aa7422842ed
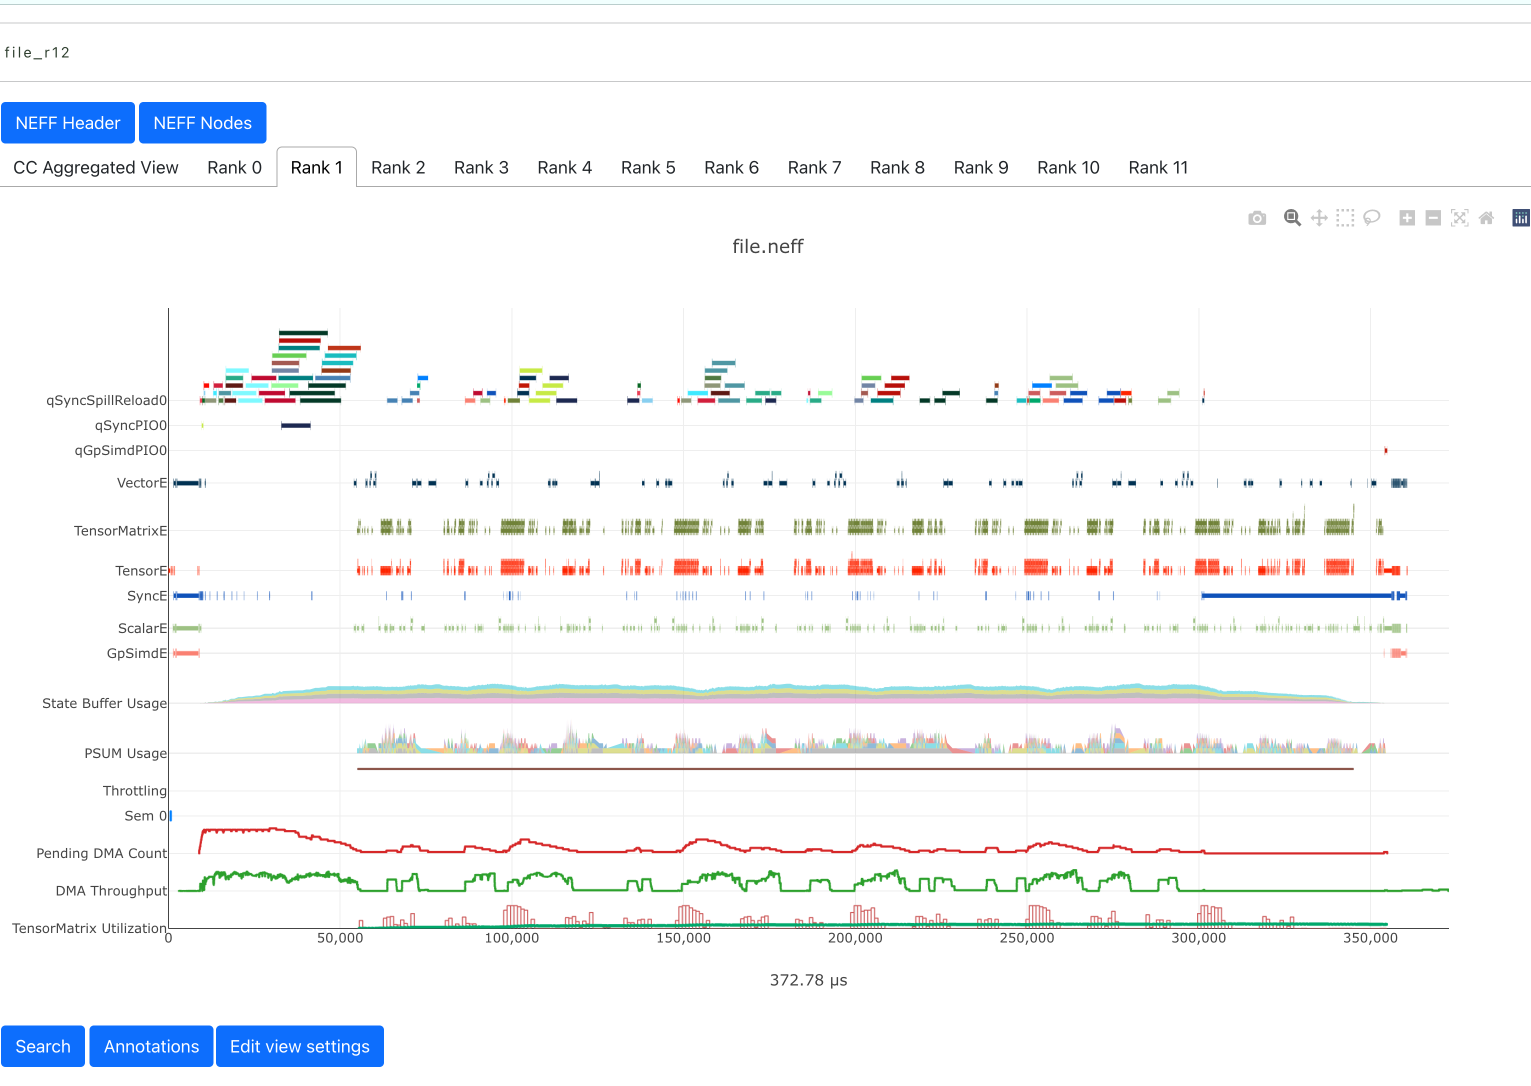
When viewing profiles with the combined collectives view you can easily switch between the timelines of different workers by clicking the “Rank <x>” tabs.
Note: the “CC Aggregated View” currently shows no data. This will be populated in an upcoming release.
Viewing multiple profiles#
Alternatively, when post-processing multiple profiles, it may be desirable to have a persistent server running while processing results in the background. In this case, we can skip passing arguments to the command, which will direct users to the main page listing all available profiles.
$ neuron-profile view
View a list of profiles at http://localhost:3001/
In a separate window, we can kick off the post-processing without launching another server by passing the --ingest-only flag.
$ neuron-profile view -n file.neff -s profile.ntff --ingest-only
Profile "n_47cf9972d42798d236caa68952d0d29a76d8bd66" is ready to view
n_47cf9972d42798d236caa68952d0d29a76d8bd66 is the bucket where the data is stored. We can find this profile at localhost:3001/profile/<bucket>.
Accessing the profiles#
If neuron-profile view is run on a remote instance, you may need to use port forwarding to access the profiles.
From the local machine, SSH to the remote instance and forward ports 3001 (the default neuron-profile HTTP server port) and 8086 (the default
InfluxDB port). Then in the browser, go to localhost:3001 to view the profiles.
$ ssh <user>@<ip> -L 3001:localhost:3001 -L 8086:localhost:8086
Alternative output formats#
Besides the web view mentioned above, neuron-profile also supports other output formats such as summary-text and summary-json for viewing overall metrics of the profile,
as well as json for a parsable alternative.
Profile summary#
You can see a summary of each profile using the command neuron-profile view --output-format summary-text -n file.neff -s output/profile_rank_<i>.ntff. This output
includes summary metrics and fields for the NeuronCore (nc_idx) and NeuronDevice (nd_idx) on which the worker was run. For example, the following shows worker 5 used core 1 on
device 3 and took 0.017 seconds (17 ms) to run the model.
$ neuron-profile view --output-format summary-text -n file.neff -s output/profile_rank_5.ntff | grep -e "nd_idx" -e "nc_idx" -e "total_time"
nc_idx      1
nd_idx      2
total_time  0.017
This summary is also available as JSON using --output-format summary-json.
JSON#
You can also view the profile summary and all post-processed profiler events together as a single JSON. To do that, use the --output-format json option.
$ neuron-profile view --output-format json --output-file profile.json -n file.neff -s output/profile_rank_5.ntff
$ cat profile.json
{
    "summary": [
        {
            "total_time": 0.017,
            "event_count": 11215
            [...]
        }
    ],
    "instruction": [
        {
            "timestamp": 10261883214,
            "duration": 148,
            "label": "TensorMatrix",
            "hlo_name": "%add.1 = add(%dot, %custom-call.44)",
            "opcode": "MATMUL",
            "operands": "S[5] (Tensor)++@complete acc_flags=3 row_grp=q0 src=fp16@0x5600[1,0,0][3,1,1] dst=0x2000000[1,0,0][3,1,1] 3*128 "
        },
        [...]
    ]
}
Understanding a Neuron profile#
The section provides a quick overview on what features and information are available through the Neuron web profile viewer.
For more information on terms used, please check out the Neuron Glossary.
Timeline#
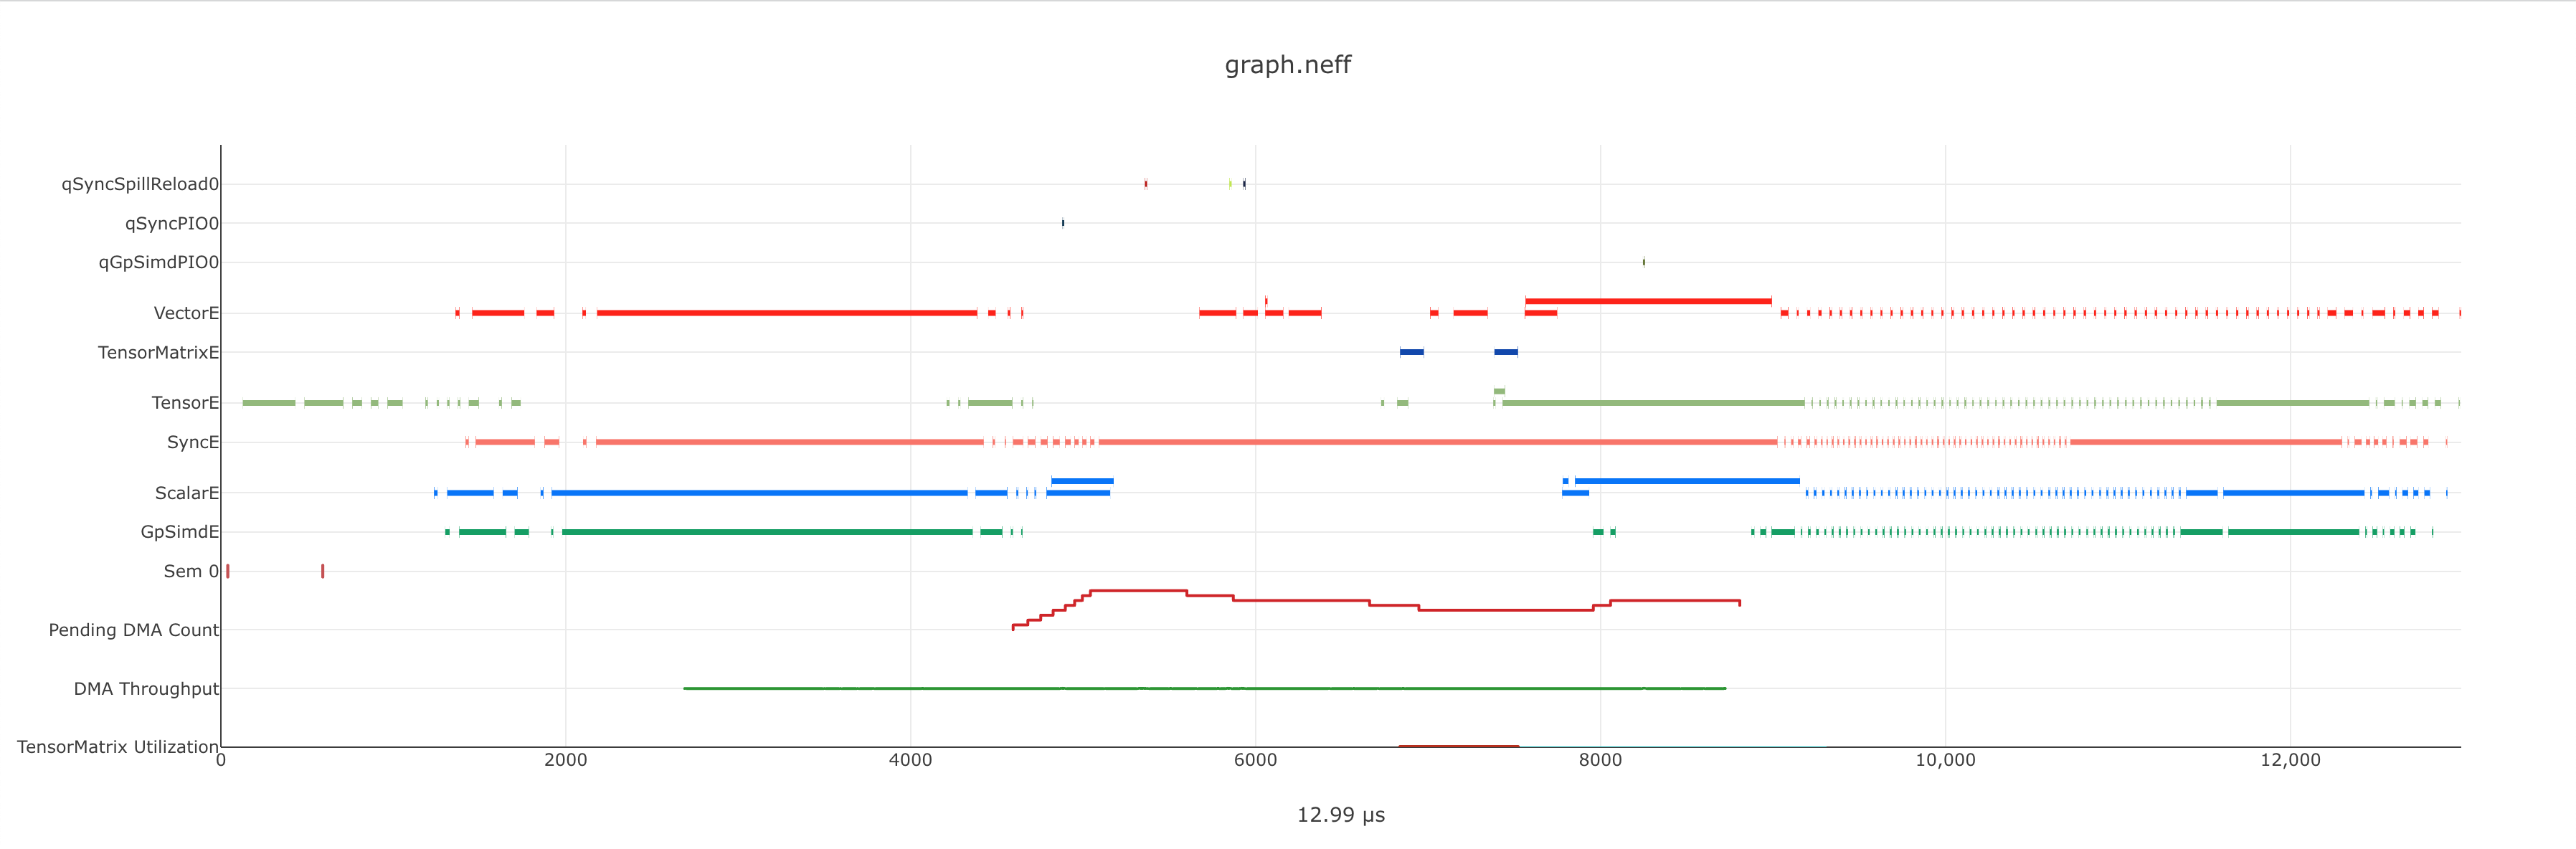
The execution timeline is plotted based on the elapsed nanoseconds since the start of execution.
Starting from the bottom, the TensorMatrix Utilization shows the efficiency of the TensorEngine, and
the Pending DMA Count and DMA Throughput rows show the DMA activity. In general, we want these to be as high
as possible, and in some cases may help give clues as to whether the workload is memory or compute bound.
Next are the individual NeuronCore engine executions. These rows show the start and end times for instructions executed by each
engine, and clicking on one of these bars will show more detailed information, as well as any dependencies that were found.
For models involving collective compute operations, you will additionally see rows labeled with CC-core, which are used to synchronize
the CC operations.
Towards the top is the DMA activity. These can include the transfers of input and output tensors, intermediate tensors, and any additional spilling or loading to and from the on-chip SRAM memory.
Features#
The following are some useful features that may help with navigating a profile:
Dragging your cursor across a portion of the timeline will zoom in to the selected window, providing a more in depth view of the execution during that time period.
Hovering over a point will reveal a subset of information associated with it.
Clicking a point will open a text box below the timeline with all the information associated with it.
Right-clicking a point will drop a marker at a certain location. This marker will persist when zooming in and out.
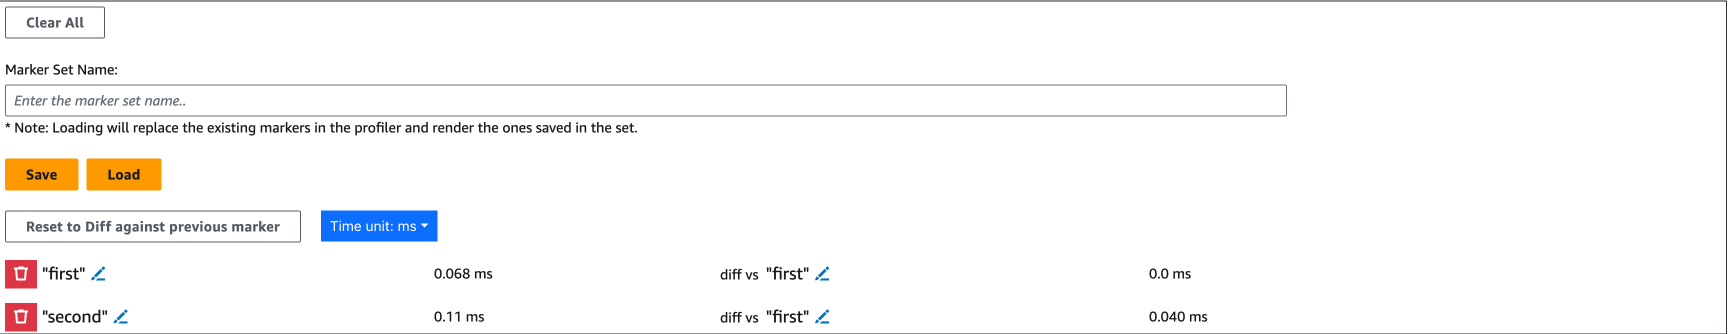
All marker information can be found by clicking the
Annotationsbutton.Markers can be saved and loaded by using a provided name for the marker set.
Individual markers can be renamed or deleted in this menu as well.
Time span between markers will automatically be shown, and users can change the marker name next to
diff vsto calculate time between other markers.
The “Search” tab can be used to find and highlight specific points in the profile related to the queried field(s).
Click on the “Box Select” button in the top-right corner of the timeline and then click and drag on any region of the plot to select all events in that region and get summary statistics such as total duration and breakdowns of opcodes, transfer_sizes, and more.
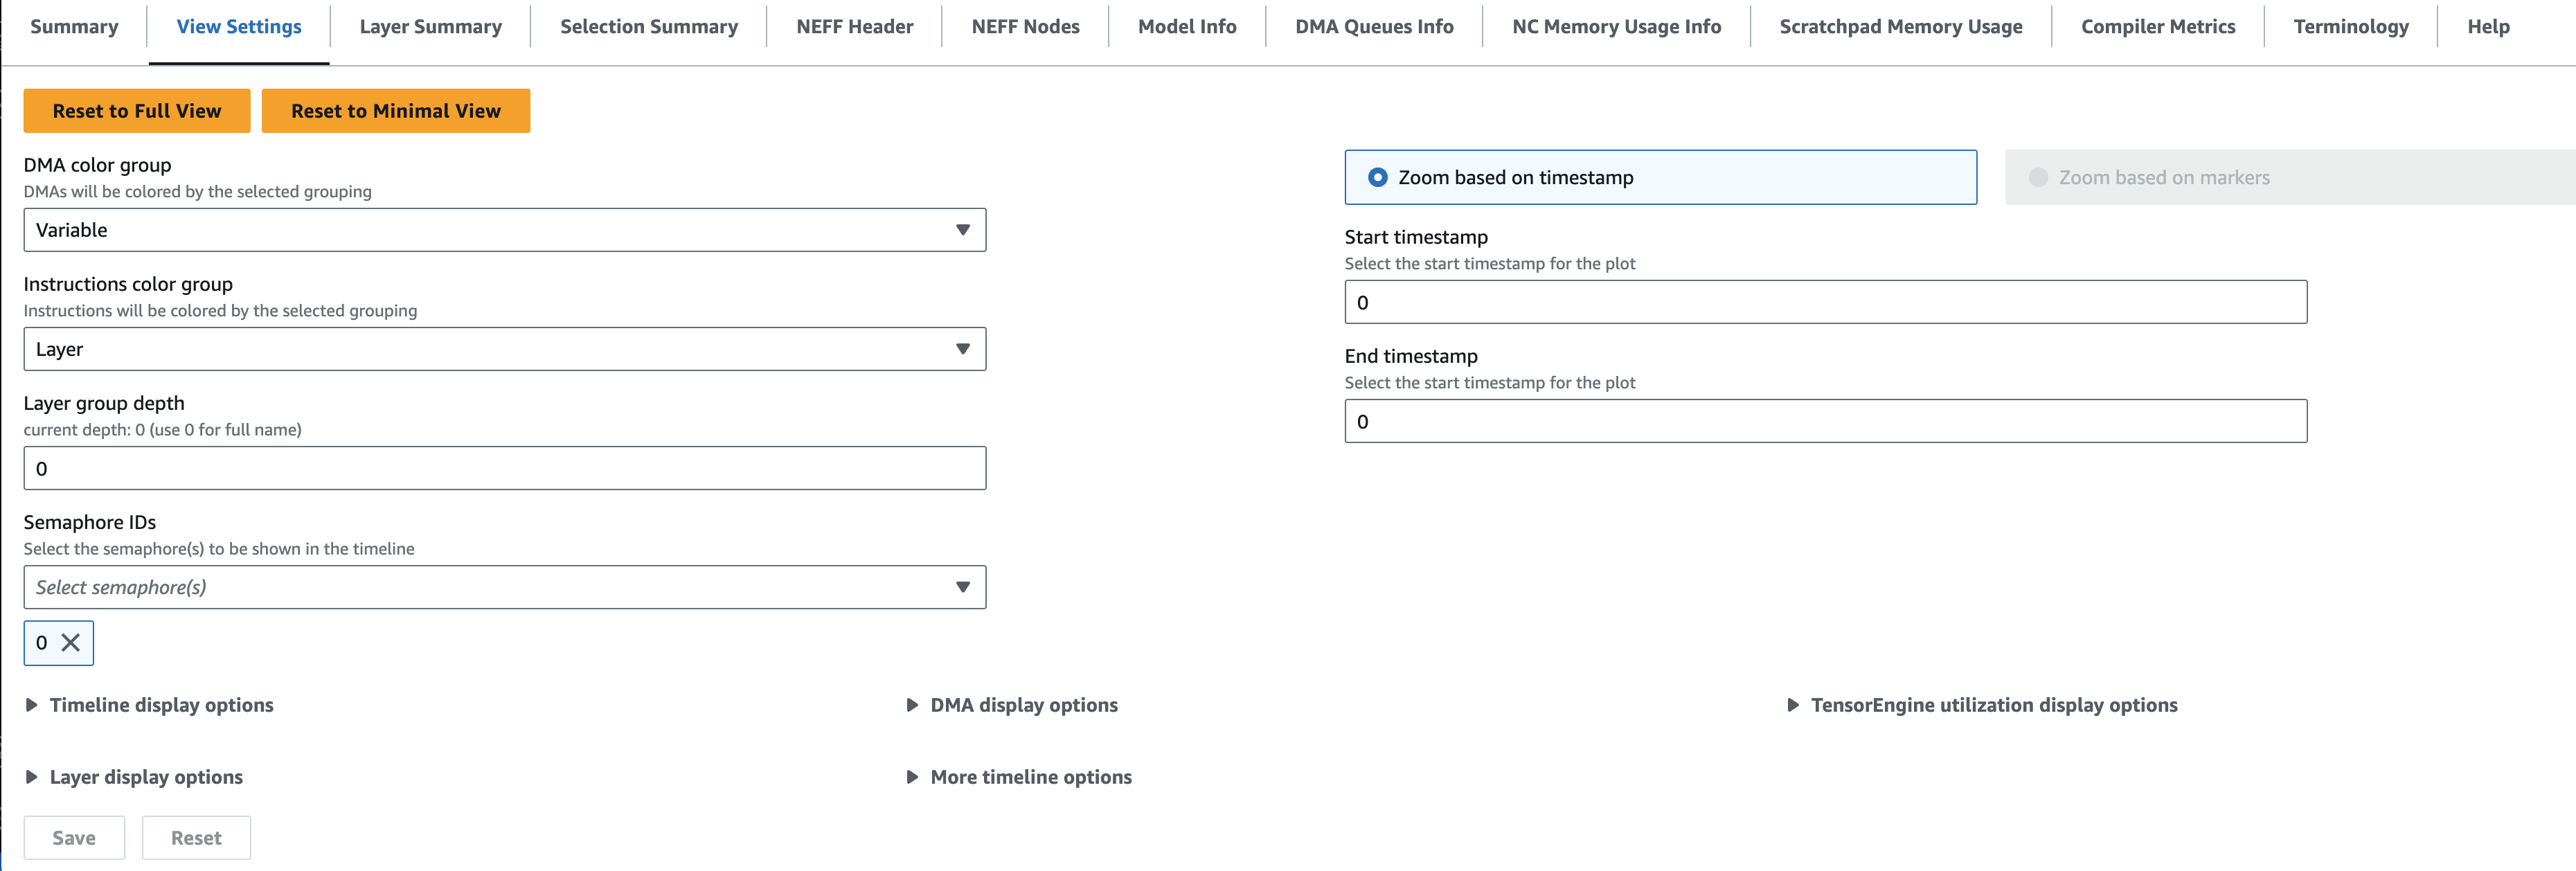
View Settings#
Options within the View Settings tab can be used to further customize the timeline view. Editing any settings will update the URL accordingly, which can be used to re-visit the current view at a later time.
To speed up initial load times, the default will be a Minimal View which only shows the instructions executed and the model FLOPs utilization (MFU) over time. Changing between the minimal and full views can also be done through the Reset to Full View or Reset to Minimal View buttons.
DMA color groupwill recolor DMAs based on the selected grouping. For example, “Engine” will re-color the DMAs based on the associated engine.Instruction color groupwill recolor instructions based on the selected grouping. For example, “Layer” will re-color the timeline based on the associated framework layer name.Layer group depthwill group and color instructions at the selected layer depth. It will apply whenInstruction color groupis set to “Layer”.- Example:
When
Layer group depthis 2, instructions with layers model/layer1/op1 and model/layer1/op2 will be set to the same color.
Semaphore IDsallows for the selection of multiple semaphore values to show at once within the timeline
Additionally, there are various summary tabs that can be clicked to provide more information on the model/NEFFs.
Layer Summaryshows timing information, FLOPs and instructions counts per layer.Selection Summaryshows summarized information for all data points in the selected window when using the “Box Select” mode.NEFF Headershows details on the profiled NEFF, such as the number of NeuronCores required to execute.NEFF Nodesshows input, output, and weight tensor information, including name, size, and shape.Model Infoshows a summary of the NTFF, such as the NeuronCore the model was executed on, number of notifications, and hardware execution time.DMA Queues Infoshows more information on the queues used for data movement.NC Memory Usage Infoshows a snapshot of the device memory usage breakdown before profiling was started.Terminologyshows a description of metrics provided in the summary table.

Performance Warnings#
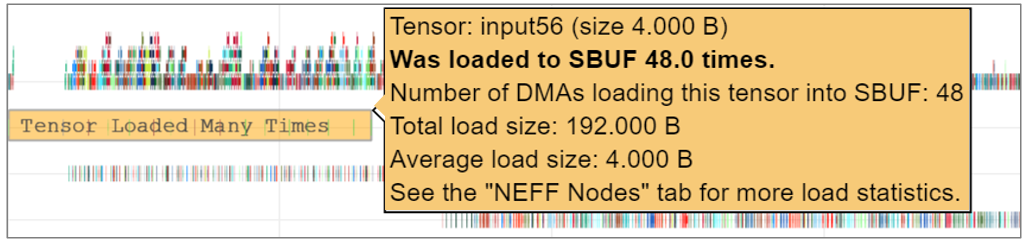
Furthermore, neuron-profile will automatically highlight some potential performance issues with warning annotations. For example if a tensor has been loaded more than 2 times a warning annotation (seen below as an orange box) will be drawn, encircling the dma instructions where the tensor was loaded many times.
Hover on the annotation to see more details about loading the tensor. Another kind of warning annotation will highlight areas of high throttling. This provides the user a potential reason for slow down (thermal protection). Specific throttling details are shown when hovering the annotation.
Collectives#
For models involving collective operations, the timeline will show a box around all data points related to each operation. Hovering the top left of the box will reveal more information associated with the operation.
Note
this feature requires profiles to be captured with Neuron Runtime 2.20 or higher.
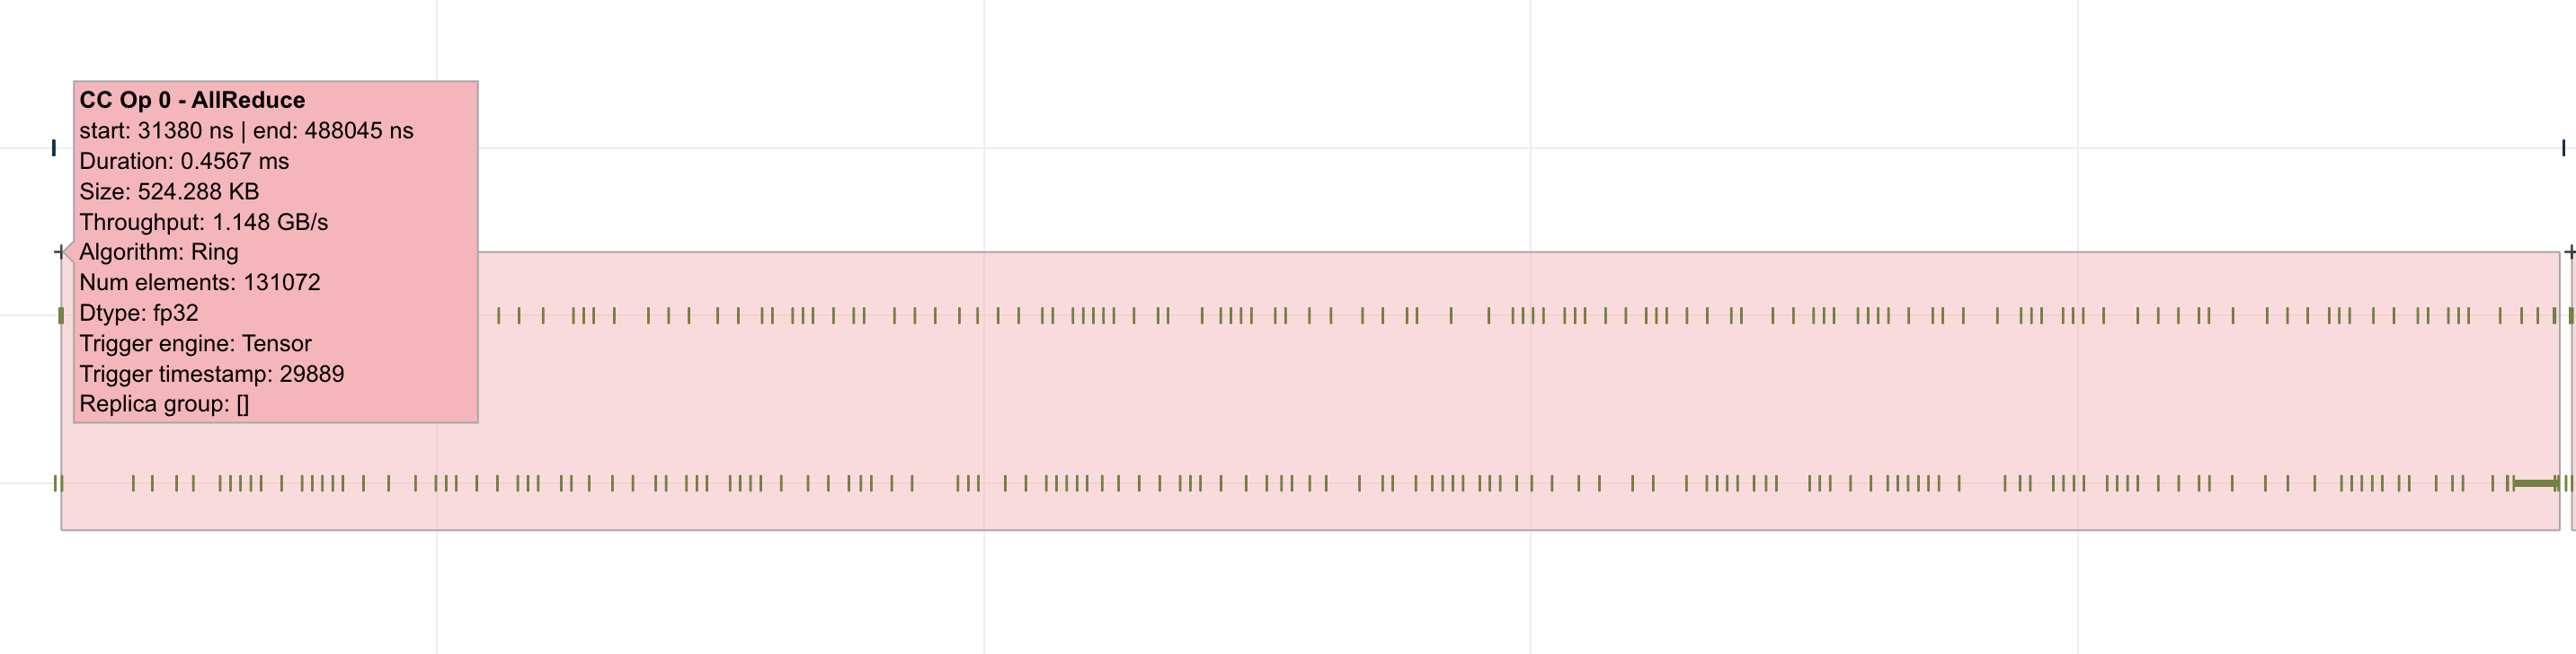
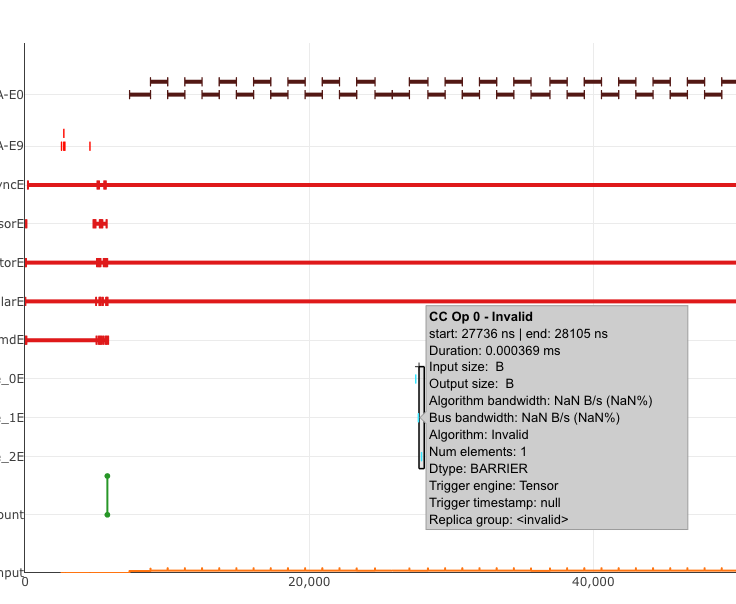
Additionally, for any on-device collectives synchronization barrier, a similar box will be display indicating a barrier instead of an actual collectives operation.
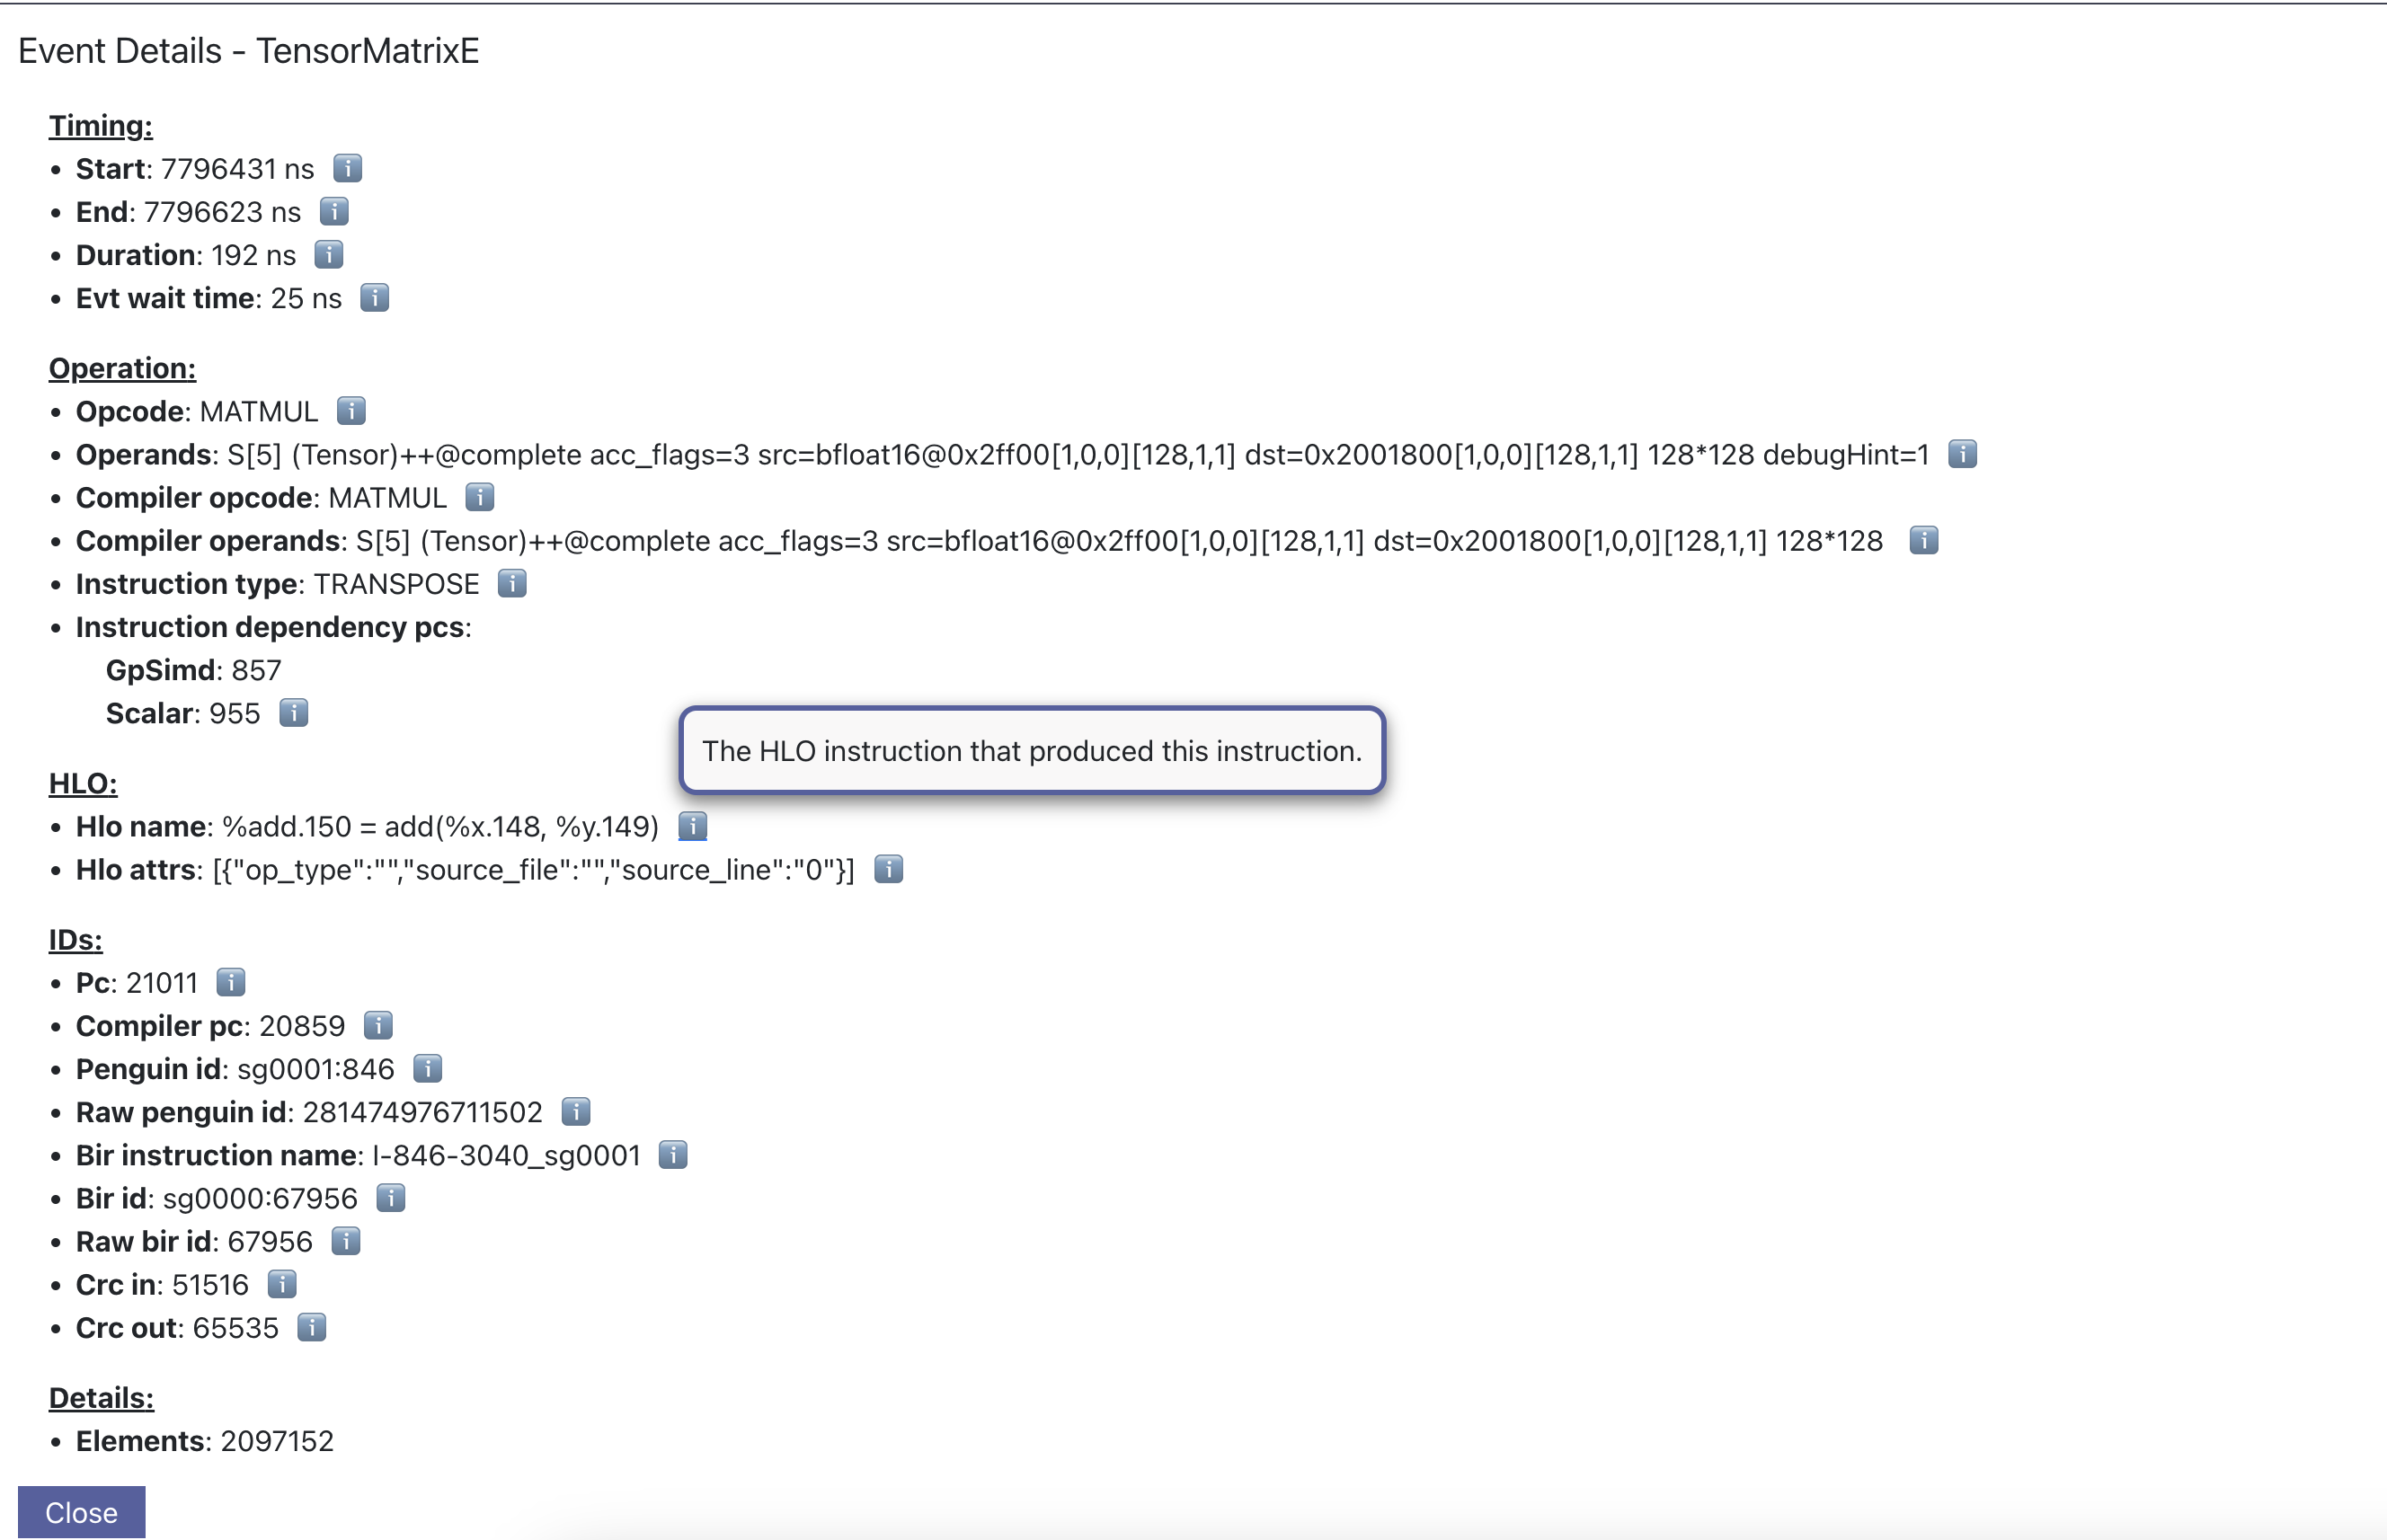
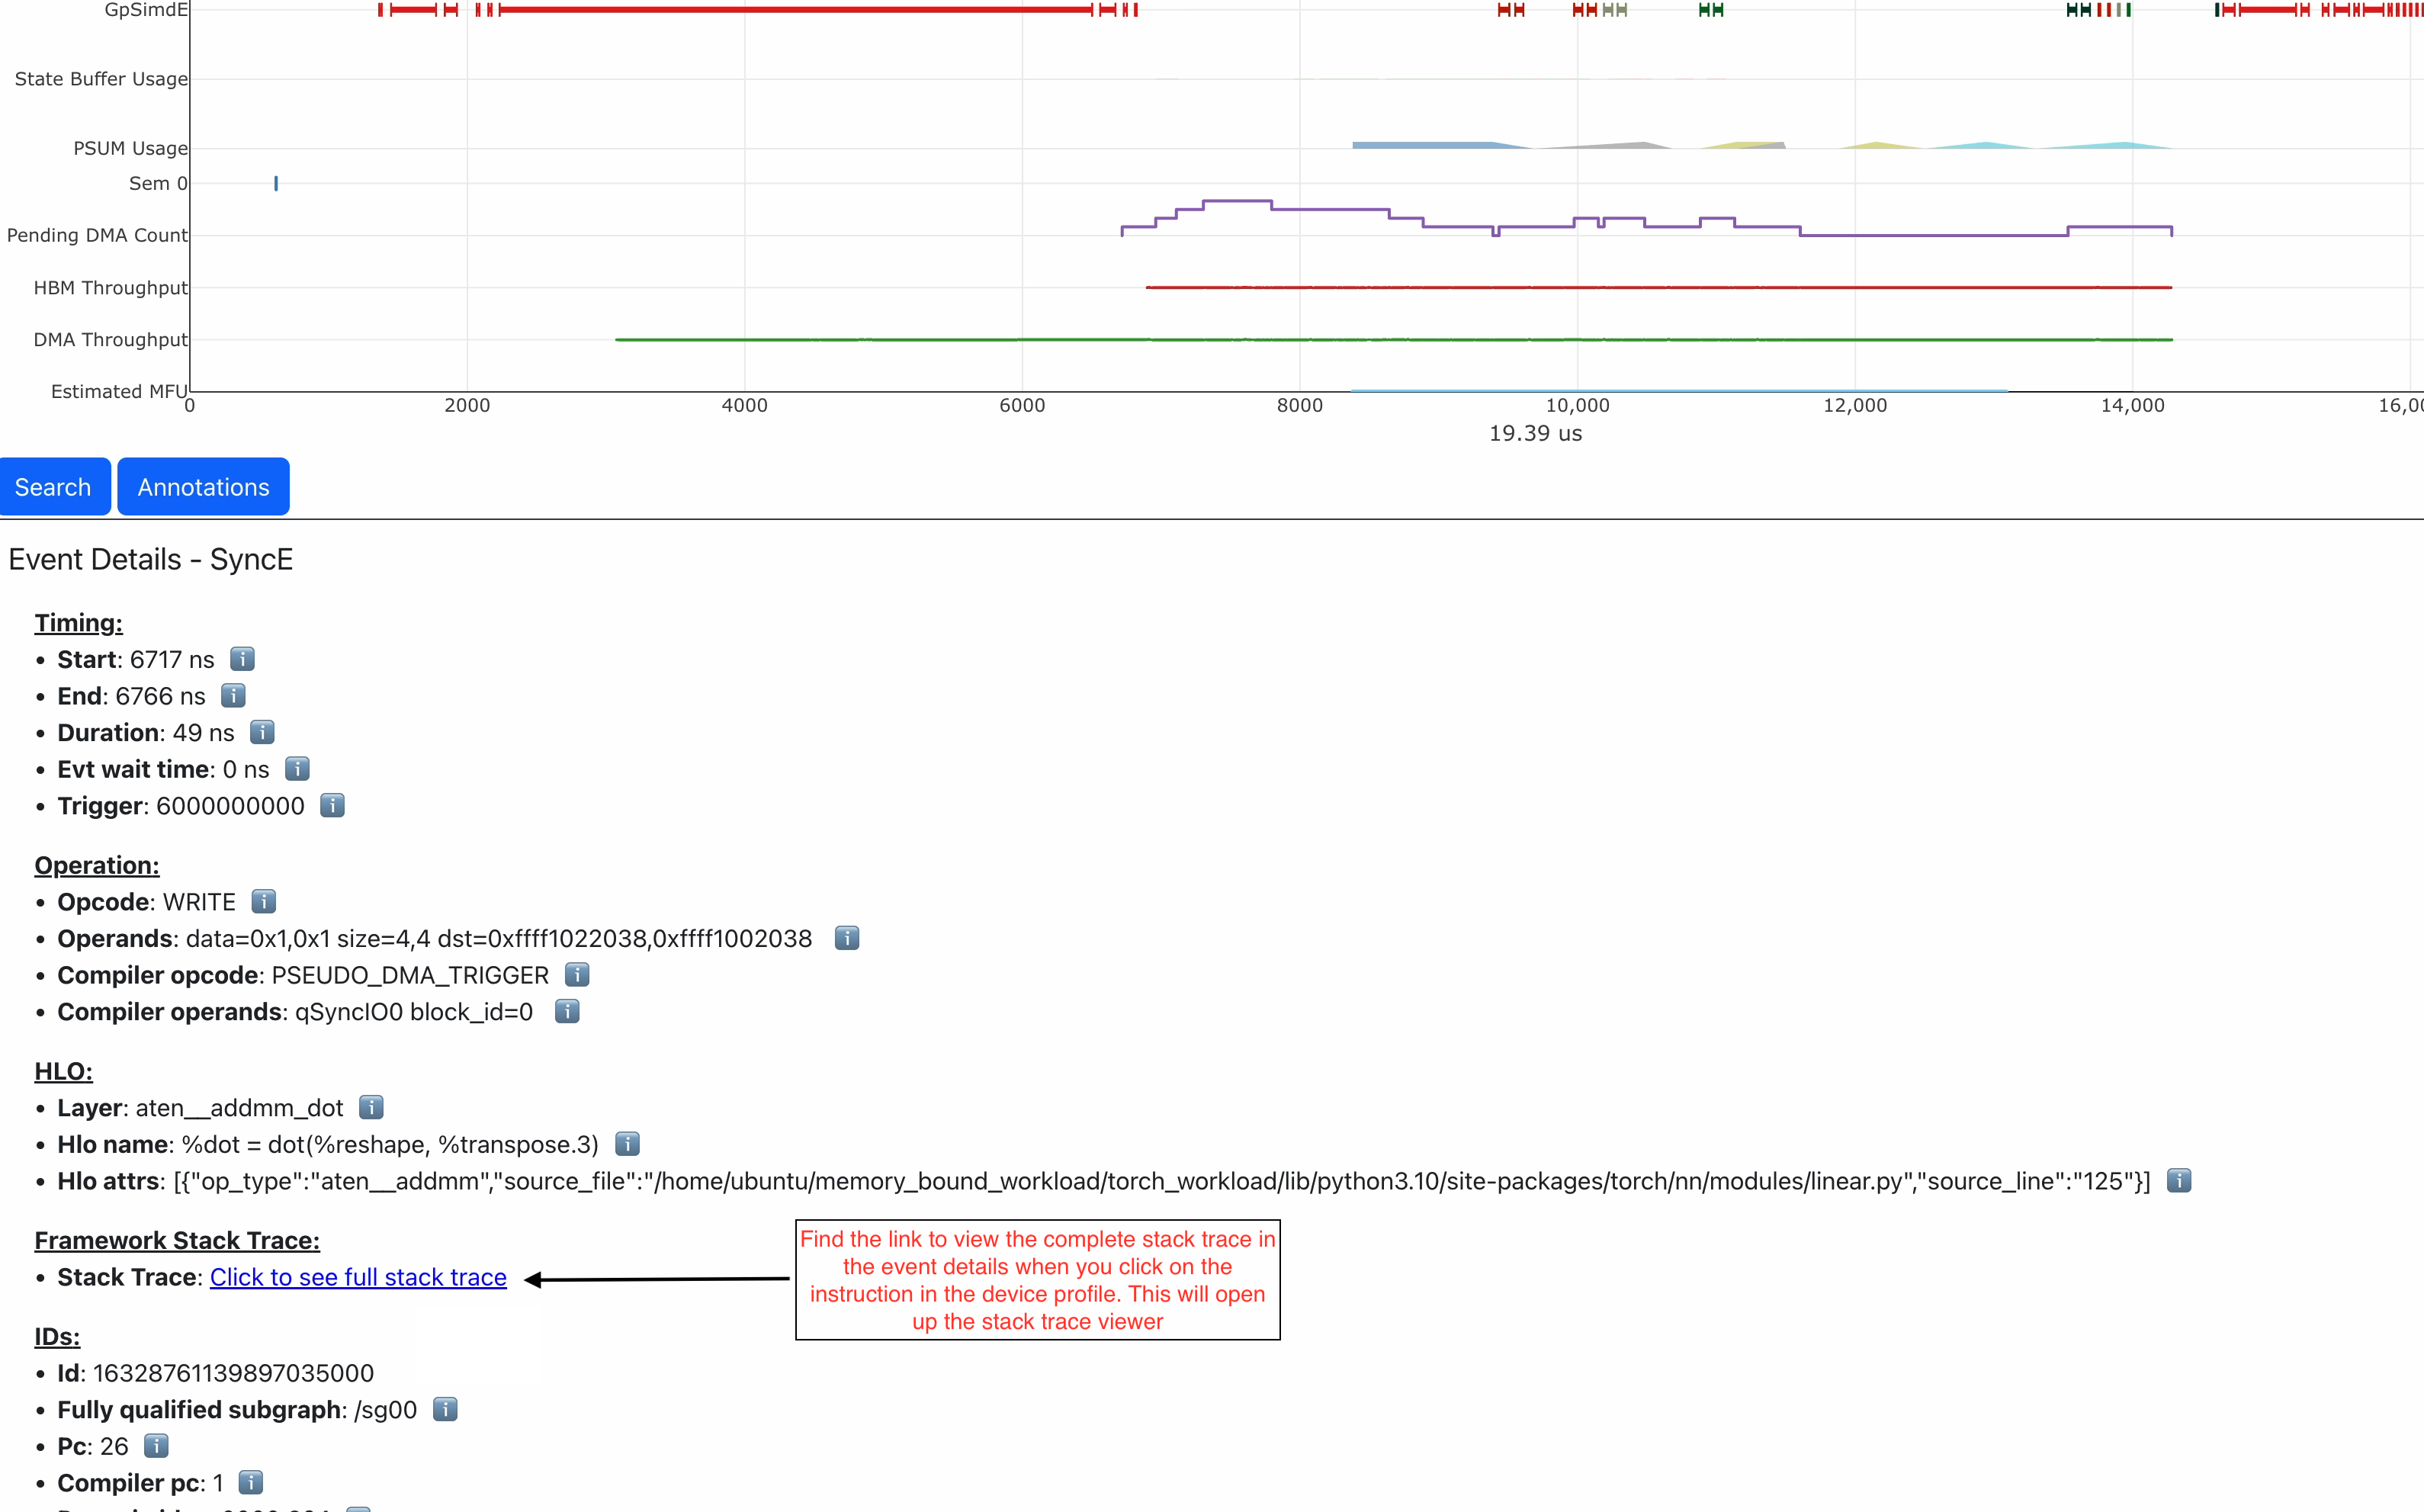
Event Details#
The information when a point is clicked is grouped by categories such as Timing or IDs for convenience. Each row will also include a tool tip on the right side, which can be hovered for an explanation on what the field represents. For instruction Operands specifically, clicking on the tooltip will reveal a breakdown of fields that compose an operand, as well as a generic example for reference. The examples may not apply directly to the currently viewed profile.
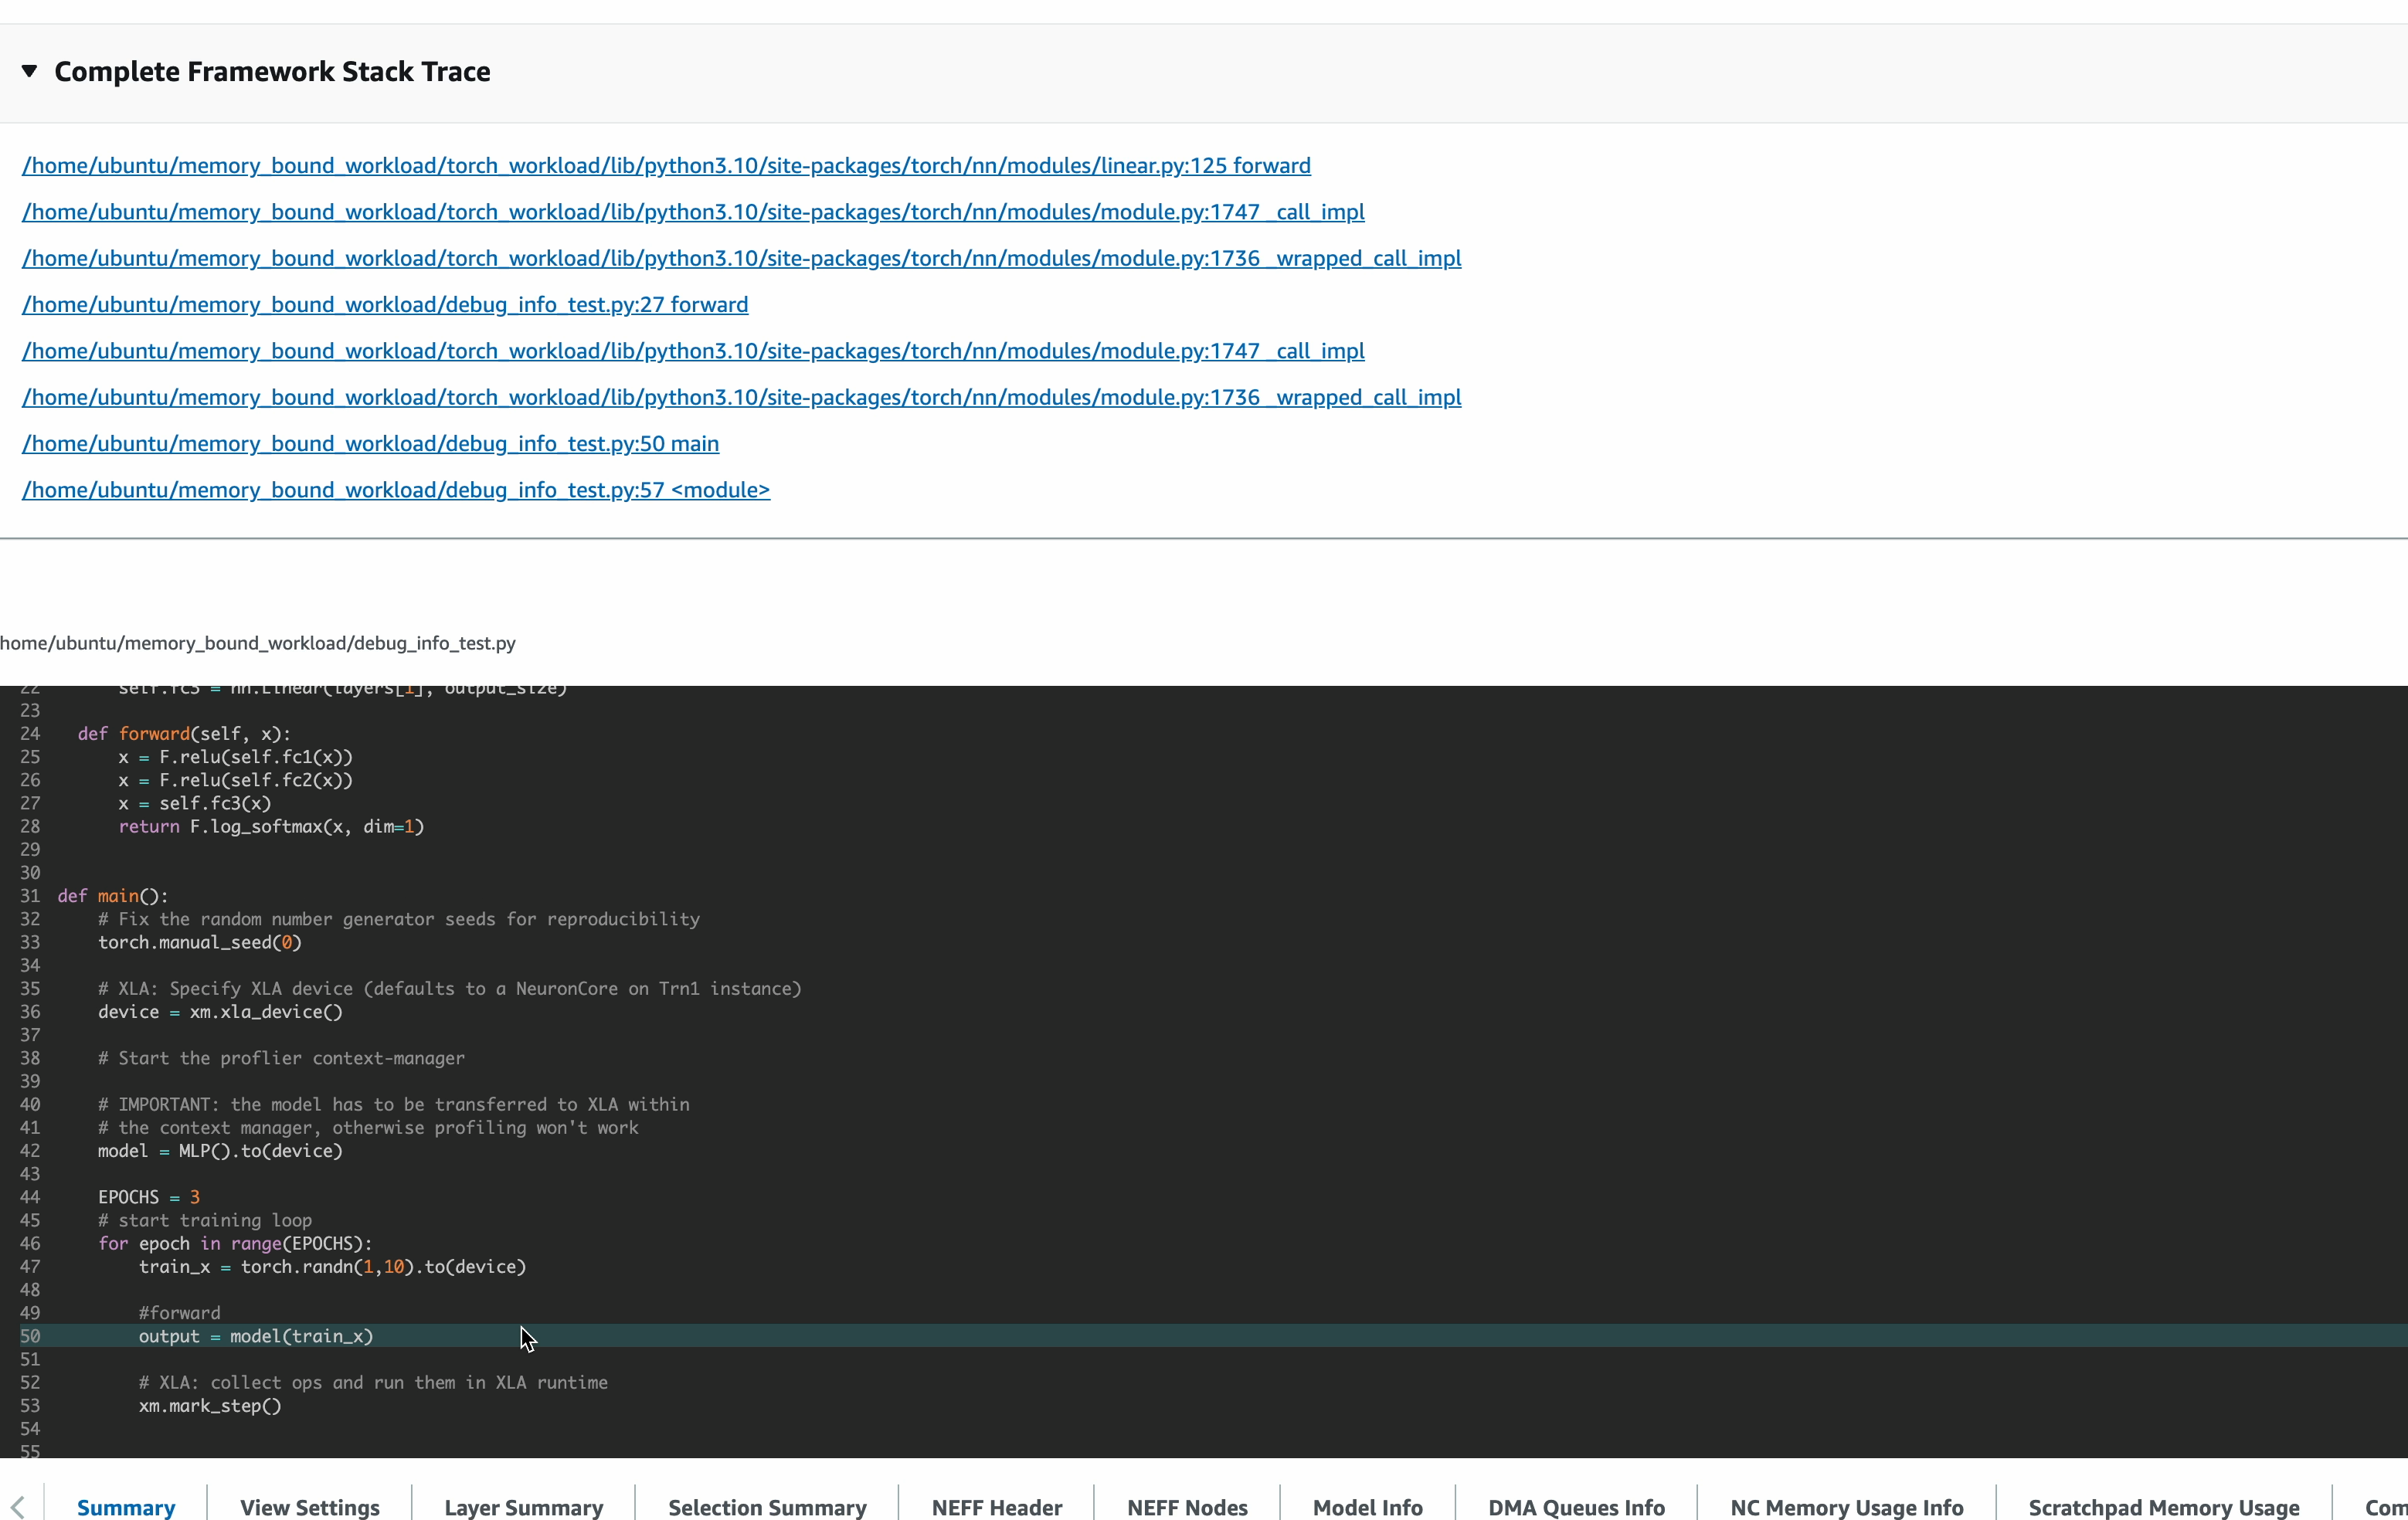
Framework Stack Trace#
The Framework Stack Trace feature shows up in the Event Details when an instruction on the device profile is clicked. This can we used to map the device instructions back to framework level code in JAX or PyTorch to better understand what part of the application code resulted in a particular device instruction.
To enable tracking of the stack trace information, you need to set environment variables before compiling your NEFF:
export XLA_IR_DEBUG=1
export XLA_HLO_DEBUG=1
Once you have the NEFF, you can simply capture the profile as usual. While viewing the profile use the --framework-source-root to pass the path to framework source files. This is optional and is only needed if you want to view your code along side the profile.
$ neuron-profile view -n file.neff -s profile.ntff --framework-source-root /path/to/framework/source/files
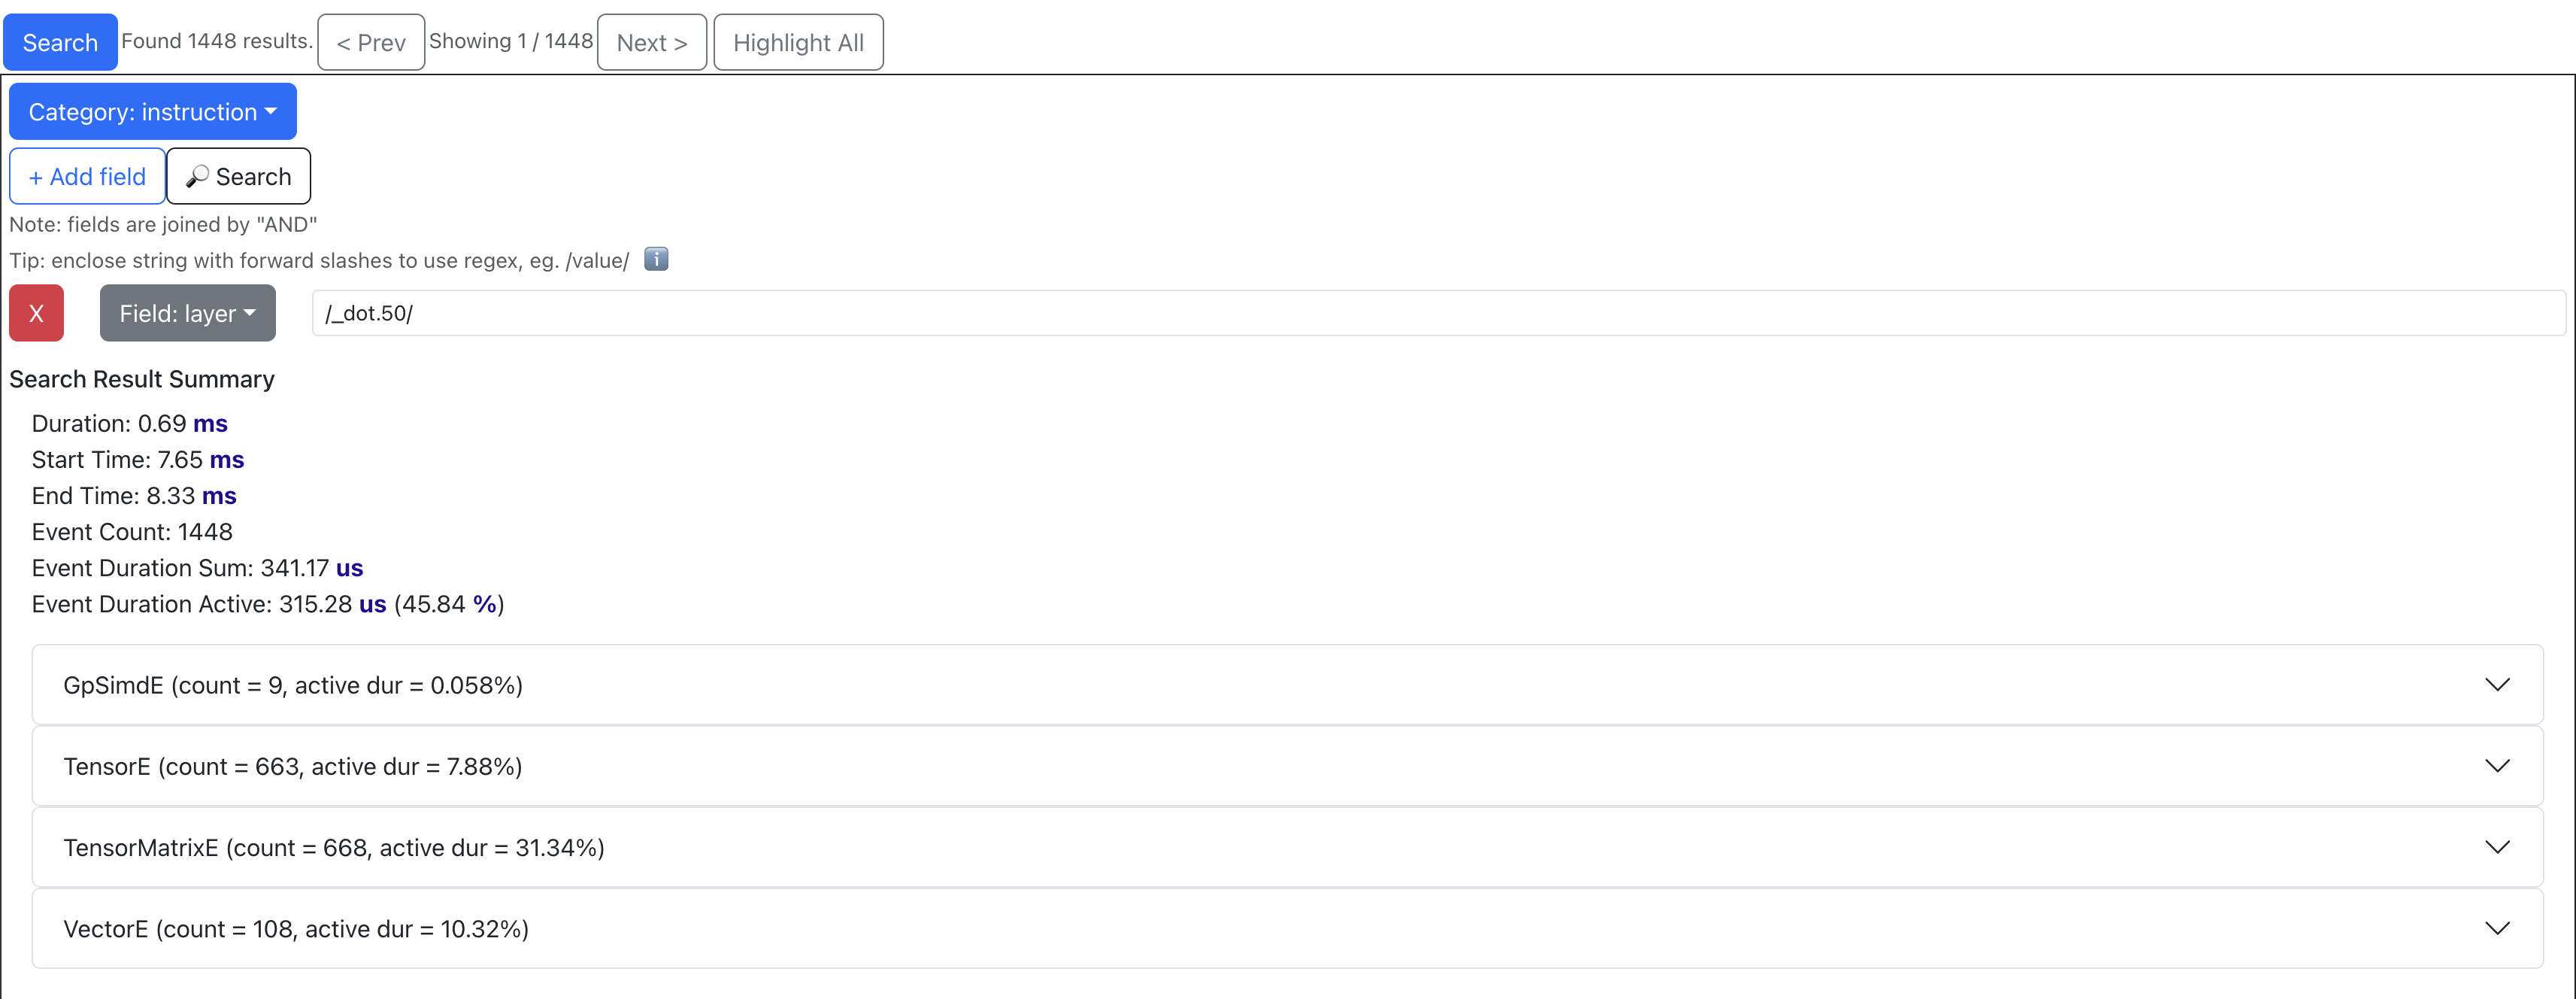
Searching Profiles#
Searching helps identify specific data points that may be worth investigating, such as all instructions related to a specific layer or operation. In the “Search” tab, select the corresponding field of interest and enter the value to search for. Multiple fields can be searched together. Please refer to the tooltip within the tab for more help on the query syntax. The search results will also include a summary of all data points found within the current time range.
Hardware Errors#
Invalid code can lead to errors on Neuron hardware. These errors will be displayed in Neuron Profile’s Custom Notification timeline, as shown below. For example an Out of Bounds (OOB) error is displayed as:
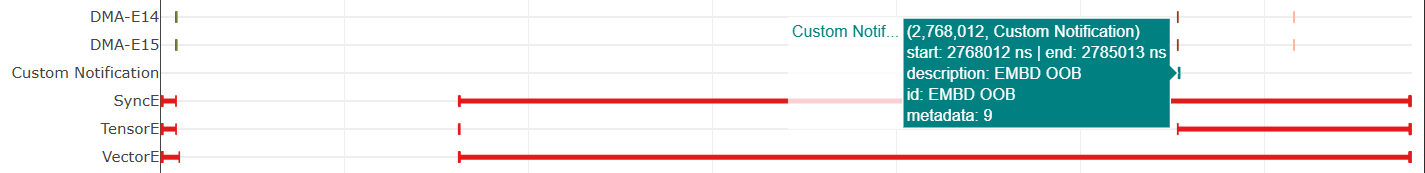
Users can correlate the error to the time it occurred and view nearby events to help debug.
View Scratchpad Usage With Memory Tracker#
The Memory Tracker feature in Neuron Profiler provides detailed insights into scratchpad memory usage over time, showing how memory is allocated and utilized by different tensors during model execution. This is particularly useful for understanding memory bottlenecks and optimizing memory usage patterns.
To enable Memory Tracker, you need to set environment variables before compiling your NEFF:
export XLA_IR_DEBUG=1
export XLA_HLO_DEBUG=1
Then compile your model with these debug flags enabled. After compilation, capture the profile with the --enable-dge-notifs flag or set NEURON_RT_ENABLE_DGE_NOTIFICATIONS=1:
$ neuron-profile capture -n file.neff --enable-dge-notifs
Finally, view the profile with Memory Tracker enabled:
$ neuron-profile view -n file.neff -s profile.ntff --enable-memory-tracker
The Memory Tracker displays a timeline showing scratchpad memory usage over time, with a detailed breakdown of which tensors are consuming memory at any given point. This visualization helps identify:
Peak scratchpad memory usage
Memory allocation patterns
Tensor-specific memory consumption
Potential memory optimization opportunities
![]()
You can interact with the Memory Tracker timeline similar to other profile views - clicking on memory usage bars will show detailed information about the tensors using memory at that time, and you can zoom in to specific time ranges to get a more detailed view of memory allocation patterns.
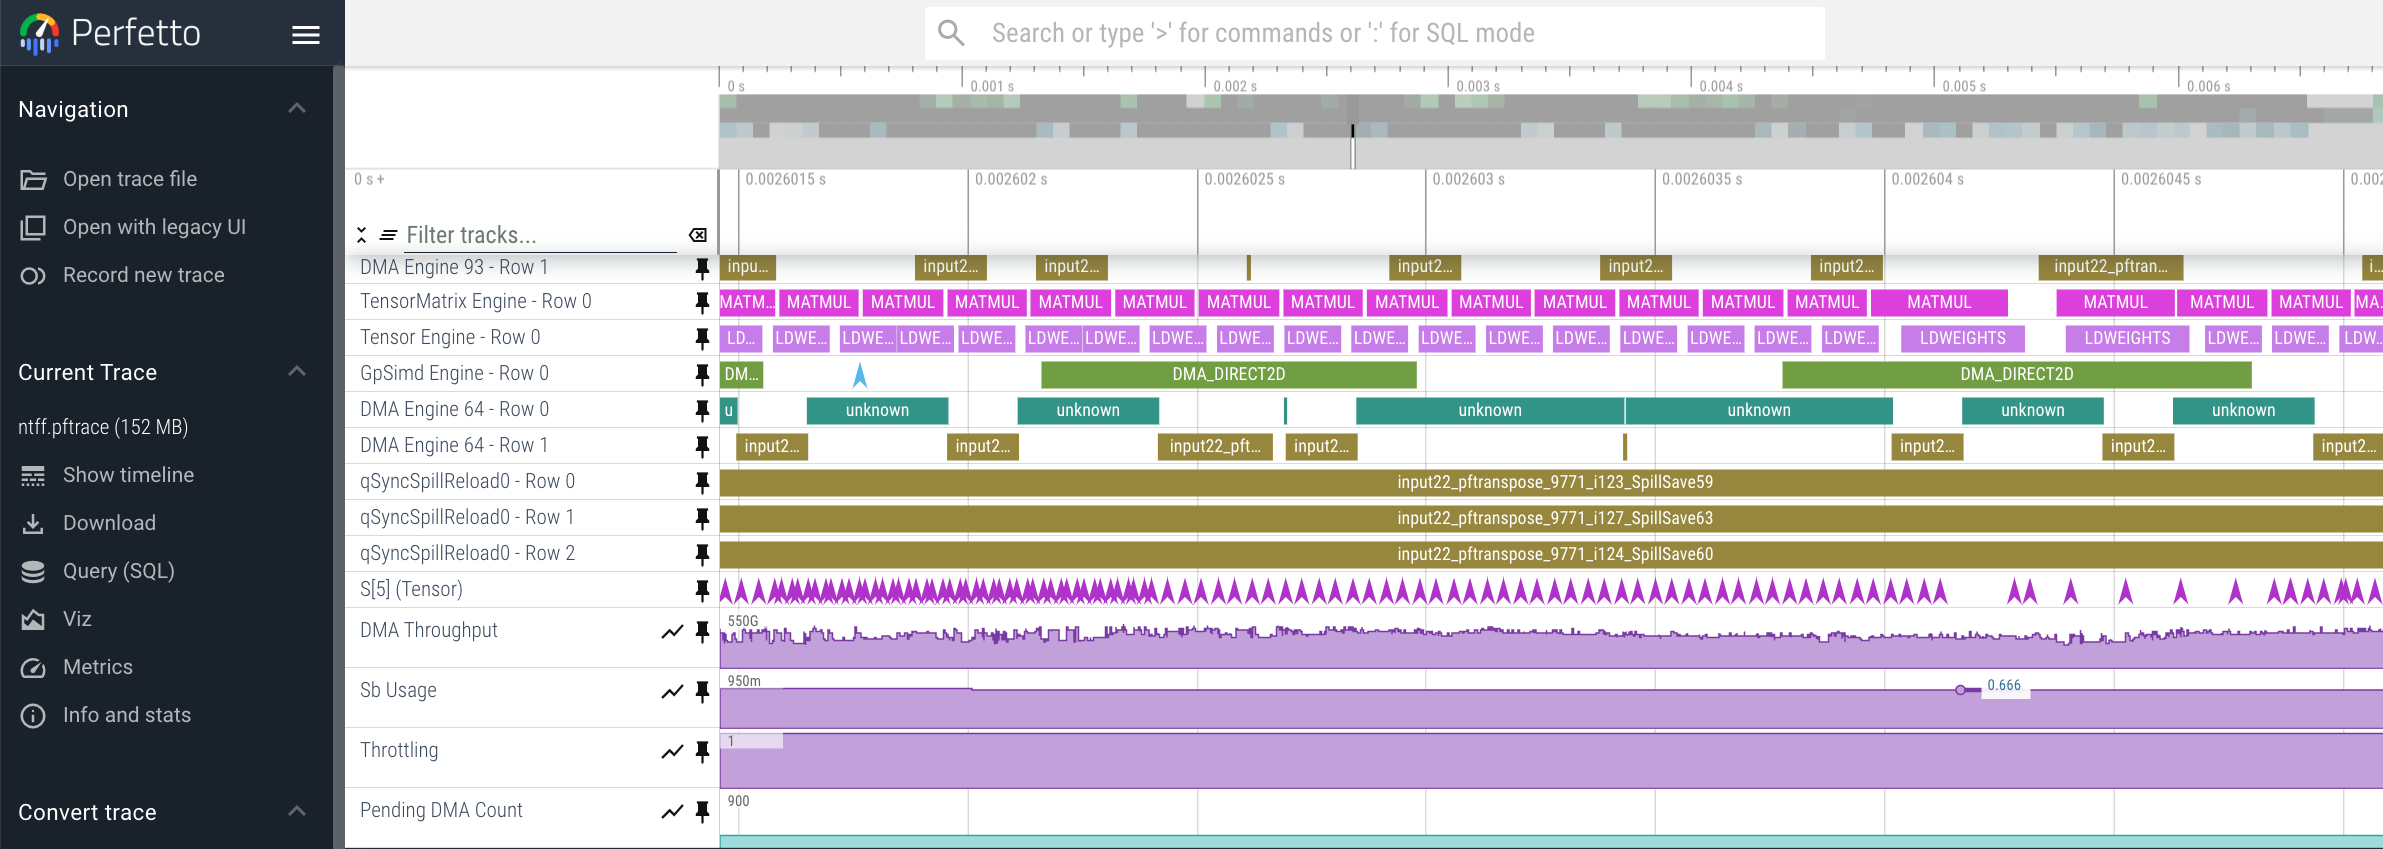
Viewing Profiles with Perfetto#
Perfetto is an open-source trace analysis toolkit with a powerful UI for visualizing and analyzing trace data. Users of Neuron Profiler have the option of viewing their profiles in the Perfetto UI.
To process your profile and generate a Perfetto trace file that can be viewed in the Perfetto UI run the following command:
$ neuron-profile view -n file.neff -s profile.ntff --output-format perfetto
This will generate a ntff.pftrace file. Go to https://ui.perfetto.dev/ in your browser and open the ntff.pftrace file to view your profile in Perfetto.
Note
When loading trace files in the Perfetto UI, your data is processed locally and not uploaded to Perfetto’s servers.
Viewing Large Profiles In Perfetto#
Your browser may run out of memory when viewing ntff.pftrace (Perfetto trace) files that are more than a few hundred MB.
To get around this problem you can use the trace processor script by running the following command on your local system where you wish to view the profile
curl -LO https://get.perfetto.dev/trace_processor
chmod +x ./trace_processor
./trace_processor --httpd ntff.pftrace
Now go to https://ui.perfetto.dev/ in your browser and in the dialog box that pops up click the “YES, use loaded trace” button.
For more information on using the trace processor script and viewing large traces, please refer to the Perfetto documentation at https://perfetto.dev/docs/visualization/large-traces.
Showing Dependencies In Perfetto#
By default Neuron Profiler does not process dependencies for profiles to be viewed in Perfetto because Perfetto renders
the full dependency chain which can be visually overwhelming. To include dependencies that can be viewed when clicking
instructions and DMAs in the Perfetto UI, use the --show-perfetto-flows flag when processing your profile.
$ neuron-profile view -n file.neff -s profile.ntff --output-format perfetto --show-perfetto-flows
CLI reference#
neuron-profile capture
neuron-profile capture
neuron-profile capture [parameters] [inputs...]
Takes a given compiled NEFF, executes it, and collects the profile results.
When no inputs are provided, all-zero inputs are used, which may result in inf or NaNs.
It is recommended to use --ignore-exec-errors.
Parameters
-n, --neff(string)The compiled NEFF to profile.
-s, --session-file(string)The file to store profile session information in.
--ignore-exec-errorsIgnore errors during execution.
inputs(positional args)List of inputs in the form of
<NAME> <FILE_PATH>separated by space. For example:IN1 x.npy IN2 y.npy.
The following neuron-profile capture arguments are only relevant for multi-worker jobs:
-m, --multi-input(string)Path to a file that describes the input list for each requested worker. Each line in the file should correspond to one worker and follow the same format as the
inputspositional argument (i.e.<NAME> <FILE_PATH>pairs separated by spaces). Cannot be used together with theinputspositional argument. Ifinputsis used instead, all workers will use the same inputs.--collectives-profile-id(string)Worker id which will be profiled. Passing
allprofiles all workers. (default:all)-r, --collectives-workers-per-node(int)The number of workers on the current node. The global worker id (rank) of worker n on current node is
collectives-worker-start-id+n.--collectives-worker-count(int)Total number of Neuron workers across all nodes for this collectives run.
--collectives-worker-start-id(int)The rank offset for the first worker on the current node. For example, if node 0 has workers 0,1 and node 1 has workers 2,3 then
collectives-worker-start-idfor node 0 and 1 will be 0 and 2, respectively. (default:0)
neuron-profile view
neuron-profile view [parameters]
Parameters
-n, --neff-path(string)The compiled NEFF file location.
-s, --session-file(string)The profile results NTFF file location.
-d, --session-dir(string)Directory containing profile files for multi-worker runs.
--output-format(string)How the processed profile should be presented. The default
dbwrites processed data to the database.summary-textandsummary-jsonprint the summary data as a table or json, respectively, without writing to the database. Theperfettooption writes processed data to Perfetto’s native protobuf based tracing format, and can be visualized in the Perfetto UI. TheJSONoption writes processed data to human-readable JSON. (default:db)--output-file(string)File path to write results to, if applicable for the given output format.
--db-endpoint(string)The endpoint of InfluxDB. (default:
http://localhost:8086)--db-org(string)The org name of InfluxDB.
--db-bucket(string)Name of the InfluxDB bucket where ingested profile data is stored. Also used in the URL for viewing the profile. (Optional)
--port(int)The port number of the http server. (default:
3001)--forceForce overwrite an existing profile in the database.
--terminologyPrint a helpful table of terminology used by the profiler.
--enable-memory-trackerEnable Memory Tracker to view scratchpad usage over time with a breakdown of usage per tensor. This requires having set
XLA_IR_DEBUG=1andXLA_HLO_DEBUG=1before NEFF compilation and passing--enable-dge-notifswhen capturing the profile.
FAQ#
Difference between TensorE and TensorMatrixE Rows in Timeline#
TensorE includes instruction trace for LoadStationary (LoadWeight)
TensorMatrixE includes instruction trace for MultiplyMoving (Matmul)
Both instruction traces happen on the same TensorE engine, but we separate them into two rows to de-clutter the timeline due to the background load stationary feature (loading stationary matrix for the next matmul in parallel to current matmul). See more info in NKI architecture guide.
Out of memory (OOM) when capturing a profile#
If neuron-profile capture fails due to device out-of-memory (OOM), you can increase available memory using using the single-IO mode:
Single-IO creates one shared I/O buffer on the device equal to the size of the largest I/O tensor. All inputs and outputs then point to slices of this shared buffer instead of allocating separate tensors. This significantly lowers the device memory needed during capture at the cost of producing incorrect outputs.
Example usage:
neuron-profile capture --single-io -n file.neff -s profile.ntff
Important: with --single-io, the profiled performance characteristics (e.g., timing, utilization, bandwidth) are representative, but the model outputs are intentionally not correct. Use this option only to get accurate performance measurements when device memory is tight; do not use it for correctness/accuracy validation.
If you are able to make changes to your model itself to reduce memory usage, consider the following: - Reduce batch size - Lower numerical precision - Reduce number of layers
In some cases, a full device profile isn’t necessary to understand performance at a high level. You can instead capture a system profile, which shows overall model execution time and a runtime API trace across all workers and does not require extra device memory. See System Profiles overview.
Troubleshooting#
Outputting to Unsupported NumPy Data Type#
When running neuron-profile capture --save-output-npy, you may encounter an error if the output tensor uses a data type that NumPy doesn’t natively support:
failed to save output output_hbm to file: unsupported type for npy output: bfloat16
To work around this, use --save-output instead to save the output as raw binary, then convert it to the desired data type using NumPy and the ml_dtypes library.
This preserves the precision of the output since it is written to binary instead of casting to a supported data type.
# Capture with raw binary output
neuron-profile capture --save-output -n file.neff

# Convert from raw binary to bfloat16
import numpy as np
import ml_dtypes

output = np.fromfile('output0.npy', dtype=np.uint16)
output = output.view(ml_dtypes.bfloat16)
InfluxDB not installed#
$ neuron-profile view -n file.neff -s profile.ntff
ERRO[0001] To install influxdb, go to https://portal.influxdata.com/downloads/ and follow the instructions there
influxdb not setup correctly: exec: "influx": executable file not found in $PATH
$ neuron-profile view -n file.neff -s profile.ntff
ERRO[0000]
influxdb token not setup correctly: exit status 1
Try executing "systemctl start influxdb" and "influx setup"
Running neuron-profile view without InfluxDB installed will result in an error and a pointer to the InfluxDB installation instructions.
Please follow the provided instructions and retry.
Too many open files#
influxdb2client E! Write error: internal error: unexpected error writing points to database: [shard 10677] open /home/ubuntu/.influxdbv2/engine/data/7caae65aaa48380d/autogen/10677/index/0/MANIFEST: too many open files
InfluxDB will encounter “too many open files” and out of memory errors after a few hundred buckets have been created. Two ways to solve this are to delete unused buckets or increase the system file descriptor limit.
To increase the file descriptor limit, add the following lines to /etc/security/limits.d/efa.conf and /etc/security/limits.conf:
*               soft    nofile      1048576
*               hard    nofile      1048576
Add the following lines to /etc/sysctl.conf
fs.file-max = 197341270
vm.max_map_count=1048576
Commit changes by running sudo sysctl -p.
When viewing UI “FATAL - Failed metadata query”#
If you are SSH port forwarding the web UI from a remote machine to your local desktop you will need to port forward both the web UI (3001) and the database (8086) like so:
ssh -L 3001:localhost:3001 -L 8086:localhost:8086 remote_machine
Visual Artifacts when viewing profiles#
Some users have reported visual artifacts when viewing certain profiles in browsers other than Chrome. If you encounter this issue, please try using Chrome. For more details, refer to the GitHub issue: aws-neuron/aws-neuron-sdk#1033
This document is relevant for: Inf1, Inf2, Trn1, Trn2, Trn3