
This document is relevant for: Inf2, Trn1, Trn2
Neuron Distributed Event Tracing (NDET) User Guide#
Note
Neuron DET is no longer supported as of Neuron 2.22.0 release. All customers using the NDET tool for debugging runtime hangs/issues in large-scale settings should transition to the Neuron Profiler 2.0. This tool offers the same runtime function level traces with improved ease of use and optimized performance. For more information on Neuron Profiler 2.0, please refer to the Neuron Profiler 2.0 (Beta) User Guide.
Overview#
The Neuron Distributed Event Tracing (NDET) tool neuron-det aggregates Neuron execution trace logs and visualizes
events leading up to a failure. It is intended to help diagnose errors
when running multi-node workloads by surfacing known software or hardware issues.
Note
neuron-det requires aws-neuronx-runtime-lib and aws-neuronx-tools from Neuron SDK 2.16 or above.
Note
Enabling the tracing will impact performance. It is recommended to enable this for debug purposes only.
Using neuron-det#
When the execution tracing is enabled, running a workload will generate additional logs at an
interval, which can later be post-processed by neuron-det.
Logging is controlled via the following environment variables:
Argument |
Default value |
Description |
|---|---|---|
|
|
Contols the frequency at which these logs are flushed. Setting this to a non-zero value will enable the logging. |
|
|
Path to an existing directory where logs will be written. |
|
|
The number of events to keep in the buffer for context. |
These are generated on a per-process basis, ie. two processes will generate two separate log files. With the default settings, each log will be up to 20MB.
After collecting the logs, running neuron-det will attempt to determine the underlying issue (if any).
If the model executed to completion without errors, running neuron-det would show no errors detected ✓.
Otherwise, when an error is detected, a message would be printed to the console with extra information, for example
numerical_error (X) NC 0 @ 11762897.0 - 11906423.0: {'nd': 0, 'nc': 0, 'exec_id': 0}.
* numerical_error is to the type of event.
* X is a “complete” event (see trace event format for details). Non complete events likely indicate a hang.
* NC 0 is the NeuronCore which the model is being executed on.
* 11762897.0 - 11906423.0 are the start and end timestamps of the event.
* {'nd': 0, 'nc': 0, 'exec_id': 0} are the extra details associated with this event.
neuron-det will also generate a JSON file which can be loaded and viewed as a chrome-trace by navigating to chrome://tracing
in the Chrome browser.
CLI arguments#
Argument |
Default value |
Description |
|---|---|---|
|
N/A, required argument |
The directory or prefix where the NDET logs are stored |
|
|
Output file location of the chrome-trace JSON |
|
N/A |
Filtering based on the rank number for Collective Communication |
|
false |
Draw arrows between certain events in the chrome-trace for easier backtracking |
Example usage#
export NEURON_RT_DBG_NDET_FLUSH_USEC=5000000
export NEURON_RT_DBG_NDET_LOG_LOCATION=ndet
mkdir -p $NEURON_RT_DBG_NDET_LOG_LOCATION
python app.py
neuron-det --log-prefix $NEURON_RT_DBG_NDET_LOG_LOCATION -o trace.json
Example output#
The following is collected from running the ParallelCluster BERT example on two nodes with NDET enabled.
After executing this model, there will be a few ndet_* files present in the directory specified earlier.
From here, we can execute neuron-det --log-prefix $NEURON_RT_DBG_NDET_LOG_LOCATION/ndet -o trace.json.
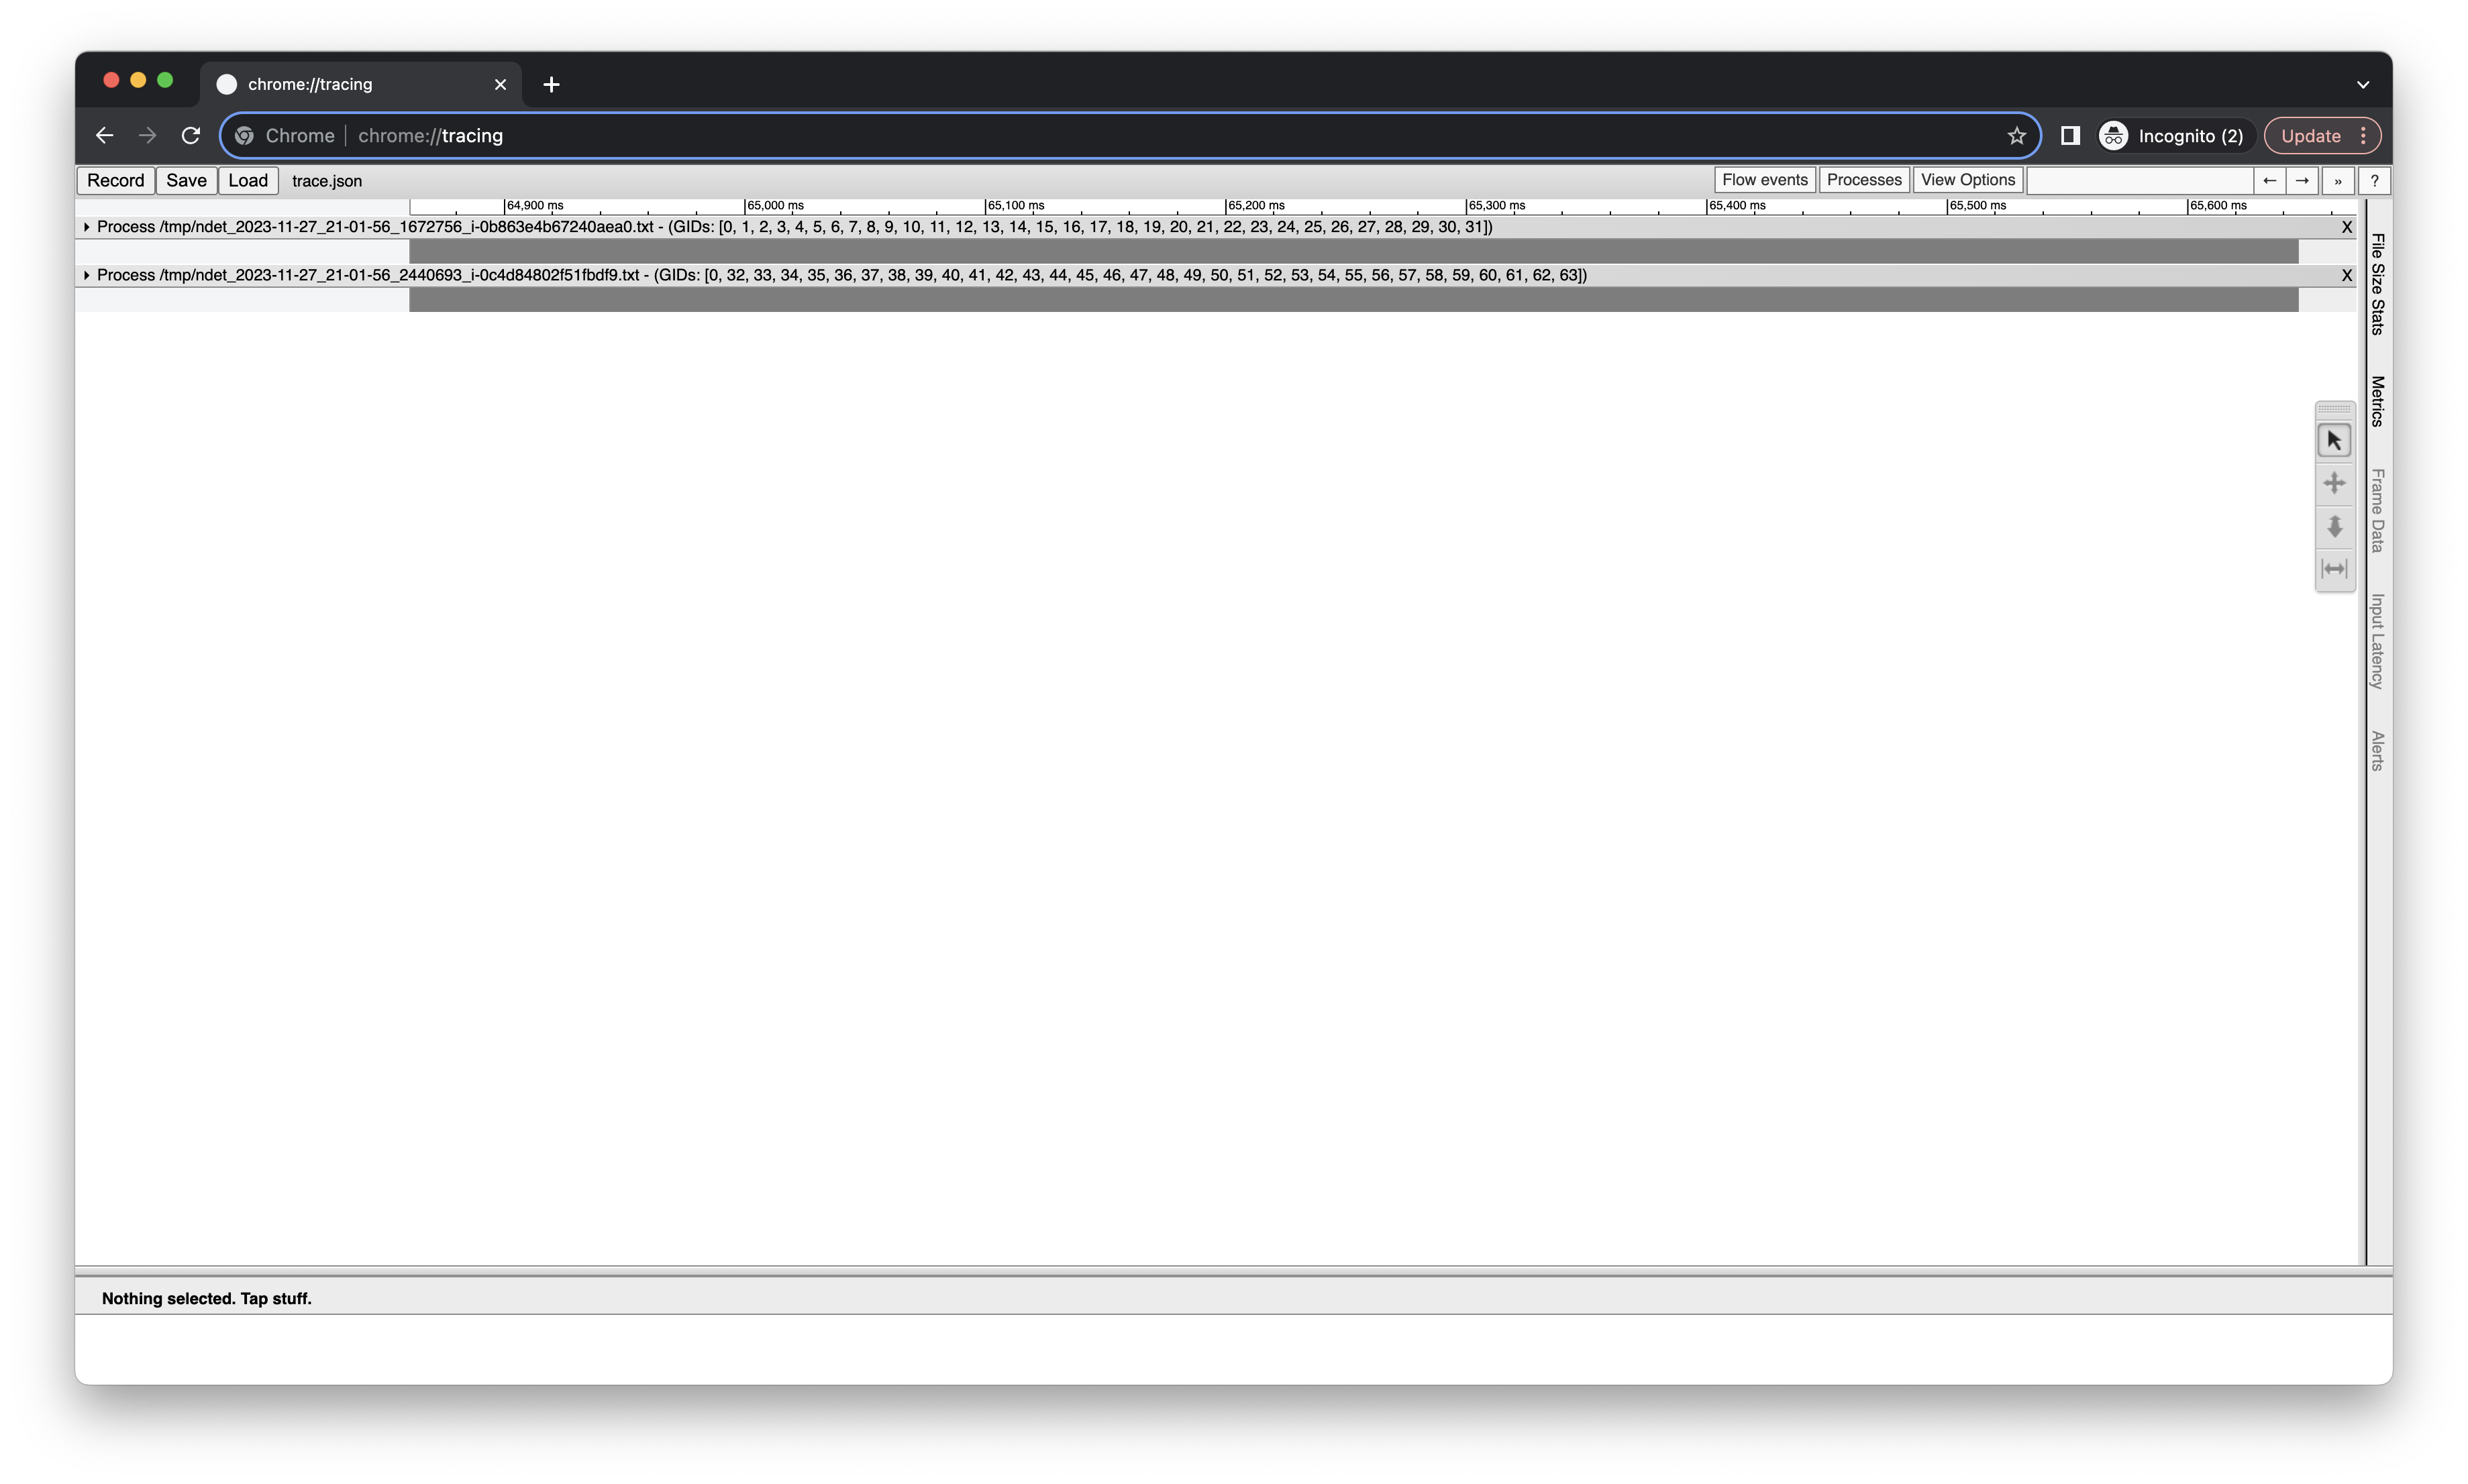
In this example, since we used two nodes, we would see two separate processes in the chrome trace. Each would process has the corresponding file name that the data comes from, which includes the date and time when the tracing started, the instance ID, and the replica group IDs (GIDs) used for collective communication.
Generally the application will either complete successfully, or stop after encountering an error. Thus it would be a good idea to start by inspecting the tail end of the trace.
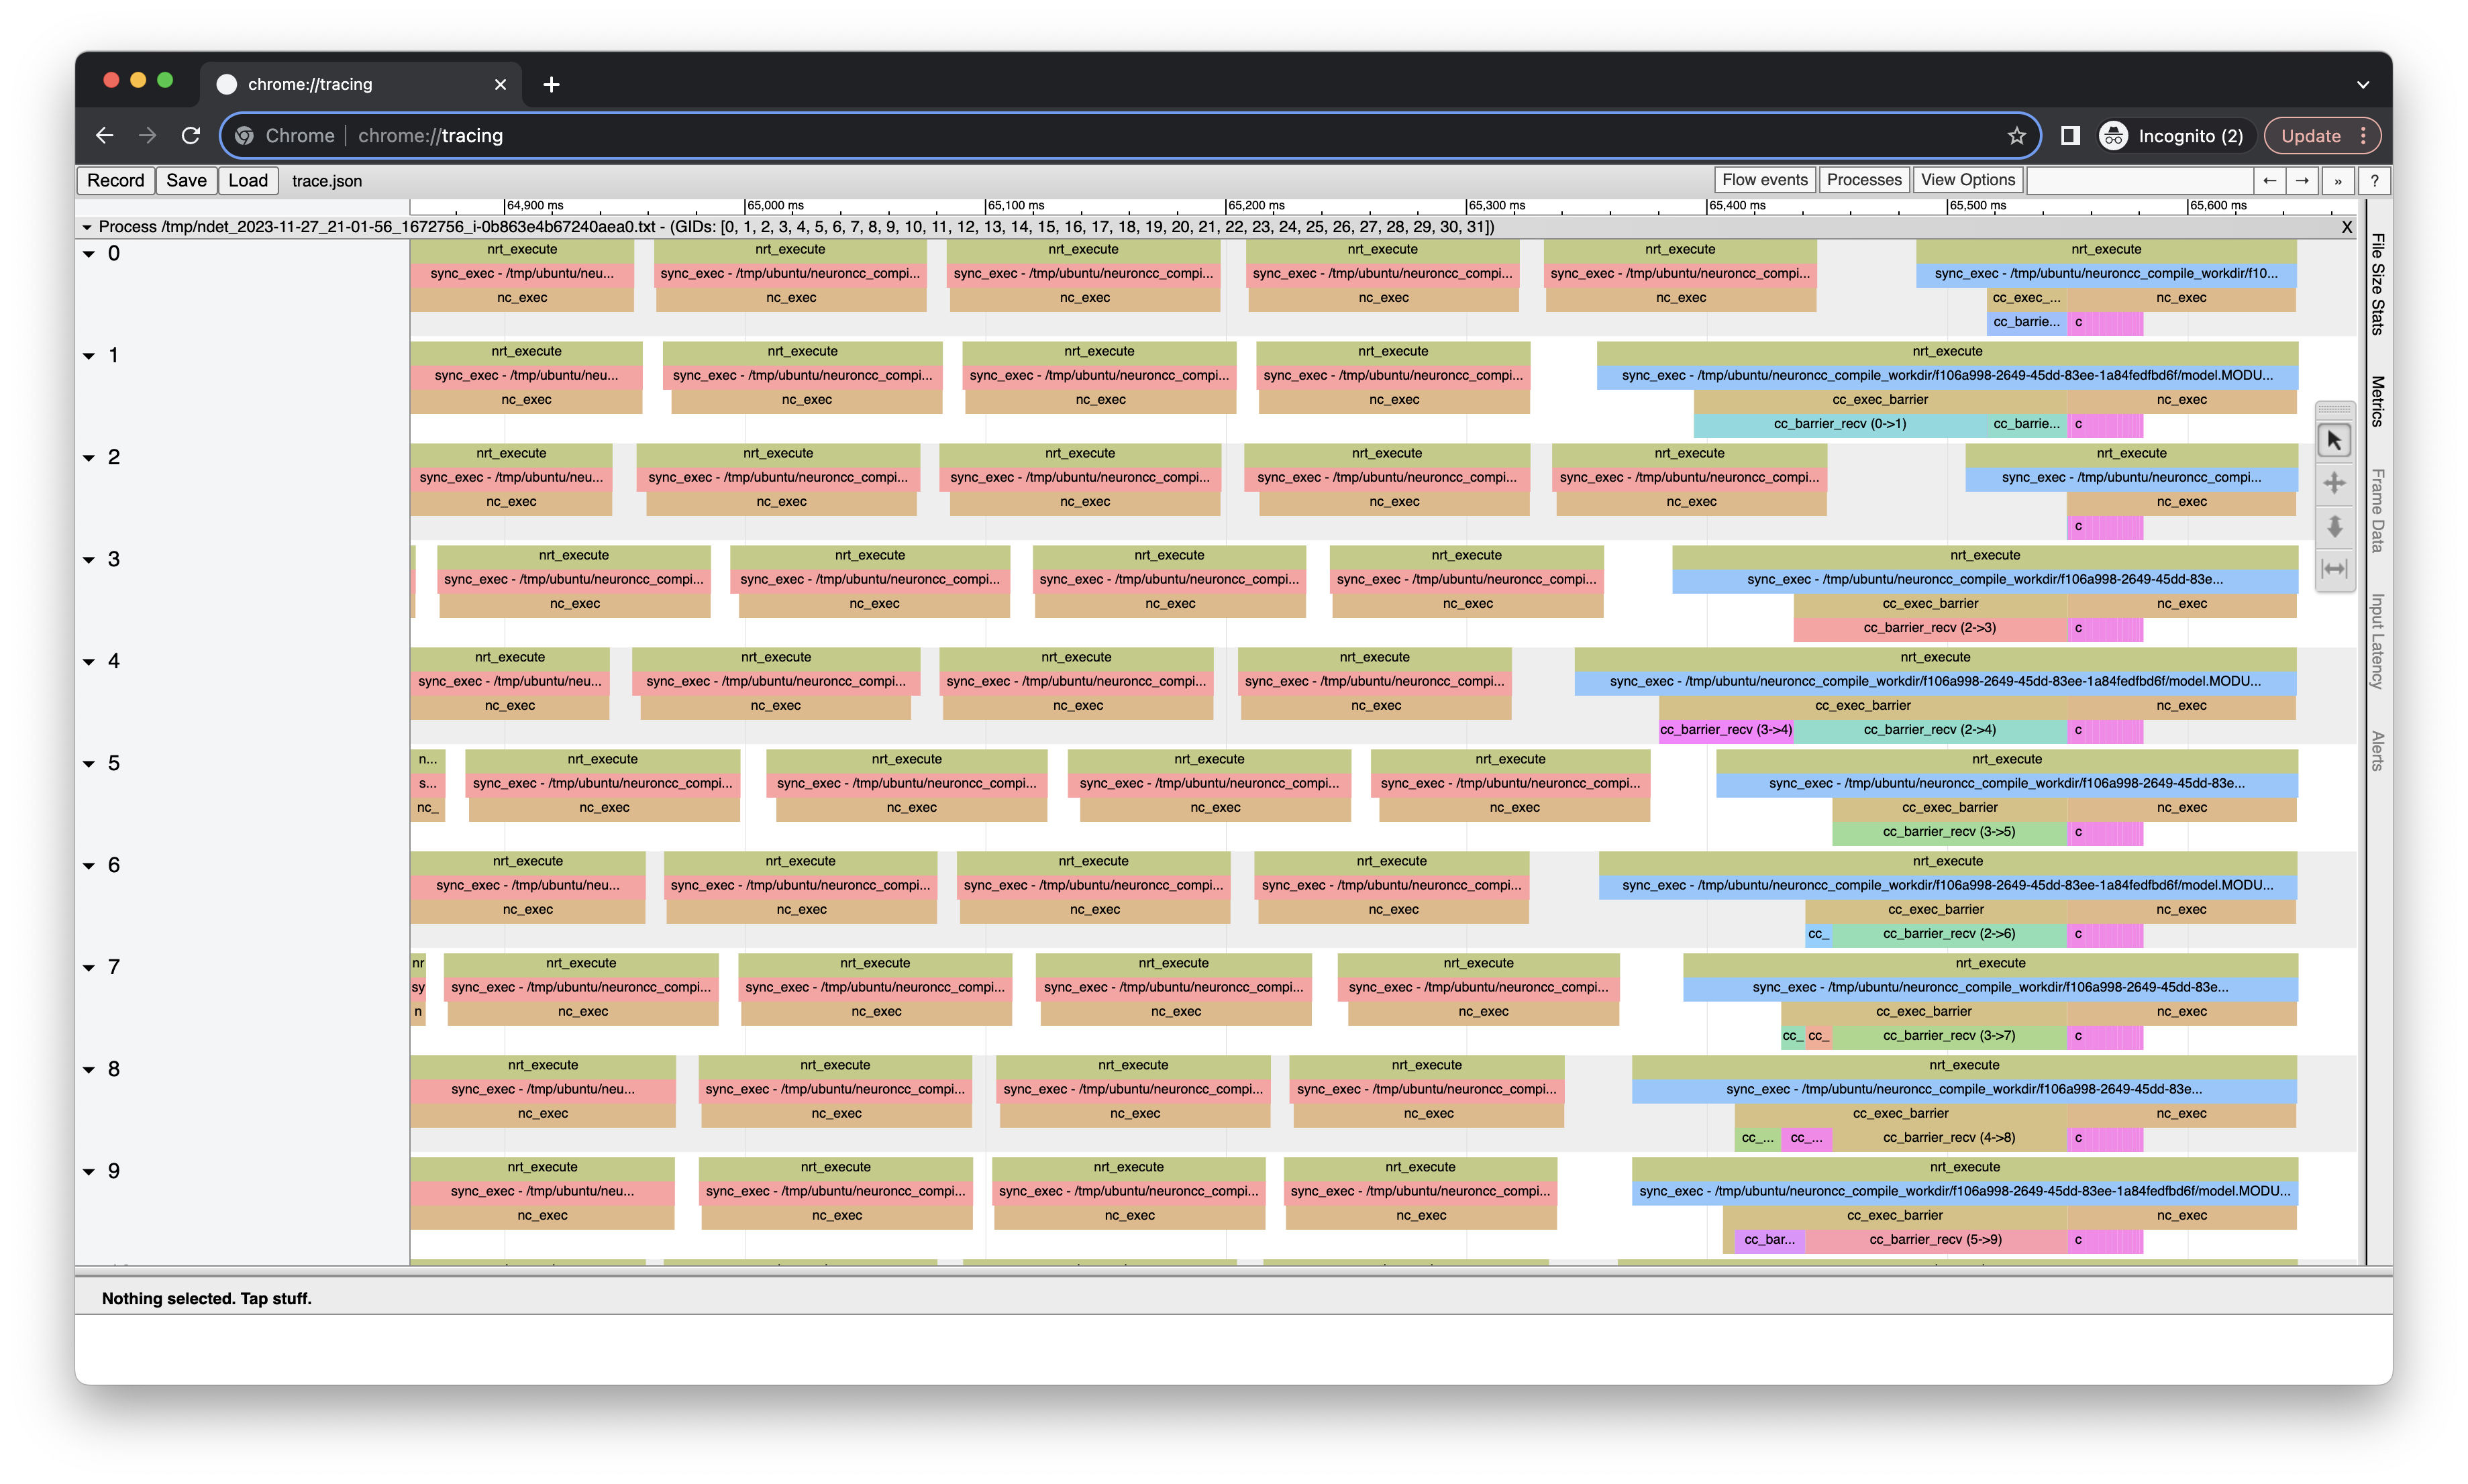
On the left, each number label corresponds with the NeuronCore index. Each core would show the activities be executed at a point in time,
such as loading a model, or more commonly executions. The nc_exec events show the duration of execution on the NeuronCores, whereas
the nrt_execute events shows the duration of the execution request, including any runtime overhead. The sync_exec event has
information on the NEFF that is being executed, with different NEFFs color-coded.
Any NEFFs that include collective communication operations (CC Ops) will have additional information, namely the cc_exec_barrier and
cc_op_exec events. In this example, the last execution (where sync_exec is blue) contains CC Ops. However, before CC Ops can begin,
we need to synchonize between all the workers participating (the replica group), which is the cc_exec_barrier. After this barrier, execution
can continue. As part of the hardware execution (nested directly under the nc_exec), each CC Op will have a corresponding cc_op_exec event (in pink).
When an execution times out (due to hardware failure, issues with the compiled NEFF, etc.), this information may be useful when determining whether the
problem lies in the collective communcation or elsewhere.
Any error event detected will be displayed in red, with ret would be set according to The LIBNRT API
in the details when clicked.

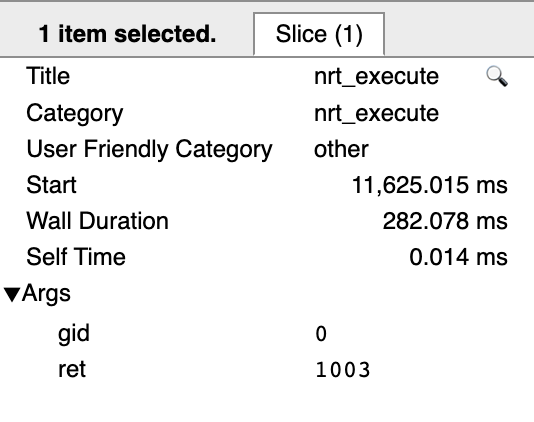
In this case, a 1003 correlates to a numerical error (NaN) which may be an issue with the inputs or the compiled model.
For additional troubleshooting, please open a ticket on the Neuron Github page and include the instance IDs, version information, NDET logs, and any other debug information as necessary.
This document is relevant for: Inf2, Trn1, Trn2